American Journal of Analytical Chemistry
Vol. 3 No. 3 (2012) , Article ID: 18266 , 9 pages DOI:10.4236/ajac.2012.33031
Mixed Micellar Electrokinetic Chromatographic Analysis of Colistin, Polypeptide Antibiotic, Using Laser-Induced Fluorescence Detection
1Department of Pharmaceutical Analysis, Faculty of Pharmacy, Damanhour University, Damanhour, Egypt
2Shool of Pharmacy, Pacific University Oregon, Forest Grove, USA
3Institute of Pharmaceutical Innovation, School of Life Science, University of Bradford, Bradford, UK
Email: *hmaahmed1973@gmail.com
Received January 19, 2012; revised February 27, 2012; accepted March 7, 2012
Keywords: Capillary Electrophoresis; Laser-Induced Fluorescence; Urine Direct Injection; Mixed Micelles; Derivatization; Colistin; Polypeptide Antibiotic; MEKC
ABSTRACT
The main goal of this work was to quantify the detection of colistin at low levels in urine samples through the practical application of mixed surfactant micellar electrokinetic chromatography-laser-induced fluorescence (MEKC-LIF) analysis method using its advantage of sensitivity and to examine direct injection of biological samples. Colistin (polymyxin E) has neither strong UV chromophore nor fluorophore. So, its assay for metabolism, pharmacokinetics studies for bioavailability and bioequivalence are difficult because of poor detectability. Therefore an enhanced UV or fluorescence detection by chemical derivatization is required. MEKC-LIF method was proposed for colistin with a 488/520 nm argon-ion laser using a pre-CE derivatization with fluorescein isothiocyanate (FITC). Borate buffer was used as background buffer (BGB). The different parameters affecting the proposed derivatization reaction including concentration of the derivatizing reagent, reaction time and temperature were studied and optimized. The derivative was stable for up to 3 days. Different micelles (TX-100 and SDS) were examined as BGB additives separately but negative-charged mixed micelles (SDS/TX-100) were shown to be the best additive to BGB for the analysis of colistin particularly in human urine as they enhance both selectivity and sensitivity of the proposed method. BGB was used with pH 9.5, 10 kV, 8 s inj time, capillary length 75 cm × 75 µm ID (66 cm effective length), detection was LIF Ex 488 nm; Em 520 nm. The method was applied to colistin analysis in human urine and the recovery was >98% (n = 5). LOD and LOQ in urine after pre-column derivatization using FITC were 100 and 250 ng/ml, respectively. Urine samples were analysed by direct injection without sample pre-treatment. The mechanism of enhancement of fluorescence of the derivative by surfactant was proposed.
1. Introduction
Colistin is a cationic polypeptide and is one of the polymyxin antibiotics known as polymyxin E, produced by Bacillus colistinus. It has a significant in vitro activity against some multiresistant Gram-negative pathogens, including Pseudomonas aeruginosa (P. aeruginosa). Till now there are limited studies on its clinical use, pharmacokinetics and pharmacodynamics. The two commercially available forms of colistin are colistin sulphate, chiefly used topically, and sodium colistin methanesulphonate, used parenterally. Both forms may be given via inhalation. Early experience showed it to be an effective antimicrobial agent for the treatment of septicaemias, wound infections, urinary tract infections and respiratory system infections caused by P. aeruginosa [1]. The predominant use over the last 20 years has been for inhalational treatment of P. aeruginosa infection in Cystic Fibrosis (CF) patients [2].
Colistin chemical structure has a cyclic heptapeptide ring with a tripeptide side-chain (Figure 1). Colistin A (polymyxin E1) and colistin B (polymyxin E2) are two major components of colistin. The proportion of colistin A and colistin B in commercial material differs between pharmaceutical suppliers and batches [3]. Colistin (base) exhibits both hydrophobicity attributable to the fatty acid moiety, and basic properties (pKa approximately 10) due to the five unmasked γ-amino groups. Therefore, it is amphipathic and able to distribute well in both polar and non-polar environments, such as in water and in prokaryotic and eukaryotic lipid membranes.
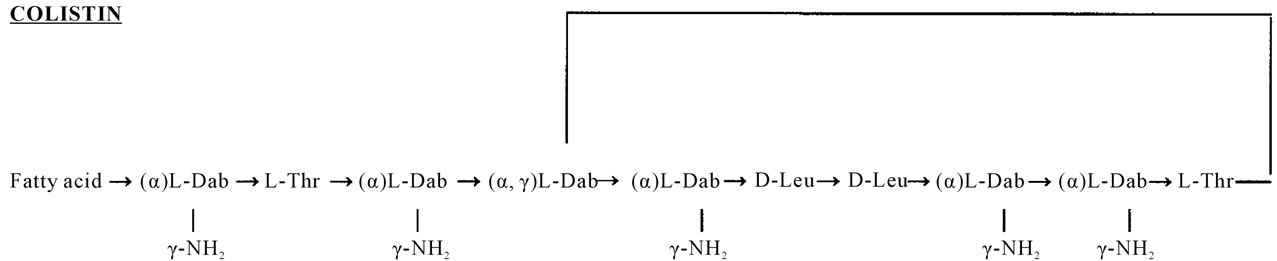
Figure 1. Chemical structures of colistin A and B. Fatty acid: 6-methyloctanoic acid for colistin A and 6-methylheptanoic acid for colistin B; Thr: threonine; Leu: leucine; Dab: α, γ-diaminobutyric acid. α and γ indicate the respective -NH2 involved in the peptide linkage.
Analytical methods reported for colistin analysis in aqueous solutions include thin layer chromatography (TLC) [4], paper chromatography [5] and HPLC with UV detection at 215 nm [6], or with diode-array detection [7,8]. Chromatographic analysis of colistin poses problems because it has very weak ultraviolet absorption and no native fluorescence. Hence, it cannot be quantified with high sensitivity by conventional techniques without derivatization with UV-absorbing or fluorescent reagents. Ortho-phthaldehyde (OPA) was used as a derivatizing agent for the determination of colistin by HPLC using pre-column derivatization [3] with UV detection at 220 nm, and by post-column derivatization [9] with fluorescence detection at an emission wavelength of 415 nm. On-line and off-line pre-column HPLC derivatization methods were also used with OPA and fluorimetric detection and was performed at 340 and 440 nm for excitation and emission wavelengths, respectively [10,11]. The main drawback of using OPA as derivatizing agent is that its derivatives are not very stable. However, fluoresceinisothiocyanate (FITC) derivatives were practicaly stable for days [12]. Dansyl chloride was used for the derivatization of colistin A and separated by HPLC and the fluorescence detection at 344 nm and 518 nm for excitation and emission wavelengths, respectively [13]. Recently, LC-tandem mass spectrometry (LC-MS/MS) has been described for the analysis of biological samples of colistin [14].
Capillary zone electrophoresis (CZE) was described for the analysis of colistin [15] and the UV detection was performed at 192 nm. However, the separation selectivity was insufficient and the efficiency was poor due to peak tailing and no quantitative data were reported. Colistin and other polymyxins were separated by MEKC method using UV detection at 214 nm [16]. In contrast laser induced fluorescence (LIF) detection has been shown to be the most sensitive of techniques for detection with CE [17,18].
Generally, it appears that instability of derivatives, length of reaction time and high cost are the main disadvantages of reported methods for colistin analysis. Furthermore, the problems of availability of large sample volume are faced with the use of alternative HPLC methods which can be solved by the use of CE.
To the best of our knowledge, fluorescein labels and/or LIF detector have not been used previously to label and/ or detect colistin or any other polymyxin. Therefore the aim of this work was to develop a new CE method with LIF detector using FITC as a derivatizing reagent. The developed method will be applied for the quantitative analysis of colistin in human urine samples by direct injection without any sample pre-treatment.
2. Materials and Methods
2.1. CE-LIF System
A model P/ACE 5510 Beckman capillary electrophoresis instrument (Fullerton, CA, USA) equipped with a 3 mW, 488 nm air-cooled argon-ion laser (Beckman Laser Module 488) was used. The fluorescence emission was 520 nm filtered by a band pass filter, and a notch filter was used to attenuate background radiation. Uncoated fused silica capillaries (75 µm ID × 363 µm OD, total length 75 cm and effective length 60 cm) were obtained from Supelco (Bellefonte, PA, USA) were accommodated in a Beckman cartridge configured for LIF detection. The capillaries were kept at constant temperature using a thermostated liquid coolant. All operations of the P/ACE unit were controlled by a PC-Pentium 75 MHz compatible computer running Beckman Gold Software. Nitrogen gas cylinder (BOC, Manchester, UK) was essential for the sample injection and to flush the capillary.
2.2. Chemicals
Colistin sulphate and FITC, pyridine, boric acid, triton X100 (TX-100) and sodium dodecy sulfate (SDS) were purchased from Sigma-Aldrich, UK. Other chemicals were of analytical grade (BDH, UK).
2.3. Procedures
2.3.1. Capillary Conditioning
Initially a new capillary was treated with 1 M NaOH for 15 min, followed by water for 10 min, and then running buffer for 10 min. Between runs, the capillary was flushed with 0.1 M NaOH for 2 min followed by running buffer for 2 min.
2.3.2. Preparation of Buffer Solutions
When buffers were employed, the salts and/or additives (like SDS) in question were weighed and transferred to a suitable volumetric flask. The salts and/or additives were dissolved by addition of some double-distilled water (about 80% - 90% v/v of total volume) before being made up to volume. The pH of the buffer was then corrected using an appropriate acid or alkali solution before filtration through a 0.45 µm membrane filter. Care was taken to ensure that the pH meter was calibrated twice daily using freshly prepared commercially available standard buffers at pH 4.0 and 7.0. All buffers were freshly prepared on a daily basis.
2.4. Analysis of Colistin in Bulk by CE-LIF after Derivatization with FITC
2.4.1. Preparation of Colistin Solutions
A standard solution containing 1 mg/ml of colistin sulfate was prepared in deionized water. Further dilutions were made with water to required concentration. From this stock standard solutions, working standard solutions containing colistin in the range of (250 - 10,000 ng/ml) were prepared by dilution with distilled water.
2.4.2. FITC Derivatization Procedure
The derivatization procedure was reported by our group [12]. However it was optimized for the CE analysis. FITC solution was freshly prepared by dissolving FITC in pyridine in a 10.0 ml vial which was capped and vortexed for 40 sec to give 0.35 mM solution. To a 300 µl of the standard solution containing colistin sulfate (250 - 10,000 ng/ml), 300 µl of 0.35 mM FITC pyridine solutions were added in a 1.0 ml Polytetrafluoroethylene (PTFE) vial. The mixture vial was capped, homogenized, vortexed for 40 sec and incubated at 80˚C in the oven for 20 min. After cooling, the derivative solution was analysed by CE without dilution.
2.4.3. CE Operating Parameters for Separation of the FITC-Colistin Derivative
The BGB consisted of 0.15 g Boric acid, 1 ml v/v TX- 100 and 2.3 g w/v SDS in deionized distilled water in 100 ml volumetric flask. The pH was adjusted to 9.2 with 9 M NaOH solution using a magnetic stirrer and pH meter and the volume was completed with distilled water. Sample introduction was performed by hydrodynamic injecttion at 50 mbar for 1 - 10 s. Separations were performed at room temperature (25˚C) using a separation voltage of 10 - 30 kV and on-line detection with the LIF detection system (Ex 488 nm, Em 520 nm). The capillary length was 75 cm with 75 µm i.d. and the effective length was 66 cm.
2.5. CE-LIF Separation of Colistin in Spiked Urine after Derivatization with FITC
2.5.1. Preparation of Colistin Spiked Urine (CSU) Samples
Human urine samples were collected from seven different subjects (males and females). The urine samples were mixed and a representative 2 L sample was taken for the preparation of the standard solutions. Apramycin (APR) was used as an internal standard to give internal standard urine solution with concentration of 0.2 mg/ml urine. Colistin, 0.1 gm was spiked into 100 ml urine to give concentration 1 mg/ml then 10 ml was taken from the last solution to a 100 volumetric flask and made up to the volume with the internal standard urine solution to give a concentration of 100 µg/ml. Different drug concentrations ranging from 250 to 10,000 ng/ml were prepared by serial dilution of colistin in the internal standard urine solution.
2.5.2. CE Procedure for CSU
The derivatization of the spiked urine samples was performed as above. CE parameters were, capillary length 75 cm with 75 µm I.D. (66 cm effective length) and BGB consisted of 0.2 boric acid, 1.75% TX-100, 5.25 g SDS in 100 ml volumetric flask and the volume was completed with water. The pH was adjusted to 9.5 with 9 M NaOH. The applied voltage was 10 kV and the injection time was 8 s.
3. Results and Discussion
3.1. Optimization of Derivatization Conditions for Colistin with the FITC Derivatizing Reagent
Colistin can be considered a polyamine due to the presence of five amino groups in its chemical structure. The FITC reaction can be described as a nucleophilic attack of the amino group on the isothiocyanate moiety to form a thiocarbamylated product [19]. However the amine must be in its uncharged form to participate in this reaction and this will need an alkaline pH. Therefore, pyridine was selected as the reaction medium for the experiment. The fluorescence intensity of the fluorescein-thiocarbamyl colistin is markedly increased with high stability of the derivatized product (up to 3 days) and a short derivatization reaction time was needed.
For optimization of other derivatization conditions for colistin with FITC derivatizing reagent, several reaction parameters were studied, including concentration of FITC, reaction time and reaction temperature.
3.1.1. Effect of Molar Ratio and Concentration of FITC
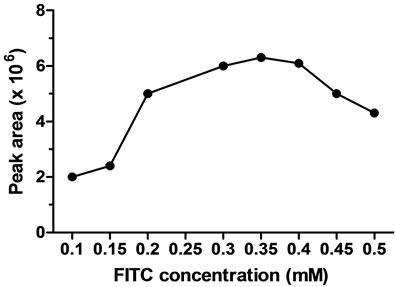
At low FITC concentration, the target analyte did not react with the fluorescent probe on a molar to molar basis. A high molar excess of the fluorescent probe was required to label successfully trace amounts of analyte. This in turn introduced spurious peaks that sometimes mask the peak of the target analyte. On the other hand, In order to obtain high labeling efficiency, high concentrations of labeling reagents were necessary because FITC undergoes photolysis and hydrolysis in aqueous medium [20]. Therefore the effect of FITC concentration on the reaction yield was examined in the range of 0.1 - 0.55 mM. The concentration of FITC was a critical and the maximum yield was obtained at 0.35 mM FITC, while a further incremental concentration significantly decreased the peak height of the derivatized colistin peak, and the optimum FITC concentration for the determination of colistin was 0.35 mM pyridine (Figure 2(a)).
3.1.2. Effect of Derivatization Reaction Time
The required time for completion of the reaction between FITC and colistin was investigated by comparison of the peak areas of colistin-FITC derivatives at various time intervals. The effect of the reaction time was examined by allowing the derivatization to proceed for various times ranging from 5 to 60 min. The FITC-colistin derivative was formed within 10 min, but maximum yield was obtained at 80˚C for 20 min (Figure 2(b)). After 20 min at 80˚C, the derivatization reaction could be completed to give a maximum peak area that did not significantly decline until 50 min, indicating that the derivative was sufficiently stable under the proposed reaction conditions; therefore, 20 min was used for colistin derivatization in subsequent experiments.
3.1.3. Effect of Reaction Temperature
Reaction temperature was also examined and it was critical parameter for this derivatization reaction. The effect of temperature was achieved by allowing the reaction to proceed at different incubation temperatures ranging from 25˚C to 100˚C. The rate of reaction of colistin with FITC was increased as temperature increased up to 85˚C.
A number of peaks appeared in the elechropherogram suggesting that the colistin derivative had degraded at temperature higher than 85˚C. Therefore, 80˚C was selected for FITC-colistin derivatization reaction (Figure 2(c)).
3.2. MEKC Analysis of Derivatized Colistin
Since the colistin components (A, B) have equal or nearly equal charge-to-mass ratios, their electrophoretic mobili-
 (a)
(a)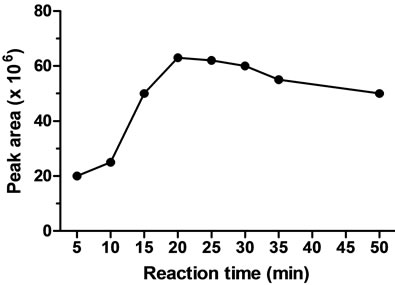 (b)
(b)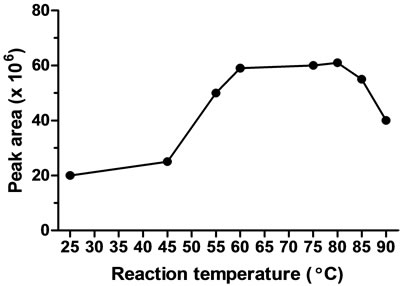 (c)
(c)
Figure 2. Effect of FITC concentration (a), reaction time (b), and reaction temperature (c) on the FITC-colistin derivatization yield.
ties were quite similar, and therefore separation selectivity is difficult as their structures differ only by a single methylene group [16]. Fortunately, both Colistin A and B are therapeutically active antibiotics and an assay of colistin would require both concentrations [21]. Therefore, there was a decision not to separate A and B and there was a focus on analysis time and fluorescence intensity (peak height) rather than their complete separation.
SDS was used in these experiments as running buffer additive at 2.3 g% w/v in 0.6 g% w/v boric acid solution and the derivatized colistin eluted last in the electropherogram (Figure 3 blue). The derivatized colistin was completely separated from the background. This indicated that colistin was distributed into SDS micelles more readily than the other interfering substances (Figure 3 blue). However, the obtained peaks were broad and with long migration time. Therefore, another type of surfactants such as non-ionic surfactants was tested as
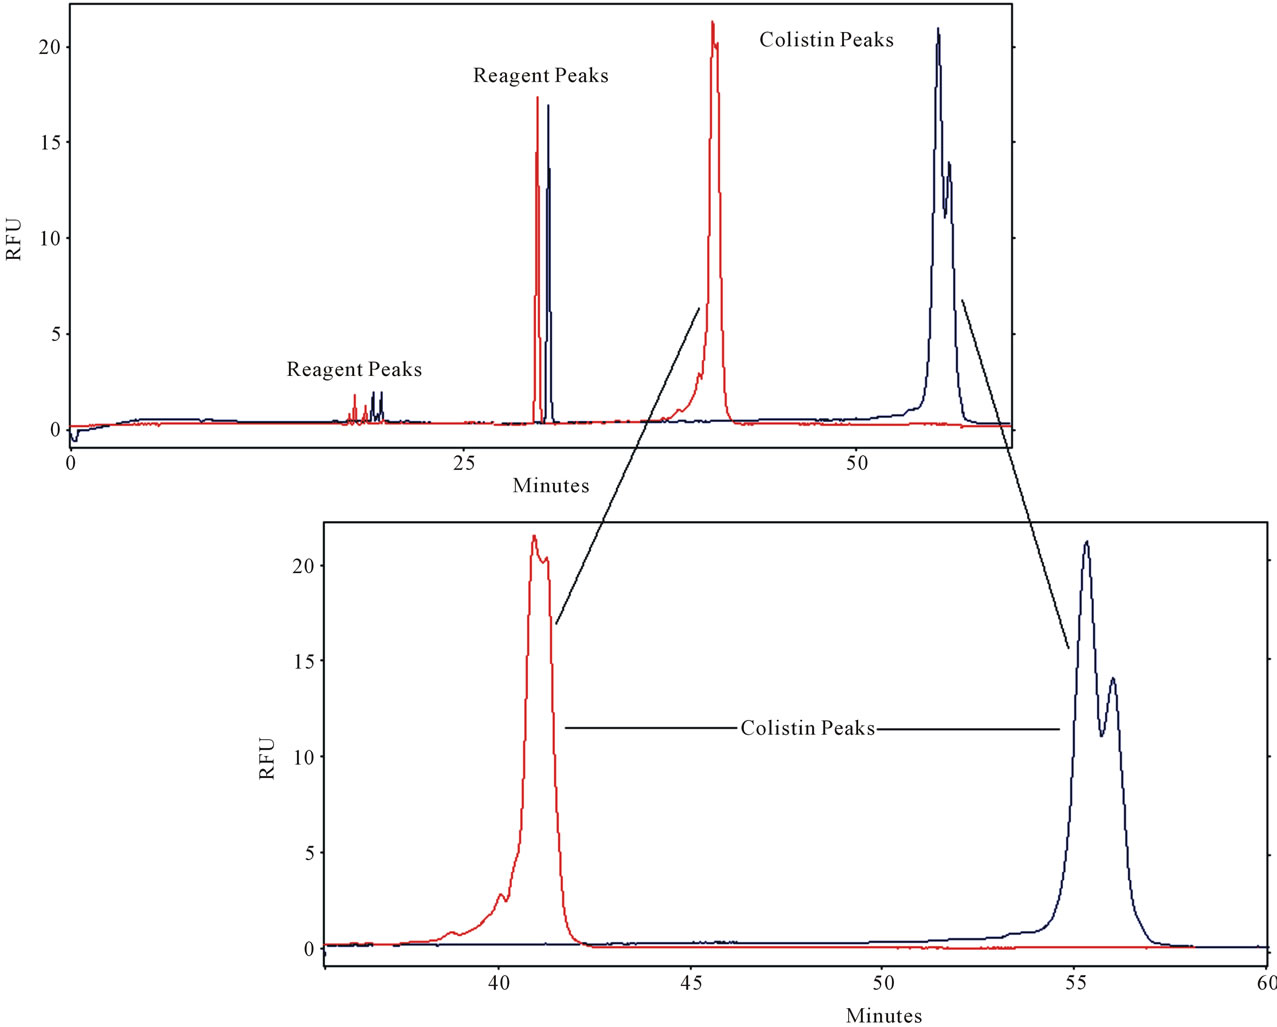
Figure 3. Effect of TX100 on BGB in presence of SDS (2.3 g%) on colistin (5 µg/ml) analysis. CE conditions Blue: BGB (0.6 boric acid + 2.3 gm SDS dissolved in 80 ml water in 100-ml volumetric flask and the pH adjusted to 9.5 with 9 M NaOH then complete the volume to 100 ml with water, 17.5 kV, 2 s injection time, capillary length 75 cm × 75 µm ID (66 cm effective length), detection was LIF Ex 488 nm; Em 520 nm, CE conditions Red: the same + 1 ml TX100.
buffer additive. Using 1% v/v TX-100 as an additive in the running buffer achieved a good separation (Figure 3). Colistin peak migration time was decreased by about 15 min in the electrogram (Figure 3 red) compared to (Figure 3 blue) and the peak width reduced with increased height.
High buffer concentrations are not recommended because of internal heating problems within the capillary particularly with the analysis of polpeptides like colistin. Also, an increase in the analysis time with broad peaks can be produced with very high buffer concentrations. Moreover it generally necessitates a reduced applied voltage level since the current increases with buffer concentration. However, higher voltage was applied with low buffer electrolyte concentration and sharper peaks with short analysis time were obtained (Figure 4). The colistin peak migration time was decreased by about 25 min in the electrogram (Figure 4(c)) compared with (Figure 3) and a reduced peak width with increased height was observed. A single peak is produced unlike two peaks from the other experiments. The lower boric acid concentration the higher the voltage which can be applied. A reduction in the boric acid concentration in the BGB with 30 kV, the migration time of the colistin peak was shortened to about 9 min (Figure 4(b)) compared to (Figure 4(c)).
Therefore, the best results were obtained with BGB consisted of 0.3 g boric acid, 1 ml TX-100, 2.3 gm SDS, which were mixed in 100 ml volumetric flask with pH 9.5 and the volume was made up with water. The applied voltage was 30 kV and the injection time was 2 s using capillary with 75 cm length and 75 µm I.D (66 cm effective length).
The most likely explanation for these observations is
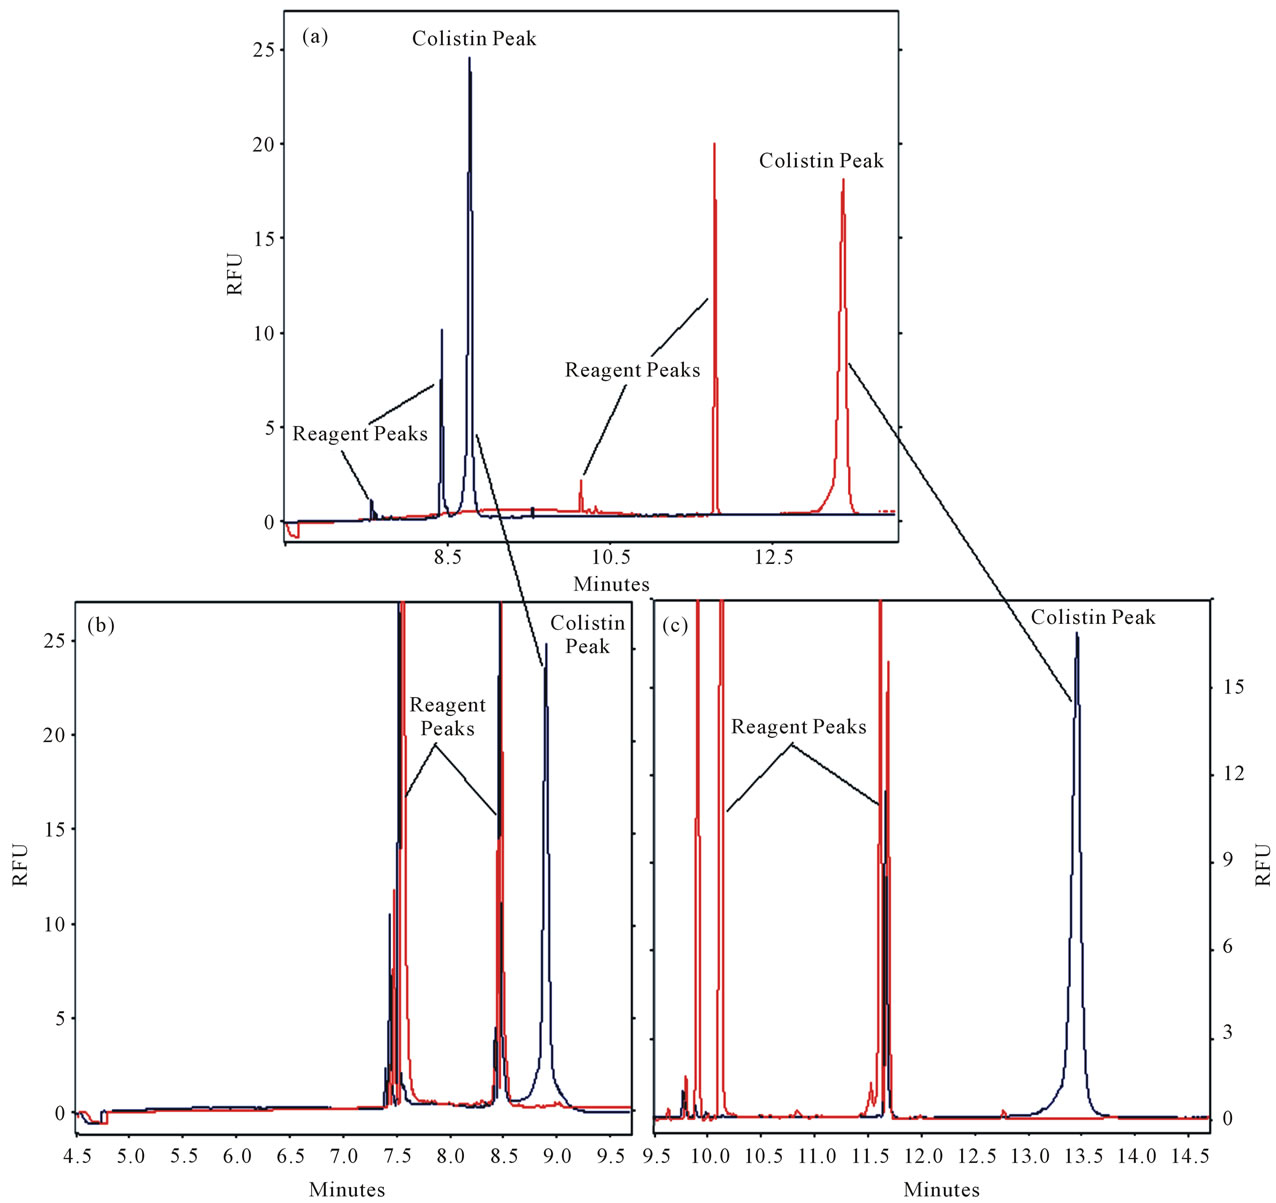
Figure 4. Effect of Boric acid concentration on colistin (5 µg/ml) analysis. CE conditions C: BGB (0.3 g boric acid + 1 ml TX 100 + 2.3 gm SDS/H2O and the pH adjusted to 9.5 with 9 M NaOH then complete the volume to 100 ml with water in a 100 ml volumetric flask, 25 kV, 2 s inj time, capillary length 75 cm × 75 µm ID (66 cm effective length), detection was LIF Ex 488 nm; Em 520 nm. CE conditions for B: the same as C but with 30 kV and 0.15 g boric acid.
that mixed SDS/TX-100 micelles are formed, and possess smaller electrophoretic mobilities than pure SDS micelles which showed an improvement in separation. On the other hand, Micelles interact with the fluorophore through a variety of interactions (i.e, electrostatic interaction, hydrogen bonding, hydrophobic interaction, Van der Waals forces) [22]. The amphiphilic fluorescent derivatizing reagent may be oriented with its polar portion in the surface layer and its nonpolar portion (12 carbon hydrophobic tail) that anchors in the hydrophobic core in the micelles. This interaction solubilize the fluorophore and reduces the probability of non-radioactive decay of the excited state, thus enhancing fluorescence emission.
3.3. Analysis of CSU Following FITC Derivatization
The urine sample was directly injected for analysis in CE without the requirement of extraction, such as liquidliquid extraction or solid phase extraction (SPE), which are commonly used for biological sample handling [23].
An increase in the SDS concentration in the BGB was required not only to give a good resolution of the colistin peak from the interfering substances but also to solubilise the large amount of biological background which will block the capillary and stop the current. As well, an increase in TX100 was also needed to maintain the ratio in BGB as TX100: SDS equals 1% v/v: 2.3 g% w/v. The increase in SDS and TX100 in the BGB caused an increase in the current so a reduction in the applied voltage was necessary for the method as low as 10 kV but this caused, as expected, an increase in the migration time of all components versus 30 kV. This increase not only attributed to the low applied voltage but also due to the increase in SDS concentration. Endogenous components present in urine were also shown not to co-migrate with colistin (Figure 5).
3.4. Method Validation for CSU Samples
Method validation procedures were performed according to FDA guidelines and as explained previously [24,25], to evaluate the suitability of the method for the quantitative determination of colistin in human urine samples.
3.4.1. Linearity
A urine sample matrix can lead to interference of the colistin peak. However the control urine was spiked with increasing amounts of colistin standard to create calibretion standards. Linearity was examined over the range of 250 - 10,000 ng/ml (six points, six replicates). Standard curves were created by plotting peak-area ratio against concentration of colistin (Table 1).
3.4.2. Sensitivity
The LOD and LOQ for colistin spiked in human urine were estimated practicaly using a signal-to-noise ratio of 3 and 10, respectively (Table 1).
3.4.3. Precision and Recovery
The intraand inter-day precision and recovery of the assay were established by calculating the mean concentration of five replicates at three different concentrations of CSU (400, 1000 and 2500 ng/ml). The recovery of colistin was determined by comparing replicate (n = 5) peak area ratios of urine spiked with known amounts of drug (400, 1000 and 2500 ng/ml) versus peak area ratios of the same concentrations calculated from the resultant regression line. The precision and recovery data obtained from CSU are summarised in Table 2.
3.4.4. Stability
The long-term stability of the FITC-colistin derivative was examined by repeated injections of the same sample (1 µg/ml) at different times over a period of 3 days, when stored at room temperature in an amber closed vial, and by comparing with freshly prepared standard (1 µg/ml).
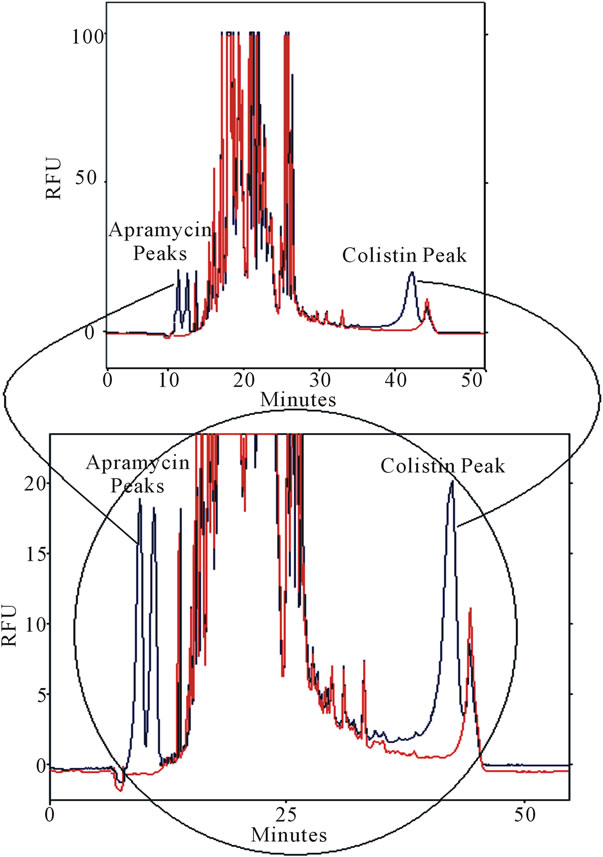
Figure 5. Determination of colistin (1 µg/ml) in spiked urine. CE conditions: BGB (0.2 g boric acid + 1.75 ml TX100 + 5.25 gm SDS/H2O and the pH 9.5 then complete the volume to 100 ml with water in a 100 ml volumetric flask, 10 kV, 8 s inj time, capillary length 75 cm × 75 µm ID (66 cm effective length), detection was LIF Ex 488 nm; Em 520 nm.
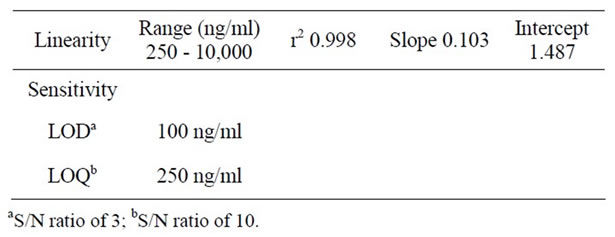
Table 1. Linearity and sensitivity data for the proposed method for CSU assay after FITC derivatization.
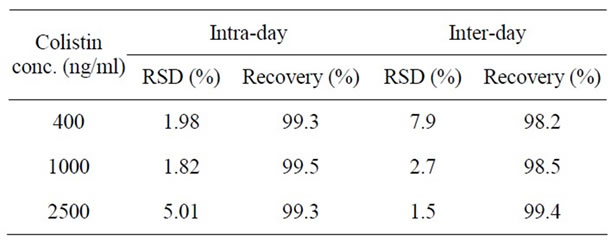
Table 2. Inter-day and Intra-day recovery and precision data for the proposed method for CSU assay after FITC derivatization.
No significant change was found after 3 days (RSD < 2%), indicating favourable stability of the derivative.
4. Conclusion
A MEKC-LIF using a pre-CE derivatization with FITC has been developed for colistin analysis. It was found that SDS and TX-100 as buffer additives played a key role in improving resolution, selectivity, and sensitivity of the method. The method was applied for the analysis of colistin in human urine samples by direct injection without any sample pre-treatment procedures. The validation results of this method indicate that it is accurate, precise, and sensitive enough to be used for the analysis of colistin in urine samples.
REFERENCES
- M. E. Evans, D. J. Feola and R. P. Rapp, “Polymyxin B Sulfate and Colistin: Old Antibiotics for Emerging Multiresistant Gram-Negative Bacteria,” Annals of Pharmacotherapy, Vol. 33, No. 9, 1999, pp. 960-967. doi:10.1345/aph.18426
- T. Jensen, S. S. Pedersen, S. Garne, C. Heilmann, N. Hoiby and C. Koch, “Colistin Inhalation-Therapy in Cystic-Fibrosis Patients with Chronic Pseudomonas-Aeruginosa Lung Infection,” Journal of Antimicrobial Chemotherapy, Vol. 19, No. 6, 1987, pp. 831-838. doi:10.1093/jac/19.6.831
- D. Decolin, P. Leroy, A. Nicolas and P. Archimbault, “Hyphenated Liquid Chromatographic Method for the Determination of Colistin Residues in Bovine Tissues,” Journal of Chromatographic Science, Vol. 35, No. 12, 1997, pp. 557-564.
- A. H. Thomas and I. Holloway, “Thin-Layer Chromatographic Method for Identification of Polymyxins,” Journal of Chromatography, Vol. 161, 1978, pp. 417-420.
- T. Suzuki, H. Inouye, K. Fujikawa and Y. Suketa, “Studies on the Chemical Structure of Colistin: I. Fractionation, Molecular Weight Determination, Amino Acid and Fatty Acid Composition,” Journal of Biochemistry, Vol. 54, No. 1, 1963, pp. 25-30.
- J. A. Orwa, C. Govaerts, K. Gevers, E. Roets, A. Van Schepdael and J. Hoogmartens, “Study of the Stability of Polymyxins B-1, E-1 and E-2 in Aqueous Solution Using Liquid Chromatography and Mass Spectrometry,” Journal of Pharmaceutical and Biomedical Analysis, Vol. 29, No. 1-2, 2002, pp. 203-212. doi:10.1016/S0731-7085(02)00016-X
- B. C. Grande, M. S. G. Falcon, C. Perez-Lamela, M. R. Comesana and J. S. Gandara, “Quantitative Analysis of Colistin and Tiamulin in Liquid and Solid Medicated Premixes by Hplc with Diode-Array Detection,” Chromatographia, Vol. 53, No. 1, 2001, pp. S460-S463. doi:10.1007/BF02490378
- P. Perez-Lozano, E. Garcia-Montoya, A. Orriols, M. Minarro, J. R. Tico and J. M. Sune-Negre, “Application of a Validated Method in the Stability Study of Colistin Sulfate and Methylparaben in a Veterinary Suspension Formulation by High-Performance Liquid Chromatography with a Diode Array Detector,” Journal of Aoac International, Vol. 90, No. 3, 2007, pp. 706-714.
- G. Morovjan, P. P. Csokan and L. Nemeth-Konda, “Hplc Determination of Colistin and Aminoglycoside Antibiotics in Feeds by Post-Column Derivatization and Fluorescence Detection,” Chromatographia, Vol. 48, No. 1-2, 1998, pp. 32-36. doi:10.1007/BF02467512
- B. Cancho-Grande, M. Rodriguez-Comesana and J. Simal-Gandara, “Simple Hplc Determination of Colistin in Medicated Feeds by Pre-Column Derivatization and Fluorescence Detection,” Chromatographia, Vol. 54, No. 7-8, 2001, pp. 481-484. doi:10.1007/BF02491203
- S. Morales-Munoz and M. D. L. De Castro, “Dynamic Ultrasound-Assisted Extraction of Colistin from Feeds with On-Line Pre-Column Derivatization and Liquid Chromatography-Fluorimetric Detection,” Journal of Chromatography A, Vol. 1066, No. 1-2, 2005, pp. 1-7. doi:10.1016/j.chroma.2005.01.010
- M. Mashat, H. Chrystyn, B. J. Clark and K. H. Assi, “Development and Validation of HPLC Method for the Determination of Tobramycin in Urine Samples Post-Inhalation Using Pre-Column Derivatisation with Fluorescein Isothiocyanate,” Journal of Chromatography B, Vol. 869, No. 1-2, 2008, pp. 59-66. doi:10.1016/j.jchromb.2008.05.012
- D. J. Gmur, C. R. Bredl, S. J. Steele, S. P. Cai, D. R. Vandevanter and P. A. Nardella, “Determination of Polymyxin E-1 in Rat Plasma by High-Performance Liquid Chromatography,” Journal of Chromatography B, Vol. 789, No. 2, 2003, pp. 365-372. doi:10.1016/S1570-0232(03)00162-4
- Y. Dotsikas, C. K. Markopoulou, J. E. Koundourellis and Y. L. Loukas, “Validation of a Novel LC-MS/MS Method for the Quantitation of Colistin A and B in Human Plasma,” Journal of Separation Science, Vol. 34, No. 1, 2011, pp. 37-45. doi:10.1002/jssc.201000680
- J. W. Kang, T. Vankeirsbilck, A. Van Schepdael, J. Orwa, E. Roets and J. Hoogmartens, “Analysis of Colistin Sulfate by Capillary Zone Electrophoresis with Cyclodextrins as Additive,” Electrophoresis, Vol. 21, No. 15, 2000, pp. 3199-3204. doi:10.1002/1522-2683(20000901)21:15<3199::AID-ELPS3199>3.0.CO;2-8
- H. K. Kristensen and S. H. Hansen, “Separation of Polymyxins by Micellar Electrokinetic Capillary Chromatography,” Journal of Chromatography, Vol. 628, 1993, pp. 309-315. doi:10.1016/0021-9673(93)80013-X
- S. Ahuja and N. Jespersen, “Modern Instrumental Analysis,” Elsevier Pub., Amsterdam, 2006.
- N. Simeon, E. Chatelut, P. Canal, M. Nertz and F. Couderc, “Anthracycline Analysis by Capillary Electrophoresis: Application to the Analysis of Daunorubicine in Kaposi Sarcoma Tumor,” Journal of Chromatography A, Vol. 853, No. 1-2, 1999, pp. 449-454.
- M. Brinkley, “A Brief Survey of Methods for Preparing Protein Conjugates with Dyes, Haptens and Crosslinking Reagents,” Bioconjugate Chemistry, Vol. 3, No. 1, 1992, pp. 2-13. doi:10.1021/bc00013a001
- Y. Huang, J. P. Duan, Q. R. Chen and G. N. Chen, “Micellar Electrokinetic Chromatography of Enkephalin-Related Peptides with Laser-Induced Fluorescence Detection,” Electrophoresis, Vol. 25, No. 7, 2004, pp. 1051- 1057. doi:10.1002/elps.200405810
- P. P. H. Le Brun, A. I. De Graaf and A. Vinks, “High- Performance Liquid Chromatographic Method for the Determination of Colistin in Serum,” Therapeutic Drug Monitoring, Vol. 22, No. 5, 2000, pp. 589-593. doi:10.1097/00007691-200010000-00014
- Y. M. Liu, M. Schneider, C. M. Sticha, T. Toyooka and J. V. Sweedler, “Separation of Amino Acid and Peptide Stereoisomers by Nonionic Micelle-Mediated Capillary Electrophoresis after Chiral Derivatization,” Journal of Chromatography A, Vol. 800, No. 2, 1998, pp. 345-354. doi:10.1016/S0021-9673(97)01137-0
- A. B. Wey and W. Thormann, “Capillary Electrophoresis-Electrospray Ionization Ion Trap Mass Spectrometry for Analysis and Confirmation Testing of Morphine and Related Compounds in Urine,” Journal of Chromatography A, Vol. 916, No. 1-2, 2001, pp. 225-238. doi:10.1016/S0021-9673(00)01096-7
- F. A. Elbarbry and A. S. Shoker, “Liquid Chromatographic Determination of Mycophenolic Acid and Its Metabolites in Human Kidney Transplant Plasma: Pharmacokinetic Application,” Journal of Chromatography B-Analytical Technologies in the Biomedical and Life Sciences, Vol. 859, No. 1, 2007, pp. 276-281. doi:10.1016/j.jchromb.2007.09.036
- F. Elbarbry, K. Wilby and J. Alcorn, “Validation of a Hplc Method for the Determination of P-Nitrophenol Hydroxylase Activity in Rat Hepatic Microsomes,” Journal of Chromatography B-Analytical Technologies in the Biomedical and Life Sciences, Vol. 834, No. 1-2, 2006, pp. 199-203. doi:10.1016/j.jchromb.2006.02.006
NOTES
*Corresponding author.