Open Journal of Modern Neurosurgery
Vol.4 No.2(2014), Article ID:45348,16 pages DOI:10.4236/ojmn.2014.42017
The EEG Analysis of Auditory Emotional Stimuli Perception in TBI Patients with Different SCG Score
Portnova Galina*, Kseniia Gladun, Ivanitskii Alexey
Institute of Higher Nervous Activity and Neurophysiology of Russian Academy of Science (IHNA), Moscow, Russia
Email: *caviter@list.ru, kseniya.gladun.87@mail.ru, alivanit@aha.ru
Copyright © 2014 by authors and Scientific Research Publishing Inc.
This work is licensed under the Creative Commons Attribution International License (CC BY).
http://creativecommons.org/licenses/by/4.0/


Received 1 March 2014; revised 1 April 2014; accepted 10 April 2014
ABSTRACT
The electroencephalographic research has focused on the variety of responses to emotional auditory stimulation in patients at different stages after craniocerebral trauma. The patients sampling consisted of three groups: 13 comatose patients, 14 severe TBI patients, 12 moderate TBI patients, the control group consisting of the 28 healthy adults. The subjects were stimulated with auditory stimuli containing significant sounds (coughing, laughing, crying, bird singing, barking, scraping) and control sounds (white noise). We have analyzed statistically significant differences of power of the rhythmic activity registered during the presentation of different types of stimuli using Matlab. The t-test differences for each type of stimuli and the background were calculated as well as major ANOVA-effects. The results showed that EEG-response was based on the emotional stimuli valence, the consciousness levels, the severity of injury and the recovery process. The TBI patients showed lower theta-rhythm power in the frontal areas in response to the all emotional stimuli. The alpha-activity was reduced in the TBI patients: the alpha-rhythm depression was most vividly pronounced in the control group. The alpha-rhythm acceleration in the occipital areas was found only in the moderate TBI patients and only to the emotional stimuli. The severe TBI and comatose patients showed lower response rates to the neutral stimuli and higher response rates to the unpleasant physiological stimuli.
Keywords:Comatose Patients, TBI, EEG, Rhythmic Power, Recovery

1. Introduction
This study investigates the brain activity indicators and recovery predictors in unconscious patients with severe or moderate TBI. These patients have different recovery forecasts in spite of similar numerical behavioral rating scale scores in acute state. The diagnosis of consciousness level and moreover the prognosis of unconscious patients is really difficult to make by the means limited behavioral, speech or motor responses. Neurovisual, functional or clinical diagnostic methods often can not help estimate recovery prognosis or rehabilitation abilities [1] . There are broad clinical data classifying unconsciousness states [2] and very few clinical and electrophysiological data trying to classify recovery states [3] . These clinical data showed to have some electrophysiological correlations but couldn’t be classified according to the existing behavioral rating scales. Traditional electroencephalographic (EEG) measures have shown their efficacy in clinical analysis and predicted outcome after traumatic brain damage [4] -[6] . EEG and ERPs studies of the TBI diagnosis demonstrated high level of sensitivity and specificity in the research of individual EEG predictors, occurring within 1 to 21 days following the injury [7] . The ERP and MMN studies have shown the predictive value of somatosensory evoked potentials and mismatch negativity in the prognosis of absence of full recovery [8] [9] . There are some data which showed that occipital alpha-rhythm correlated with good prognosis in TBI patients, but irregular alpha-rhythm was found in patients with bad dynamic of TBI recovery. The EEG recorded with TBI patients showed increased deltarhythm and decreased alpha-rhythm [10] . Acceleration of slow-wave rhythmic activity correlates with poor survival in TBI patients in the acute stage [11] [12] , nevertheless the existence of slow-wave activity doesn’t always correlate with bad prognosis in TBI patients [13] . The prognosis should be based on the combination of changes in EEG spectrum [14] .
The most significant results in search of TBI prognosis markers could be achieved by investigation of EEG time changes and EEG changes after the stimulation [7] . Auditory stimuli could cause significant changes of EEG rhythmic spectrum that are found in patients with good TBI prognosis [15] [16] . It was discovered that different stimulations (and especially emotional) could be effectively applied in rehabilitation programs of TBI patients. The significantly improved cognitive functioning was found in the treatment program where emotional stimuli were presented in a real face format [17] . There is substantial evidence to support cognitive rehabilitation for TBI patients, including strategy training for mild memory impairment, strategy training for postacute attention deficits, and interventions functional communication deficits [18] .
In this article we suggest that there are recovery mechanisms based on different stimuli perceptions. Therefore, on different unconsciousness recovery stages it’s possible to find the changes in response of TBI patients [19] . The preservation level of cognitive function can be determined by measuring the response of the brain rhythms to emotionally significant stimuli in different modalities. We studied a variety of responses to emotionally important auditory stimulation during the regression of unconsciousness, which have prognostic value and can be used as an effective rehabilitation procedure.
2. Methods
2.1. Subjeccts
1) patients in coma (13 subjects in the 1st stage coma) 4 - 7 scores by The GCS; 2) 14 patients had severe TBI 3 - 12 months ago with 8 - 11 scores by The GCS at the moment of study; 3) 12 patients had moderate TBI 1 - 10 months ago with 12 - 14 scores by The GCS; 4) control group of 28 healthy adults with 12 - 14 scores by The GCS.
2.2. Stimuli
We analyzed pairs of stimuli: animal sounds (bird song, barking), emotional state sounds (laughing, crying), sounds of physiological state (coughing) and household sounds (scraping), and neutral sounds (white noise) as a control. All types of sounds were randomized and had 10-sec duration repeated 10 times, and were presented via earpieces. 7 minutes of normal brain activity of the subject relaxed (with eyes closed) was recorded and used as a baseline for normal EEG behavior for comparative purposes.
2.3. EEG-Recording
EEG data was recorded using the portable device “Entsefalan” under the experts’ clinical supervision. The EEG data was collected in a continuous mode using a 250 Hz sampling frequency for all the subjects. The total number of electrodes used was 19 following the MCN montage. This is a total of 250 × 19 data points collected per second per subject. The EEG recording time for each subject was no more than 45 minutes. The cut-off frequencies for the filters used were 0.15 Hz for the High pass and 100 Hz for the low pass. This range allowed us to eliminate unwanted frequency components and, at the same time, fit our data to the spectrum ranges most common when analyzing EEG signals. Eye movement (electrooculogram, EOG) was recorded from electrodes placed above and below a subject’s left eye to allow for the removal of artifacts from the EEG. Another electrode, placed at the centre of the forehead, was grounded. All the electrodes were maintained below 5000 ohms, and the impedance difference between the left and the right was not allowed to exceed 500 ohms.
2.4. Algorithm
We analyzed 10 files of each type: the baseline, sound of coughing, scraping, crying, laughing, bird song, barking and white noise. A Fourier Transform (FT) is performed on these sections of the EEG data to determine the power content of the frequency bands in order to perform spectrum analysis. The resulting waveforms are displayed as a brain map to show the power distribution within each frequency band. FT is applied to 10 different auditory blocks of the EEG signals (These signals are obtained from the same subject, and during the same task and listening). All the windows with EOG artifacts (amplitudes exceeding 80 mV) were deleted from further analyses. Artifact-free windows were subjected to a fast Fourier transform (FFT) algorithm, which yielded power in mV2/Hz.
2.5. Statistical Analysis
Artifact-free windows were subjected to a fast Fourier transform (FFT) algorithm. We have analyzed statistically significant differences of power of the rhythmic activity registered during the presentation of different types of stimuli compared to background using Matlab and Statistica 6.0.
1) The repeated measures ANOVA-effects of lateralization, topography and group (Statistica 6.0.). For statistical analyses, electrode positions were topographically aggregated as following:
According to topography: frontal (Fp1, Fp2, F3, Fz, F4) and parieto-occipital (P3, Pz, P4, O1, O2).
According to lateralization: Left (Fp1, F3, P3, O1) and right (Fp2, F4, P3, O2). The midline electrodes (Fz, Pz) were not included in the analyses as we were also interested in hemispheric differences.
2) The t-test differences for each types of stimuli compared to the background rhythmic activity were calculated as well.
3) The non-parametric correlation analysis between the Glasgow Coma Scale score and power of the EEG rhythm for different emotional stimuli compared to background (stimuli-background).
3. Results
3.1. Bird Singing
3.1.1. The Repeated Measures ANOVA-Effects: Bird Singing vs Background
2 - 4 Hz: The delta-rhythm power was higher in the frontal area compared to background (F(1, 67) = 8.6740, p = 0.00479).
4 - 6 Hz: The theta-rhythm power was lower in the frontal area compared to background (F(1, 67) = 4.0335, p = 0.04953). The lower theta-rhythm power in the frontal was most pronounced in the right hemisphere (F(3, 67) = 3.7541, p = 0.01614) and was found only in severe TBI and comatose patients (F(3, 67) = 8.0898, p = 0.00016).
6 - 8 Hz: The theta-rhythm power was lower in the frontal areas and higher in the parieto-occipital areas (F(1, 67) = 4.0335, p = 0.04953). The lower theta-rhythm power in the frontal areas was found only in TBI patients (F(3, 67) = 4.2356, p = 0.00917), the theta-rhythm power in the healthy adults was higher both in frontal and occipital areas. These differences were most pronounced in the right hemisphere (F(1, 67) = 13.385, p = 0.00057).
8 - 10 Hz: The alpha-rhythm power was lower in the frontal areas compared to background (F(1, 67) = 4.4577, p = 0.03930) and was lower in the right hemisphere (F(1, 55) = 5.6278, p = 0.02120). The lower alpha-rhythm power in the frontal areas was found only in severe TBI and coma patients and healthy adults, but wasn’t found in moderate TBI patients (F(3, 67) = 3.9023, p = 0.01342).
10 - 12 Hz: The alpha-rhythm power was higher in moderate TBI patients and lower for other groups of subjects (F(3, 67) = 2.9, p = 0.04). The alpha-rhythm power was lower in the frontal area and was higher in the parieto-occipital area compared to background (F(1, 67) = 4.91, p = 0.0309). The lower alpha-rhythm power in the frontal area was found only in comatose and sever TBI patients and healthy adults (F (3, 67) = 5.137, p = 0.00338). All differences in each group were most pronounced in the right hemisphere (F(1, 67) = 3.197, p = 0.0306).
12 - 14 Hz: The beta-rhythm power was lower in the frontal area (F(1, 67) = 7.0435, p = 0.01048) in the occipital area it was on the contrary higher. The lower beta-rhythm was more pronounced in the right frontal area (F(1, 67) = 5.55, p = 0.02219).
14 - 16 Hz: The beta-rhythm power was lower in the right hemisphere compared to background (F(1, 67) = 34.45, p = 0.00000). The lower beta-rhythm was more pronounced in the frontal area (F(1, 67) = 13.894, p = 0.00046). The lower beta-rhythm in the right frontal area was found only in TBI patients (F(3, 67) = 8.8667, p = 0.00007).
16 - 18 Hz: The beta-rhythm was higher in case of comatose patients (F(3, 67) = 4.69, p = 0.0055). The higher beta-rhythm was more pronounced in the parieto-occipital area (F(1, 67) = 4.62, p = 0.006). The beta-rhythm power was lower in the right hemisphere and higher in the left (F(1, 67) = 12.76, p = 0.00075). The higher beta-rhythm power in the left hemisphere was found only in moderate and severe TBI patients, in coma patients it was higher in both hemispheres, and in control group it was lower in both hemisphere (F(3, 67) = 3.075, p = 0.035).
18 - 20 Hz: The beta-rhythm was higher in coma and severe TBI patients (F(3, 67) == 5.17, p = 0.0032). The higher beta-rhythm power was more pronounced in the occipital area (F(3, 67) = 3.77, p = 0.0155). The beta-rhythm power higher in the left hemisphere of the occipital area (F(1, 67) = 7.29, p = 0.0092). The higher beta-rhythm in the left occipital area was found only in severe TBI and coma patients and lower in the right frontal area in each group except for comatose patients (F(3, 67) = 4.65, p = 0.0059).
3.1.2. Correlations SCG and Rhythm Power
Delta-rhythm: significant correlations (t > 2.8, p < 0.01) were found for Fp1, Fp2, F7, F8, C3, C4, T3, T4, T7, T8, P4, O1, O2 electrodes: the higher was SCG level, the lower delta-rhythm power was.
Theta1-rhythm: significant correlations (t > 2.9, p < 0.01) were found for Fp1, F7, C3, C4, T3, T7, P4, O1, O2 electrodes: the higher was SCG level, the lower theta-rhythm power was.
Theta2-rhythm: significant correlations (t > 2.5, p < 0.01) were found for Fp1, F7, C3, C4, T3, T4, T7, P4, O1, O2 electrodes: the higher was SCG level, the lower delta-rhythm power was.
Alpha1-rhythm: significant correlations (t > 3.1, p < 0.01) were found for Fp2, F8, C3, C4, T3, T4, T7, T8, P4, O1, O2 electrodes: the higher the SCG level was, the lower delta-rhythm power was.
Alpha2-rhythm: significant correlations (t > 2.7, p < 0.01) were found for C3, C4, T3, T4, T7, T8, P3, P4, O1, O2 electrodes: the higher SCG level was, the lower delta-rhythm power was.
Beta1-rhythm: significant correlations (t > 3.3, p < 0.01) were found for Fp1, Fp2, F7, F8, C3, C4, T3, T4, T7, T8, P3, P4, O1, O2 electrodes: the higher the SCG level was, the lower beta -rhythm power was.
Beta2-rhythm: significant correlations (t > 2.7, p < 0.01) were found for C3, C4, T3, T4, T7, T8, P3, P4, O1, O2 electrodes: the higher SCG level was, the lower beta-rhythm power was.
3.2. Barking
3.2.1. The Repeated Measures ANOVA-Effects: Barking vs Background
2 - 4 Hz: The delta-rhythm power was higher during sounds of barking compared to background (F(1, 67) = 14.552, p = 0.00040). The acceleration of delta-rhythm was higher in the parieto-accipital area (F(1, 67) =
8.3283, p = 0.00593). The highest delta-rhythm acceleration in parieto-accipital areas was found in severe TBI and comatose patients (F(3, 67) = 8.0746, p = 0.00020).
4 - 6 Hz: There theta-rhythm power was lower in the frontal area compared to background (F(1, 67) = 9.9327, p = 0.00274). The lower theta-rhythm power was found only in TBI patients, especially in comatose patients (F(3, 67) = 9.5584, p = 0.00004) and was most pronounced in the right hemisphere (F(3, 67) = 4.2651, p = 0.00929).
6 - 8 Hz: The theta-rhythm power was lower compared to background (F(1, 67) = 4.9151, p = 0.03102). The lower theta-rhythm power was most pronounced in the frontal area (F(1, 67) = 7.5295, p = 0.00831) and was found only in severe TBI and comatose patients (F(3, 67) = 5.8261, p = 0.00165). The differences were most pronounced in the right hemisphere (F(3, 67) = 9.9167, p = 0.00271).
8 - 10 Hz: The alpha-rhythm power was lower compared to background (F(1, 67) = 4.8466, p = 0.03216). The lower alpha-rhythm power was found in the frontal areas (F(1, 67) = 8.9364, p = 0.00426). The lower power in the frontal areas was not found in patients with moderate TBI (F(3, 67) = 5.3587, p = 0.00272): it was higher compared to background. The differences were most pronounced in the right hemisphere (F(1, 67) = 7.5951, p = 0.00805).
10 - 12 Hz: The alpha-rhythm power was higher in case of moderate TBI patients and was lower for the other groups of subjects (F(3, 67) = 2.285, p = 0.0089). The lower alpha-rhythm power was found in the frontal area (F(3, 67) = 3.46, p = 0.0228). The alpha-rhythm power in the frontal area was lowest in the right hemisphere (F(1, 67) = 5.1516, p = 0.0274).
12 - 14 Hz: in the frontal area beta-rhythm power was lower, in occipital area it was on the contrary higher (F(1, 67) = 7.3070, p = 0.00931). The lower beta-rhythm power was more pronounced in the right frontal area (F(1, 67) = 5.9, p = 0.01875).
14 - 16 Hz: The beta-rhythm in the left hemisphere was higher than background, in the right hemisphere it was lower (F(1, 67) = 25.645, p = 0.00001). The higher beta-rhythm in the left hemisphere was found only in patients with TBI (F(3, 67) = 2.8082, p = 0.04874): the lower beta-rhythm in the right hemisphere was found in the right frontal area (F(1, 67) = 13.854, p = 0.00049) and was found only in patients with TBI (F(3, 67) = 8.9718, p = 0.00007).
16 - 18 Hz: The beta-rhythm power was higher compared to background only in coma and severe TBI patients (F(3, 67) = 5.613, p = 0.0021). The beta-rhythm power was lower in the right hemisphere and higher in the left (F(1, 67) = 12.182, p = 0.001). The differences were most pronounced in the frontal area (F(1, 67) = 4.451, p = 0.0398) in severe TBI and coma patients (F(3, 67) = 5.46, p = 0.00248).
18 - 20 Hz: The beta-rhythm power was higher compared to background only in coma and severe TBI patients (F(3, 67) = 6.4, p = 0.0009). It was lower in the right hemisphere of frontal area and higher in the left hemisphere of frontal area (F(1, 67) = 15.24, p = 0.00027). The effect of higher beta-rhythm in the left frontal area was found only in severe TBI and coma (F(3, 67) = 8.67, p = 0.00009) (Figure 1).
3.2.2. Correlations SCG and Rhythm Power
Delta-rhythm: significant correlations (t > 2.8, p < 0.01) were found for Fp1, F7, F8, C3, C4, T3, T4, T7, P4, O1, O2 electrodes: the higher the SCG level was, the lower delta-rhythm power was.
Theta1-rhythm: significant correlations (t > 2.9, p < 0.01) were found for Fp1, F7, C3, C4, T3, T7, P4, O1, O2 electrodes: the higher SCG level was, the lower theta-rhythm power was.
Alpha2-rhythm: significant correlations (t > 2.7, p < 0.01) were found for C3, C4, T3, T4, T7, T8, P3, P4, O1, O2 electrodes: the higher SCG level was, the lower the alpha-rhythm power was.
Beta1-rhythm: significant correlations (t > 3.3, p < 0.01) were found for Fp1, Fp2, F7, F8, C3, C4, T3, T4, T7, T8, P3, P4, O1, O2 electrodes: the higher SCG level was, the lower beta-rhythm power was.
Beta2-rhythm: significant correlations (t > 3.3, p < 0.01) were found for Fp1, Fp2, F4, F7, F8, C3, C4, T3, T4, T7, T8, P3, P4, O1, O2 electrodes: the higher was SCG level, the less was beta-rhythm power (Figure 3).
3.3. Crying
3.3.1. The Repeated Measures ANOVA-Effects: Crying vs Background
2 - 4 Hz: The delta-rhythm power was higher in the right hemisphere compared to the background (F(1, 67) = 9.9327, p = 0.00274) and was most pronounced in the frontal area (F(1, 67) = 13.679, p = 0.00051 < 0.0125).
4 - 6 Hz: The theta-rhythm power was higher in the right hemisphere compared to the background (F(1, 67) = 9.9327, p = 0.00274, <0.025). The higher theta-rhythm power was most pronounced in the right frontal area (F(1, 67) = 13.679, p = 0.00051 <0.0125).
6 - 8 Hz: The theta-rhythm power was lower compared to background in the frontal area (F(1, 67) = 8.3405, p = 0.00550) and found only in TBI patients (F(3, 67) = 5.2893, p = 0.00278). The differences were most pronounced in the right hemisphere (F(3, 67) = 7.5491, p = 0.00806).
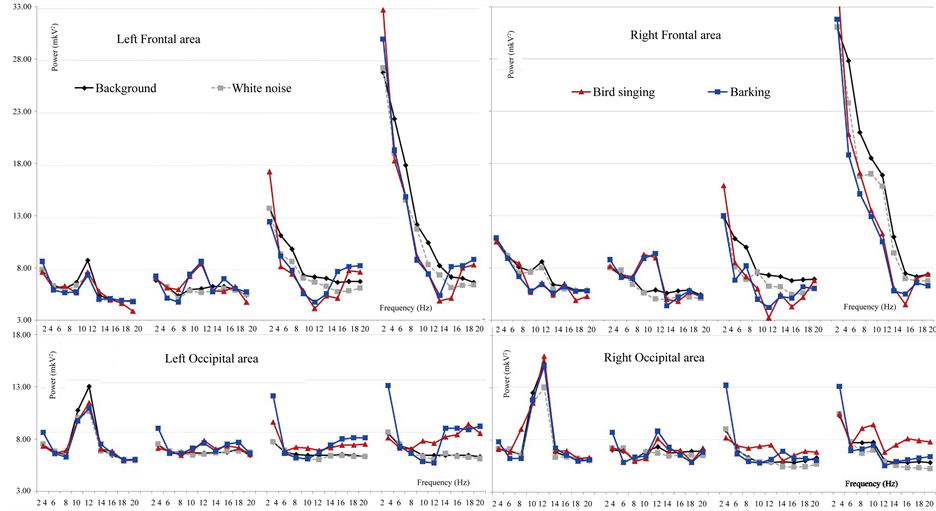
Figure 1. The rhythmic power average means for the bird singing and barking compared to the white noise and the background analyzed with ANOVA in four brain regions: left frontal and parieto-occipital areas, right frontal and parieto-occipital areas.
8 - 10 Hz: The alpha-rhythm power was lower compared to background (F(1, 67) = 4.7258, p = 0.03396). The lower alpha-rhythm power was more pronounced in the frontal areas (F(1, 67) = 10.935, p = 0.00165). The lower alpha-rhythm power in the frontal areas was found only in severe TBI and coma patients and healthy adults, but not in moderate TBI patients (F(3, 67) = 6.2427, p = 0.00099). The lower alpha-rhythm compared to background was also most pronounced in the right hemisphere (F(1, 67) = 6.7116, p = 0.01219).
10 - 12 Hz: The alpha-rhythm power was higher compared to background in moderate TBI patients and was lower in other groups of subjects (stimuli * group F (3, 67) = 2.276, p = 0.09).
The lower alpha-rhythm power was compared to background was lower in the frontal area (F(1,67) = 4.041, p = 0.049) and higher in the parieto-occipital area.
12 - 14 Hz: The beta-rhythm power was lower in the frontal area and higher in the occipital area compared to background (F(1, 67) = 6.578, p = 0.01308).
14 - 16 Hz: The beta-rhythm power was lower compared to background in the frontal areas (F(1, 67) = 4.5923, p = 0.03656), and was higher in the occipital area. The lower beta-rhythm in the frontal area was found only in severe TBI and coma patients (F(3, 67) = 5.384, p = 0.00254). The beta-rhythm power was lower in the right hemisphere compared to background (F(1, 67) = 15.062 p = 0.00028). The beta-rhythm was lower in the right frontal area (F(1, 67) = 8.069 p = 0.0063) and was found only in severe TBI and coma patients (F(3, 67) = 6.1614 p = 0.00109).
16 - 18 Hz: The beta-rhythm power was higher compared to background (F(1, 67) = 7.42, p = 0.0086) and was higher only in coma and severe TBI patients (F(3, 67) = 13.079, p = 0.00000). The higher beta-rhythm was more pronounced in occipital area (F(3, 67) = 4.33, p = 0.00826). The beta-rhythm power was higher in the left hemisphere compared to background (F(1, 67) = 6.791, p = 0.012). The higher beta-rhythm in the left hemisphere was found in control group, severe and moderate TBI patients (F(1, 67) = 2.8, p = 0.048). The higher betarhythm was most pronounced in the left frontal area (F(1, 55) = 4.9, p = 0.0044).
18 - 20 Hz: The beta-rhythm was higher only in coma and severe TBI patients compared to background (F(3, 67) = 7.74, p = 0.00021). The higher beta-rhythm in these groups of patients was more pronounced in the occipital area (F(3, 67) = 3.43, p = 0.023). The beta-rhythm power was higher in the left frontal area and lower in the right compared to background (F(1, 67) = 7.71, p = 0.00745). This effect was found in severe TBI and coma (F(3, 67) = 5.23, p = 0.0029).
3.3.2. Correlations SCG and Rhythm Power
Delta-rhythm: significant correlations (t > 2.8, p < 0.01) were found for Fp1, Fp2, F7, F8, C3, C4, T3, T4, T7, T8, P3, P4, O1, O2 electrodes: the higher SCG level was, the lower delta-rhythm power was.
Theta1-rhythm: significant correlations (t > 2.9, p < 0.01) were found for Fp1, Fp2, F3, F7, F8, C3, C4, T3, T4, T7, T8, P3, P4, O1, O2 electrodes: the higher SCG level was, the lower theta-rhythm power was.
Theta2-rhythm: significant correlations (t > 2.5, p < 0.01) were found for T3, T7, P3, P4, O1, O2 electrodes: the higher SCG level was, the lower theta-rhythm power was.
Alpha1-rhythm: significant correlations (t > 3.1, p < 0.01) were found for T3, T7, O1 electrodes: the higher SCG level was, the lower alpha-rhythm power was.
Alpha2-rhythm: significant correlations (t > 2.7, p < 0.01) were found for C3, C4, T3, T4, T7, T8, P3, P4, O1, O2 electrodes: the higher SCG level was, the less alpha-rhythm power was.
Beta1-rhythm: significant correlations (t > 3.3, p < 0.01) were found for Fp1, Fp2, F7, F8, C3, C4, T3, T4, T7, P3, P4, O2 electrodes: the higher SCG level was, the lower beta -rhythm power was.
Beta2-rhythm: significant correlations (t > 2.7, p < 0.01) were found for Fp1, Fp2, F7, F8, C3, C4, T3, T4, T7, T8, P3, P4, O1, O2 electrodes: the higher SCG level was, the lower beta-rhythm power was.
3.4. Coughing
3.4.1 The Repeated Measures ANOVA-Effects: Сoughing vs Background
2 - 4 Hz: The delta-rhythm power was higher compared to background (F(1, 67) = 5.5242, p = 0.02244), it was higher in parieto-occipital areas (F(1, 67) = 24.203, p = 0.00001). The effect was most pronounced in severe TBI and coma patients (F(3, 67) = 6.6189, p = 0.00069).
4 - 6 Hz: The theta-rhythm power was lower in the frontal area compared to background (F(1, 67) = 9.1923, p = 0.00391). The lower theta-rhythm power was found only in severe TBI and coma patients (F(3, 67) = 8.9834, p = 0.00008). This differences were most pronounced in the right hemisphere (F(3, 67) = 4.0614, p = 0.01190).
6 - 8 Hz: The theta-rhythm power was lower compared to background (main effect of stimuli, F(1, 67) = 7.6030, p = 0.00811). The lower theta-rhythm power was most pronounced in the frontal areas (F(1, 67) = 12.746, p = 0.00080). This lower theta-rhythm power in the frontal areas was found only in severe TBI patients (F(3, 67) = 8.0899, p = 0.00017). This lower theta-rhythm power in the frontal areas were most pronounced in the right hemisphere (F(1, 67) = 12.383, p = 0.00093).
8 - 10 Hz: The alpha-rhythm power was lower compared to background (F(1, 67) = 6.7522, p = 0.01227). The lower alpha-rhythm power compared to background was found in the frontal areas (F(1, 67) = 12.441, p = 0.00091) in severe TBI and comatose patients and healthy adults (F(3, 67) = 7.2322, p = 0.00040). The lower alpha-rhythm power in the frontal areas was more pronounced in the right hemisphere (F(1, 67) = 5.3971, p = 0.02428).
10 - 12 Hz: The alpha-rhythm power was lower compared to background (F (1, 67) = 6.423 p = 0.0144), this effect was found only in coma and severe TBI patients and healthy adults (F (3, 67) = 3.38 p = 0.025) and was lower in the frontal (F(3, 67) = 9.308, p = 0.00005). In parieto-occipital area the alpha-rhythm power was lower only in healthy adults.
12 - 14 Hz: The beta-rhythm power was lower in the right hemisphere and higher in the left hemisphere compared to background (F(1, 67) = 5.18, p = 0.027).
14 - 16 Hz: The beta-rhythm power was lower in the right hemisphere and higher in the left compared to background (F(1, 67) = 47.889, p = 0.00000): The higher beta-rhythm of the left hemisphere and the lower rhythm of the right hemisphere were found only in severe TBI and coma (F(3, 67) = 14.791, p = 0.00000). In the frontal area the beta-rhythm power was higher compared to background (F(1, 67) = 4.48, p = 0.0392).
16 - 18 Hz: The beta-rhythm power was lower compared to background (F(1, 67) = 9.71, p = 0.003). The beta-rhythm power was lower in the right hemisphere and higher in the left (F(1, 67) = 35.185, p = 0.00000), the differences were more pronounced in the frontal area (F(1, 67) = 7.42, p = 0.0086) and was found only in TBI patients (F(3, 67) = 8.81, p = 0. 00009).
18 - 20 Hz: the beta-rhythm power was lower compared to background (F(1, 67) = 12.103, p = 0.001). The lower beta-rhythm was more pronounced in the frontal area (F(3, 67) = 4.29, p = 0.043). The lower beta-rhythm in the frontal area was found in coma and severe TBI patients (F(1, 67) = 4.58, p = 0.0065). The lower betarhythm compared to background was more pronounced in the right hemisphere (F(1, 67) = 14.52, p = 0.00038) and was most pronounced in the right frontal area (F(1, 67) = 11.03, p = 0.00168). The lower beta-rhythm in the right frontal area was found in severe TBI and coma patients (F(3, 67) = 6.8, p = 0.00062).
3.4.2. Correlations SCG and Rhythm Power
Delta-rhythm: significant correlations (t > 2.8, p < 0.01) were found for Fp1, Fp2, F8, T3, T7, O1, O2 electrodes: the higher SCG level was, the lower delta-rhythm power was.
Significant correlations (t < −2.8, p < 0.01) were found for C3, C4, P3, P4 electrodes: the higher SCG level was, the higher delta-rhythm power was.
Theta1-rhythm: significant correlations (t > 3.1, p < 0.01) were found for Fp1, Fp2, F7, F8, C3, C4, T3, T4, T7, T8, P3, P4, O1, O2 electrodes: the higher SCG level was, the less delta-rhythm power was.
Theta2-rhythm: significant correlations (t < −2.9, p < 0.01) were found for Fp1, Fp2, F3, F4, F7, F8, C3, C4, T3, T4, T8, P3, P4, O2 electrodes: the higher SCG level was, the higher theta-rhythm power was.
Alpha1-rhythm: significant correlations (t < −2.9, p < 0.01) were found for Fp1, Fp2, F3, F4, F7, F8, T3, C4, T4 electrodes: the higher SCG level was, the higher alpha-rhythm power was.
Alpha2-rhythm: significant correlations (t > 2.7, p < 0.01) were found for Fp1, F7, C3, C4, T3, T4, T7, T8, P3, P4, O1, O2 electrodes: the higher SCG level was, the lower alpha-rhythm power was.
Beta1-rhythm: significant correlations (t > −2.6, p < 0.01) were found for Fp1, Fp2, F3, F4, F7, F8, T3 electrodes: the higher SCG level was, the higher beta-rhythm power was.
Beta2-rhythm: significant correlations (t > −2.7, p < 0.01) were found for Fp2, F4, F8, T4 electrodes: the higher SCG level was, the higher beta-rhythm power was (Figure 3).
3.5. Scraping
3.5.1. The Repeated Measures ANOVA-Effects: Scraping vs Background
2 - 4 Hz: The delta-rhythm power was higher compared to background (F(1, 67) = 7.5097, p = 0.00835), the differences were most pronounced in the left hemisphere (F(1, 67) = 5.5424, p = 0.02230) and in the parietooccipital area (F(1, 67) = 10.821, p = 0.00179). The deltha-rhythm power was lower compared to background only in the right frontal area (F(1, 67) = 7.8174, p = 0.00719).
4 - 6 Hz: The theta-rhythm power was lower compared to background in the frontal area (F(1, 67) = 7.7366, p = 0.00744), it was lower compared to background only in coma and severe TBI patients (F(3, 67) = 4.2824, p = 0.00893).
6 - 8 Hz: The theta-rhythm power was lower compared to background in the frontal areas and higher in parieto-occipital areas (F(1, 67) = 10.713, p = 0.00186). This effect was found only in severe TBI and coma patients (F(3, 67) = 6.6505, p = 0.00066).
8 - 10 Hz: The alpha-rhythm power was lower compared to background in the frontal areas (F(1, 67)=11,995, p = 0.00104) and was found only in severe TBI and coma patients and healthy adults (F(3, 67) = 7.4920, p = 0.00027). The differences were most pronounced in the right hemisphere (F(1, 67) = 6.7280, p = 0.01214).
10 - 12 Hz: The alpha-rhythm power was higher compared to background only in moderate TBI patients and lower for other groups of subjects (F (3, 67) = 2.698, p = 0.055). The alpha-rhythm power was lower compared to background in the frontal area (F(1, 67) = 10.89, p = 0.0171). The differences in the frontal area was found only in severe TBI patients and healthy adults (F (3, 67) = 5.0077, p = 0.00389).
12 - 14 Hz: The beta-rhythm power was lower than background in the frontal area (F(1, 67) = 7.5468, p = 0.00811).
14 - 16 Hz: The beta-rhythm power was lower compared to background in the frontal area (F(1, 67) = 7.7899, p = 0.00725). The lower beta-rhythm in the frontal area was found only in severe TBI and coma patients (F(3, 67) = 5.2298, p = 0.00305). The beta-rhythm power was lower in the right hemisphere (F(1, 67) = 23.692, p =
0.00001).
16 - 18 Hz: The beta-rhythm power was lower compared to background (F(1, 67) = 7.49, p = 0.00838) it was lower in the frontal area (F(1, 67) = 7.178, p = 0.00976) and in the right hemisphere (F(1, 67) = 7.178, p = 0.00976). The lower beta-rhythm in frontal area was most pronounced in severe TBI and coma patients (F(3, 67) = 5.87, p = 0.0015).
18 - 20 Hz: The beta-rhythm power was lower compared to background in the frontal area (F(1, 67) = 9.1, p = 0.0039). The lower beta-rhythm in the frontal area was found in severe TBI and coma patients (F(3, 67) = 5.86, p = 0.0015) and was lower in the right hemisphere (F(1, 67) = 5.06, p = 0.028).
3.5.2. Correlations SCG and Rhythm Power
Theta1-rhythm: significant correlations (t > 3.1, p < 0.01) were found for Fp1, Fp2, F7, F8, C3, C4, T3, T4, T7, T8, P3, P4, O1, O2 electrodes: the higher SCG level was, the lower delta-rhythm power was.
Theta2-rhythm: significant correlations (t > 2.9, p < 0.01) were found for C3, C4, T3, T7, P3, P4, O1, O2 electrodes: the higher SCG level was, the lower theta-rhythm power was.
Significant correlations (t < −2.9, p < 0.01) were found for Fp2, F4, F8, T4 electrodes: the higher SCG level was, the higher theta-rhythm power was.
Alpha1-rhythm: significant correlations (t > 2.9, p < 0.01) were found for C3, T3, T7,s P3, O1, O2 electrodes: the higher SCG level was, the less alpha-rhythm power was.
Significant correlations (t < −2.9, p < 0.01) were found for Fp2, F4, F8, T4 electrodes: the higher SCG level was, the higher alpha-rhythm power was.
Alpha2-rhythm: significant correlations (t > 2.7, p < 0.01) were found for C3, C4, T3, T7, T8, P3, P4, O2 electrodes: the higher SCG level was the lower alpha-rhythm power was.
Beta1-rhythm: significant correlations (t > 2.6, p < 0.01) were found for T7, P3, O1, O2 electrodes: the higher SCG level was, the lower beta-rhythm power was.
Beta2-rhythm: significant correlations (t > 2.7, p < 0.01) were found for F7, C3, C4, T3, T7, P3, P4, O1, O2 electrodes: the higher SCG level was, the lower beta-rhythm power was.
3.6. Laughing
3.6.1. The Repeated Measures ANOVA-Effects: Laughing vs Background
2 - 4 Hz: The delta-rhythm power was higher in the occipital area and lower in frontal area compared to background (F(1, 67) = 6.3069, p = 0.01511) and was more pronounced in the right hemisphere (F(1, 67) = 9.2099, p = 0.00373).
4 - 6 Hz: The theta-rhythm power was lower in the right hemisphere compared to background (F(1, 67) = 9.9327, p = 0.00274). The theta-rhythm power in the right hemisphere was lower in the frontal area (F(1, 67) = 11.821, p = 0.00115). This effect was found most pronounced in coma patients (F(3, 67) = 10.324, p = 0.00002).
6 - 8 Hz: The theta-rhythm power was lower compared to background in the frontal area and higher in parieto-occipital areas (F(1, 67) = 17.816, p = 0.00009). The lower theta-rhythm power was found only in severe TBI and coma patients (F(3, 67) = 10.757, p = 0.00001). The theta-rhythm power was lower compared to background in the right hemisphere (F(1, 67) = 7.5255, p = 0.00820).
8 - 10 Hz: The alpha-rhythm power was lower compared to background in the frontal areas (F(1, 67) = 18.562, p = 0.00007). The lower alpha-rhythm power in the frontal areas was found only in TBI patients (F(3, 67) = 11.307, p = 0.00001). The alpha-rhythm power was lower in the right hemisphere compared to background (F(1, 67) = 11.468, p = 0.00131).
10 - 12 Hz: The alpha-rhythm power was lower in the frontal areas and higher in parieto-occipital area compared to background (F(1, 67) = 6.19 p = 0.0159). The differences in occipital area were found only in TBI patients (F (3, 67) = 2.7, p = 0.055) and was most pronounced in moderate TBI patients.
12 - 14 Hz: The beta-rhythm power was lower in the frontal areas compared to the background (F(1, 67) = 10.848, p = 0.00175). The lower beta-rhythm power in the frontal areas was found in coma patients and healthy adults (F(1, 67) = 5.12, p = 0.027).
14 - 16 Hz: The beta-rhythm power compared to background was lower in the frontal areas (F(1, 67) = 6.344 p = 0.01477) and was found only in severe TBI and coma patients (F(1, 67) = 7.3276, p = 0.00032). The betarhythm power compared was lower in the right hemisphere and higher in the left (F(1, 67) = 15.856, p = 0.00021).
16 - 18 Hz: The beta-rhythm power was lower compared to background (F(1, 67) = 7.44, p = 0.00858), it was lower in the frontal area (F(1, 67) = 8.215, p = 0.0059) and was found only in severe TBI and coma patients (F(3, 67) = 8.44, p = 0.00011). The beta-rhythm power compared to background was lower in the right hemisphere (F(1, 67) = 16.011, p = 0.00019).
18 - 20 Hz: The beta-rhythm power was lower compared to background (F(1, 67) = 10.2, p = 0.0023), it was lower in the frontal area (F(3, 67) = 9.53, p = 0.0032) and was found only in severe TBI and coma patients (F(1, 67) = 9.84, p = 0.00003). The beta-rhythm power compared to background was lower in the right hemisphere (F(3, 67) = 6.93, p = 0.01) (Figure 2).
3.6.2. Correlations SCG and Rhythm Power
Delta-rhythm: significant correlations (t > 2.8, p < 0.01) were found for F7, T3, T7, T8, P4, O1, O2 electrodes: the higher SCG level was, the lower delta-rhythm power was.
Theta1-rhythm: significant correlations (t > 2.9, p < 0.01) were found for T3, T7, T8, P4, O1, O2 electrodes: the higher SCG level was, the higher theta-rhythm power was.
Theta2-rhythm: significant correlations (t > 2.9, p < 0.01) were found for Fp1, Fp2, F3, F4, F7, F8, T4 electrodes: the higher SCG level was, the higher theta-rhythm power was.
Alpha1-rhythm: significant correlations (t < −2.9, p < 0.01) were found for Fp2, F3, F4, F7, F8 electrodes: the higher SCG level was, the higher alpha-rhythm power was.
Significant correlations (t > 2.8, p < 0.01) were found for T3, T7, T8, P3, O1, O2 electrodes: the higher SCG level was, the lower alpha-rhythm power was.
Alpha2-rhythm: significant correlations (t > 2.7, p < 0.01) were found for C3, C4, T3, T4, T7, T8, P3, P4, O2 electrodes: the higher SCG level was, the lower alpha-rhythm power was.
Beta1-rhythm: significant correlations (t > 2.9, p < 0.01) were found for Fp1, F3, F7, C3, C4, T3, T7, T8, P3, P4, O1, O2 electrodes: the higher SCG level was, the lower beta-rhythm power was.
Beta2-rhythm: significant correlations (t > 2.9, p < 0.01) were found for C3, C4, T3, T7, T8, P3, P4, O1, O2 electrodes: the higher SCG level was, the lower beta-rhythm power was (Figure 3).
3.7. Neutral Stimuli
3.7.1. The Repeated Measures ANOVA-Effects: Neutral Stimuli vs Background
2 - 4 Hz: 4 - 6 Hz: the theta-rhythm power was lower compared to background in the frontal areas (F(1, 67) = 13.951, p = 0.00045). The lower theta-rhythm power in the frontal area was found only in severe TBI and coma patients (F(3, 67) = 8.2962, p = 0.00012).
6 - 8 Hz: The theta-rhythm power was lower compared to background (F(1, 67) = 4.4636, p = 0.03910) and showed most differences in the frontal area (F(1, 67) = 10.119, p = 0.00239) in the right hemisphere (F(1, 67) = 14.228, p = 0.00039) and was found only in severe TBI and coma patients (F(3, 67) = 6.2901, p = 0.00094).
8 - 10 Hz: The alpha-rhythm power was lower compared to background in the frontal areas (F(1, 67) = 10.746, p = 0.00180). The lower alpha-rhythm power in the frontal areas was more pronounced in the right hemisphere (F(1, 67) = 12.789, p = 0.00073).
10 - 12 Hz: The alpha-rhythm power in the frontal area was lower compared to background (F(1, 67) = 7.757, p = 0.00729).
12 - 14 Hz: The beta-rhythm power was lower compared to background in the frontal areas (F(1, 67) = 10.825, p = 0.00175) and was more pronounced in the right frontal area (F(1, 67) = 7.954, p = 0.0066).
14 - 16 Hz: The beta-rhythm power was lower compared to background (F(1, 67) = 10.249, p = 0.00227), it was lower in the frontal areas (F(1, 67) = 6.0568, p = 0.01702) and was found only in severe TBI and coma patients (F(1, 67) = 3.6496, p = 0.01795). The beta-rhythm power was lower in the right hemisphere compared to background (F(1, 67) = 16.772, p = 0.00014) and was found in severe TBI and coma patients (F(3, 67) = 4.823, p = 0.00473).
16 - 18 Hz: The beta-rhythm power was lower compared to background (F(1, 67) = 14.83, p = 0.00031) and was most pronounced in the frontal area (F(1, 67) = 4.44, p = 0.039).
18 - 20 Hz: the beta-rhythm power was lower compared to background (F(1, 67) = 15.763, p = 0.00021) was more pronounced in the frontal area (F(3, 67) = 8.19, p = 0.0059) in the right hemisphere, and was found only in TBI patient (F(3, 67) = 6.54, p = 0.0132).
3.7.2. Correlations SCG and Rhythm Power
Theta1-rhythm: significant correlations (t > 2.9, p < 0.01) were found for T3, T7, O1, O2 electrodes: the higher SCG level was, the lower theta-rhythm power was.
Significant correlations (t < −2.9, p < 0.01) were found for Fp1, Fp2, F3, F4, F8, T4 electrodes: the higher SCG level was, the higher theta-rhythm power was.
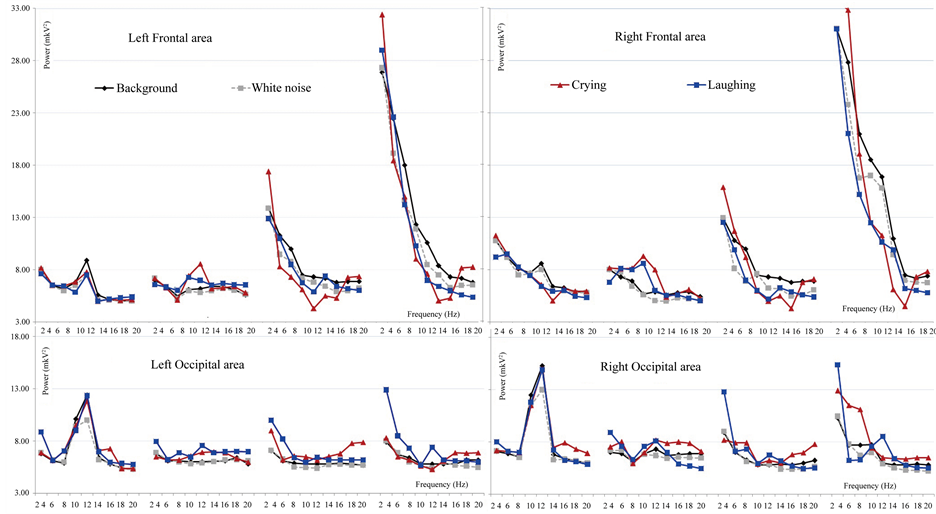
Figure 2. The rhythmic power average means for the crying and laughing compared to the white noise and the background analyzed with ANOVA in four brain regions: left frontal and parieto-occipital areas, right frontal and parieto-occipital areas.
Beta2-rhythm: significant correlations (t > 2.9, p < 0.01) were found for C3, C4, T3, T4, T7, T8, P3, P4, O1, O2 electrodes: the higher the SCG level was, the lower beta-rhythm power was (Figure 3).
3.8. The t-Test Differences (p < 0.05)
The significant t-test differences for each types of stimuli compared to the background rhythmic activity were calculated and presented with a table (see Table 1).
4. Discussion
The results have shown that EEG-response to the emotional stimuli differed depending on consciousness level, the stimuli type, the severity of TBI and the recovery changes. The most valuable changes in EEG spectrum power for the TBI patient were found for negative auditory stimulation (coughing, scraping, crying). We have found that reactivity to the positive stimulation could be registered in later stages of reduction of unconsciousness than to negative stimulation; this responsiveness can reflect the next step of the recovery after TBI. We compared the EEG power changes for different types of positive and negative stimuli. The most important differences were found on delta-rhythm frequency in cases of severe TBI and coma patients. During barking, laughing, scraping and coughing the delta-rhythm power compared to the background was higher in the occipital area, and lower in the frontal area. For the bird singing and crying the delta-rhythm power was higher compared to the background in the frontal areas. These results demonstrated that severe TBI and coma patients can distinguish different types of emotional stimuli but these differences weren’t related to the stimuli of emotional scale. Furthermore, we suggest that severe TBI and coma patients have noticeably differed from healthy subjects in the way of emotional stimuli perception. The patients’ brain response to the neutral stimuli compared to the emotional stimuli showed the lower reactivity was the less the CGS scores they had. It was found that comatose patients responded only to the emotionally significant stimulation.
The correlations between consciousness level (by CGS) and changes in Delta-rhythm power compared to background demonstrate that for the most stimuli (bird singing, barking, crying, laughing) the higher SCG level the less delta-rhythm power was, for the neutral and scraping stimuli the correlations weren’t found, for the coughing the higher SCG score level was, the higher delta-rhythm power in the temporal and occipital areas was, meanwhile in the centro-parietal areas the higher SCG score level was, the lower delta-rhythm power was.
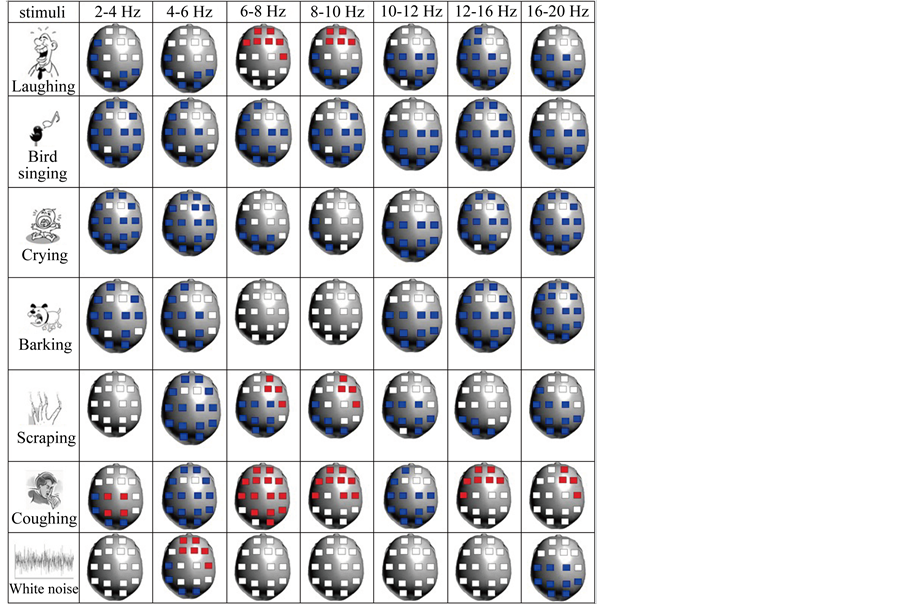
Figure 3. Localization of the significant correlations (t > 2.5/t < −2.5, p < 0.01) between the Glasgow Coma Scale score and power of the EEG rhythm for different emotional stimuli compared to background (stimuli-background). Red: the less SCG scores correspond to the lower rhythm power compared to background. Blue: The less SCG scores correspond to the higher rhythm power compared to background.
These results allow us to suggest higher physiological response in unconsciousness patients.
The electrical activity is cases of coma patients was observed, but characterized by higher delta and theta activity frequency [4] [6] . The deceleration of slow rhythmic activity in response to the coughing in the centro-parietal areas showed to be a sign of sensor-motor activation.
Some data shows the existence of theta ERS in frontal regions of the brain during processing affective auditory stimuli, the patterns do not readily distinguish between specific emotions [20] [21] . The other data received with healthy adults using the positive (contrasted to negative) music was associated with an increase of frontal midline (Fm) theta power [22] . The theta-rhythm power was lower in the frontal areas only in TBI patients, the theta-rhythm power in the frontal areas in healthy adults was higher compared to the background (especially for the positive stimulation). Our data demonstrate that TBI patients (the more TBI severity the more the effect) didn’t distinguish positive and negative emotions, but respond to specific auditory stimulation correlated with their physiological state. The lower theta-rhythm power in TBI patients demonstrates less response to the emotional stimuli compared to the healthy adults. The correlation between lower theta-rhythm power in the frontal areas and lower SCG scores was found for laughing, scraping and coughing on frequencies of 6-8Hz and for the white noise on 4 - 6 Hz frequencies.
Background alpha-activity is reducing in case of TBI patients: the alpha-rhythm depression is most pronounced in control group, less in the moderate TBI patients group, and even less in group with severe TBI. The comatose patients didn’t show any response in rhythmic power in frequency of alpha-rhythm. The higher alpharhythm power was found only in moderate TBI patients for all stimuli type except the neutral. The alpha-rhythm acceleration was most pronounced in the left occipital area in moderate TBI patients and was showed to be related with emotional stimuli responsiveness. Most of EEG measured in TBI patients have shown increased deltarhythm and decreased alpha-rhythm in TBI patients [10] . Some data showed that the alpha EEG training in pa

Table 1. The t-test significant differences (p < 0.05) between the stimuli and the background averaged EEG rhythmic spectrums, in each group of subjects, for each stimuli type and each EEG channel.
Continued
tients with TBI showed return to pre-morbid functioning [23] . The Alpha-rhythm acceleration in the occipital areas was correlated with good forecast in the TBI patients group [11] . It was found also that TBI patients appeared to be less capable of maintaining a state of alpha desynchronization compared to controls. These results can be associated with deficits in cognitive functions and the dynamic control of behavior [24] . Modulation of alpha rhythmic activities depends on the interaction between thalamo-cortical and cortico-cortical networks [25] . The alpha-rhythm acceleration in moderate TBI patients can be a sign of brain network recovery after injury. The beta-rhythm power in the TBI patient groups was lower compared to the background in the right frontal area. In other studies a significant reduction of beta rhythm power in the patients with head injuries also was found compared with the control group [26] . The highest beta-rhythm power in severe TBI patients was found as a response to the sounds of the emotional states (crying and laughing). The acceleration of beta-rhythm power in comatose and severe TBI patients in response to emotional state stimuli demonstrates the induction activation for these groups of stimuli. The correlations between consciousness level (byCGS) and changes in Beta-rhythm power compared to the background showed that for the coughing the higher SCG score level was the less beta-rhythm power in the TPO areas was, for the rest stimuli on the contrary the higher the SCG score level was the more beta-rhythm power was. The specific nature of the correlations for coughing sounds demonstrates the high level of responsiveness in case of severe TBI and coma patients to these groups of stimuli.
The TBI patients are usually characterized by emotional problems such as mood swings, depression and anxiety [27] as well as empathy deficiency most related to emotional empathy [28] . The TBI patients were also impaired in their ability to recognize the emotions of people in pictures or video. These problems appeared to be specific for emotions and empathy and were not associated with more general cognitive deficiency and also appeared to be not dependent on the severity of the head injury, or the time that pasted since the injury [29] . Our data showed some differences in processing the auditory emotional stimuli depending on TBI severity and recovery stages.
5. Conclusions
1) The severe TBI and comatose patient perception showed to have lower response rate to the positive or negative staining of the emotional stimuli and higher response rates to the physiological aspects of stimuli.
2) The most pronounced response in TBI patients was found to be the unpleasant physiological stimulation. The coughing sounds were showed to induce the most significant response in severe TBI and comatose patients.
3) The TBI patients showed lower theta-rhythm power in the frontal areas to all the emotional stimulations.
4) The correlation analysis showed that the lowest theta-rhythm power in the frontal areas was found in TBI patients with the lowest SCG scores.
5) The alpha-rhythm acceleration in the occipital areas was found only in moderate TBI patients and during emotional stimuli perception.
6) The beta-rhythm power acceleration in severe and comatose TBI patients was found during negative emotional and physiological stimuli perception, the pleasant and neutral stimulation induced the decrease of the betarhythm power in these group of patients.
References
- Bekkedal, M.Y.V., Rossi III, J. and Panksepp, J. (2011) Human Brain EEG Indices of Emotions: Delineating Responses to Affective Vocalizations by Measuring Frontal Theta Event-Related Synchronization. Neuroscience & Biobehavioral Reviews, 35, 1959-1970. http://dx.doi.org/10.1016/j.neubiorev.2011.05.001
- Munari, C. and Calbucci, F. (1981) Correlations between Intracranial Pressure and EEG during Coma and Sleep. Electroencephalography and Clinical Neurophysiology, 51, 170-176. http://dx.doi.org/10.1016/0013-4694(81)90006-7
- Jennet, B. (2002) The Definition, Diagnosis, Prognosis and Pathology of This State Are Discussed, Together with the Legal Implications. Journal of Neurology, Neurosurgery & Psychiatry, 73, 355-357.
- Brenner, R.P. (2005) The Interpretation of the EEG in Stupor And Coma. Neurologist, 11, 271-284. http://dx.doi.org/10.1097/01.nrl.0000178756.44055.f6
- Niedermeyer, E. and DaSilva, F.L. (2004) Electroencephalography: Basic Principles, Clinical Applications, and Related Fields. Williams & Wilkins, Baltimore.
- Young, G.B. (2000) The EEG in Coma. Journal of Clinical Neurophysiology, 17, 473-485. http://dx.doi.org/10.1097/00004691-200009000-00006
- Thatcher, R., Cantor, D., McCalaster, R., Geisler, F. and Krause, P. (1999) Comprehensive Predictions of Outcome in Closed Head-Injured Patients: The Development of Prognostic Equations. Annals of New York Academy of Sciences, 620, 82-101. http://dx.doi.org/10.1111/j.1749-6632.1991.tb51576.x
- Amantini, A., Grippo, A., Fossi, S., Cesaretti, C., Piccioli, A., Peris, A., et al. (2005) Prediction of “Awakening” and Outcome in Prolonged Acute Coma from Severe Traumatic Brain Injury: Evidence for Validity of Short Latency SEPs. Clinical Neurophysiology, 116, 229-235. http://dx.doi.org/10.1016/j.clinph.2004.07.008
- Fischer, C., Luaute, J., Nemoz, C., Morlet, D., Kirkorian, G. and Mauguiere, F. (2006) Improved Prediction of Awakening or Nonawakening from Severe Anoxic Coma Using Tree-Based Classification Analysis. Critical Care Medicine, 34, 1520-1524. http://dx.doi.org/10.1097/01.CCM.0000215823.36344.99
- Korn, A., Golan, H., Melamed, I., Pascual-Marqui, R. and Friedman, A. (2005) Focal Cortical Dysfunction and BloodBrain Barrier Disruption in Patients with Post-Concussion Syndrome. Journal of Clinical Neurophysiology, 22, 1-9. http://dx.doi.org/10.1097/01.WNP.0000150973.24324.A7
- Boldyreva, G.N., Zhavoronkova, L.A., Sharova, E.V., Dobronravova, I.S. (2003) Intercentral EEG Relationships as a Reflection of Normal and Pathologic State of the Human Brain. Journal of Higher Nervous Activity, 53, 391-401.
- Grindel, O.M. and Sharova, E.V. (2001) EEG at a Craniocerebral Trauma/in Book. Neurophysiological Researches in Clinic. Antidor, Moscow, 78-86.
- Gnezditsky, V.V. (2004) EEG back-Tasts and Clinical Electroencephalography (Mapping and Localization of Sources of Electric Activity of a Brain). Medical Press, 421-424.
- Nuwer, M.R., Hovda, D.A., Schrader, L.M. and Vespa, P.M. (2005) Routine and Quantitative EEG in Mild Traumatic Brain Injury. Clinical Neurophysiology, 116, 2001-2025. http://dx.doi.org/10.1016/j.clinph.2005.05.008
- Starr, A. and Achor, L.J. (1975) Auditory Brainstem Responses in Neurological Disease. Archives of Neurology, 32, 761-768. http://dx.doi.org/10.1001/archneur.1975.00490530083009
- Sutter, R. and Kaplan, P.W. (2012) Electroencephalographic Patterns in Coma: When Thingns Slow Down. Epileptologie, 29, 201-209.
- Bornhofen, C. and Mcdonald, S. (2008) Treating Deficits in Emotion Perception Following Traumatic Brain Injury. Neuropsychological Rehabilitation. Neuropsychological Rehabilitation, 18, 22-44.
- Cicerone, K.D., Dahlberg, C., Malec, J.F., Langenbahn, D.M., Felicetti, T., Kneipp S., Ellmo, W., Kalmar, K., Giacino, J.T., Harley, J.P., Laatsch, L., Morse, P.A., Catanese and J.J. (2005) Evidence-Based Cognitive Rehabilitation: Updated Review of the Literature from 1998 through 2002. Archives of Physical Medicine and Rehabilitation, 86, 1681-1692. http://dx.doi.org/10.1016/j.apmr.2005.03.024
- Dubikaytis, Yu.V. and Polyakova, V.B. (1988) EEG-Criteria of Forecasting of a Current and Outcome of a Heavy Craniocereberal Trauma: Methodical Recommendations.
- Bekkedal, M.Y., Rossi 3rd, J. and Panksepp, J. (2011) Human Brain EEG Indices of Emotions: Delineating Responses to Affective Vocalizations by Measuring Frontal Theta Event-Related Synchronization. Neuroscience & Biobehavioral Reviews, 35, 1959-1970.
- Plum, F. and Posner, J. (1980) Diagnosis of Stupor and Coma. 3rd Edition, Davis Co., Philadelphia.
- Sammler, D., Grigutsch, M., Fritz, T., Koelsch, S. (2007) Music and Emotion: Electrophysiological Correlates of the Processing of Pleasant and Unpleasant Music. Psychophysiology, 44, 293-304. http://dx.doi.org/10.1111/j.1469-8986.2007.00497.x
- Ayers, M.E. (1987) Electroencephalographic Neurofeedback and Closed Head Injury of 250 Individuals. National Head Injury Foundation, 380-392.
- Roche, R.A., Dockree, P.M., Garavan, H., Foxe, J.J., Robertson, I.H. and O’Mara, S.M. (2004) EEG Alpha Power Changes Reflect Response Inhibition Deficits after Traumatic Brain Injury (TBI) in Humans. Neuroscience Letters, 362, 1-5. http://dx.doi.org/10.1016/j.neulet.2003.11.064
- Lopes da Silva, F.H., Vos, J.E., Mooibroek, H. and Van Rotterdam, A. (1980) Relative Contributions of Intracortical and Thalamo-Cortical Processes in the Generation of Alpha Rhythms, Revealed by Partial Coherence Analysis. Electroencephalography and Clinical Neurophysiology, 50, 449-456. http://dx.doi.org/10.1016/0013-4694(80)90011-5
- Tebano, M.T., Cameroni, M., Gallozzi, G., Loizzo, A., Palazzino, G., Pezzini, G. and Ricci, G.F. (1988) EEG Spectral Analysis after Minor Head Injury in Man. Electroencephalography and Clinical Neurophysiology, 70, 185-189. http://dx.doi.org/10.1016/0013-4694(88)90118-6
- Sander, A.M. (2002) Picking up the Pieces after TBI: A Guide for Family Members. Baylor College of Medicine, Houston.
- Wood, R.L.L. and Williams, C. (2008) Inability to Empathize Following Traumatic Brain Injury. Journal of the International Neuropsychological Society, 14, 289-296. http://dx.doi.org/10.1017/S1355617708080326
- Wood, R.L.L. and Williams, C. (2010) Impairment in the Recognition of Emotion across Different Media Following Traumatic Brain Injury. Claire Williams. Journal of Clinical and Experimental Neuropsychology, 32, 113-122. http://dx.doi.org/10.1080/13803390902806543
NOTES

*Corresponding author.