World Journal of Cardiovascular Diseases
Vol.2 No.3(2012), Article ID:21228,7 pages DOI:10.4236/wjcd.2012.23023
Changes in presentation and outcomes in cardiac surgery patients aged 70 to 79 years versus patients 80 years or older*
![]()
1Department of Cardiothoracic Surgery, Heart Institute at Good Samaritan Hospital, Los Angeles, USA
2Department of Biostatistics, School of Public Health, University of Los Angeles, Los Angeles, USA
Email: #lathoracic@hotmail.com
Received 18 April 2012; revised 14 May 2012; accepted 12 June 2012
Keywords: Cardiac Surgery in Elderly; Differences; Outcomes
ABSTRACT
Background: To establish which variables between cardiac surgery pts aged 70 - 79 years and 80 years or over are individually different for age group status. Methods: Group 1, 70 - 79 years, n = 351 and Group 2, age 80 or over n = 94. Demographics, operative and hospital outcomes were identified and EuroSCORE (ES) scores applied. Logistic regression uniand multivariate analysis was used to detect preand postoperative variables which might be independently different between the Groups. Results: Difference (p < 0.05) was noted in (higher in Group 2) patients with CHF, NYHA class, atrial fibrillation, aortic valve disease, both ES algorithms. Group 2 pts had lower ejection fraction and less coronary artery disease. Group 1 had more pts with diabetes. Operative mortality was low (1.7% total) with no difference between the Groups. Length of stay in the postoperative intensive care unit and total hospitalization was equal but Group 2 pts needed more often prolonged stay. Group 2 pts had more postoperative renal failure (p = 0.002) and were more often not discharged home (p = 0.03). Hospital mortality did not reach statistical significance (Group 1 18/5.2%, Group 2 10/10.7%, p = 0.06). Univariate analysis detected 12 preand postoperative variables which identified Group status. Multivariate analysis using univariate results detected only diabetes (for Group 1 status) and additive ES (for Group 2 status) to be independently different between the Groups. Conclusions: Elderly pts may be operated with low operative and hospital mortality. Only diabetes and additive ES (=comorbidities) were independently different between the Groups.
1. INTRODUCTION
During the last several years ages of patients undergoing cardiac surgery have increased considerably and patients over 80 years are common in most cardiac surgery units.
Risk factors for elderly undergoing cardiac surgery are well documented [1-3] and several reports confirm good early and late results [1,4-6]. As we get older there are age-dependent structural and functional changes which affect the presentation characteristics and outcomes as well as changes in disease patterns [7]. Most reports compare groups of elderly pts to younger groups mostly undergoing one type of surgery (e.g. >70 years vs <70 years, CABG only surgery) but there are few reports available where two groups of elderly pts are compared undergoing mixed cardiac surgery procedures [8-10]. The aim of this study is to report changes in presentation details, risk scores by EuroSCORE (ES) [11,12] and outcomes between pts aged 70 - 79 (Group 1) with pts 80 years or older (Group 2). The results are used to evaluate which variables are independent predictors for Group status of the patients.
2. MATERIAL AND METHODS
1000 consecutive cardiac surgery patients between January 1999 to May 2000 were retrospectively studied and patients aged 70 years or older were identified and dichotomized into Groups by age: Group 1: age 70 - 79 years, Group 2: age 80 years or over.
Hospital records were reviewed for demographic characteristics, admitting diagnoses, findings from preoperative studies and hospital course. Follow-up all-cause mortality was achieved from Social Security Death Main Index [13] up to 10+ years. All patients were retrospectively allocated risk scores by EuroSCORE) using the online calculator [14]. Preoperative risk scoring may be used not only for morbidity/mortality predictions but also for comparison of patient groups. ES was used because of its simplicity and reliability [11,12]. Logistic regression analysis is used to determine which variables are important in determine the Group status of pts.
Life expectancy of patients was achieved from Social Security Period Life Table [15] and Centers of Disease Control and Prevention [16].
The study was approved by hospital ethics committee and consent waived because pts were not contacted and calculations were made from a database without identifiers.
3. STATISTICAL ANALYSIS
Mean values of ES [additive (AES) and logistic (LES)] were calculated and categories were created to divide patients into low- (AES ≤ 6; LES ≤ 25%) and high-risk groups (AES > 6; LES > 25%). Length of stay in the hospital (LOS) and intensive care unit (ICU) (both in days) were used in their continuous form (<11 days versus >10 days for hospital stay; 1 - 2 days versus >2 days for ICU stay). Additional variables were examined in their continuous form and categorized as follows: baseline serum creatinine (>2.2 mg/dL, ≤2.2 mg/dL), left ventricle ejection fraction (≤0.5, >0.5) and New York Heart Association (NYHA) class (I-II, III-IV). ES variables, operative characteristics, surgical outcomes and follow-up measures were summarized by groups of patients defined by age (Group 1: aged 70 - 79 years, n = 351; Group 2: aged 80 or older, n = 94). Variables were compared between groups of patients using simple parametric t-tests or chi-square tests, and a p-value < 0.05 for the difference was regarded as statistically significant. Logistic regression methods were used to estimate odds ratios (ORs) and 95% confidence intervals (95% CIs) comparing patients aged 80 or older to those aged 70 - 79 years. ORs expressed the probability that a given factor was more or less likely to be associated with older patients (≥80 years) than younger patients (70 - 79 years). Univariate models were employed to calculate individual associations between patient groups and a given factor. Multivariate models were used to determine which univariate predictors were significantly associated with patient group status after taking into consideration the effect of other variables. Those variables that were associated with patient group status at p < 0.05 were considered independently different between groups.
All analyses used SAS version 9.2 (SAS Institute Inc., Cary, NC, USA).
4. SURGICAL TECHNIQUE
All pts were operated through standard median sternotomy. Pts operated on-pump the aortic inflow was into the ascending aorta or femoral artery as indicated. Venous drainage was accomplished with vacuum assist through single, double or femoral cannulation as indicated. Operations were performed in moderate hypothermia to 34˚C. Myocardial protection was accomplished with antegrade and retrograde cold whole blood cardioplegia, retrograde given continuously stopping only when it interfered with visualization and only for a maximum of 10 minutes at the time. Before release of cross-clamp 500 ml of warm blood was given retrogradely.
Results. There were 445 patients aged 70 years or more. These patients were dichotomized into two groups by age: Group 1 pts aged 70 to 79 years (n = 351) and Group 2 pts aged 80 years or more (n = 94).
Preoperative patient characteristics are summarized in Table 1. There were statistically significant differences between the groups in the following demographic variables: Group 2 pts were older by definition, mean NYHA class was higher (p = 0.0003), mean EF was lower (p = 0.04), there were less pts with diabetes and more pts with congestive heart failure (p = 0.007). There were more pts with coronary artery disease as the main diagnosis in Group 1 (p = 0.01) and more pts with aortic valve disease in Group 2 (p = 0.02). S-crea was similar but Group 2 pts had significantly more atrial fibrillation (AF), p = 0.004. Risk scores by both ES algorithms were significantly higher in Group 2 pts (p < 0.0001 for additive ES, AES and p < 0.0001 for logistic ES, LES). Comparing single ES variables the only significant difference was in number of pts with other surgery than CABG only which was higher in Group 2 (p = 0.005). There were no statistically significant differences between other variables although Group 2 pts had higher numbers in most variables contributing to the higher total ES scores in Group 2 pts. Details are summarized in Table 2. Additive ES of >6 is regarded marking a high-risk pt. There were 226 (64.4%) of these pts in Group 1 and 90 (95.7%) in Group 2, p < 0.0001. LES > 25% marks a very high-risk pt. There were 52 (14.8%) of these in Group 1 and 36 (38.3%) in Group 2, p < 0.0001 When the age factor from ES calculations was deleted AES was still significantly higher in Group 2 pts (5.7 ± 3.5 vs 4.6 ± 3.3), p = 0.005 but not LES (8.0% ± 10.0% vs 6.3% ± 10.0%) p = 0.14. Leaving age out from ES calculations reduced significantly numbers of highrisk pts (AES > 6): 72 (20.5%) in Group 1 and 32 (34.0%) in Group 2, p = 0.008; and very high-risk pts (LES > 25%): 17 (4.8%) in Group 1 and 9 (9.6%) in Group 2, p = 0.09. Both ES algorithms overestimated operative and hospital/30 day mortality. Leaving the age factor out from ES calculations both algorithms predicted hospital/30 day mortality quite well. Group 1: predicted by AES 4.4 (6% - 8%), observed 5.2% and by LES: 6.5% predicted, 5.2% observed. Group 2: predicted by AES 5.5 (7% - 10%), observed 10.7% and with LES: predicted 8.6%, observed 10.7%. Details of surgery were similar between the groups
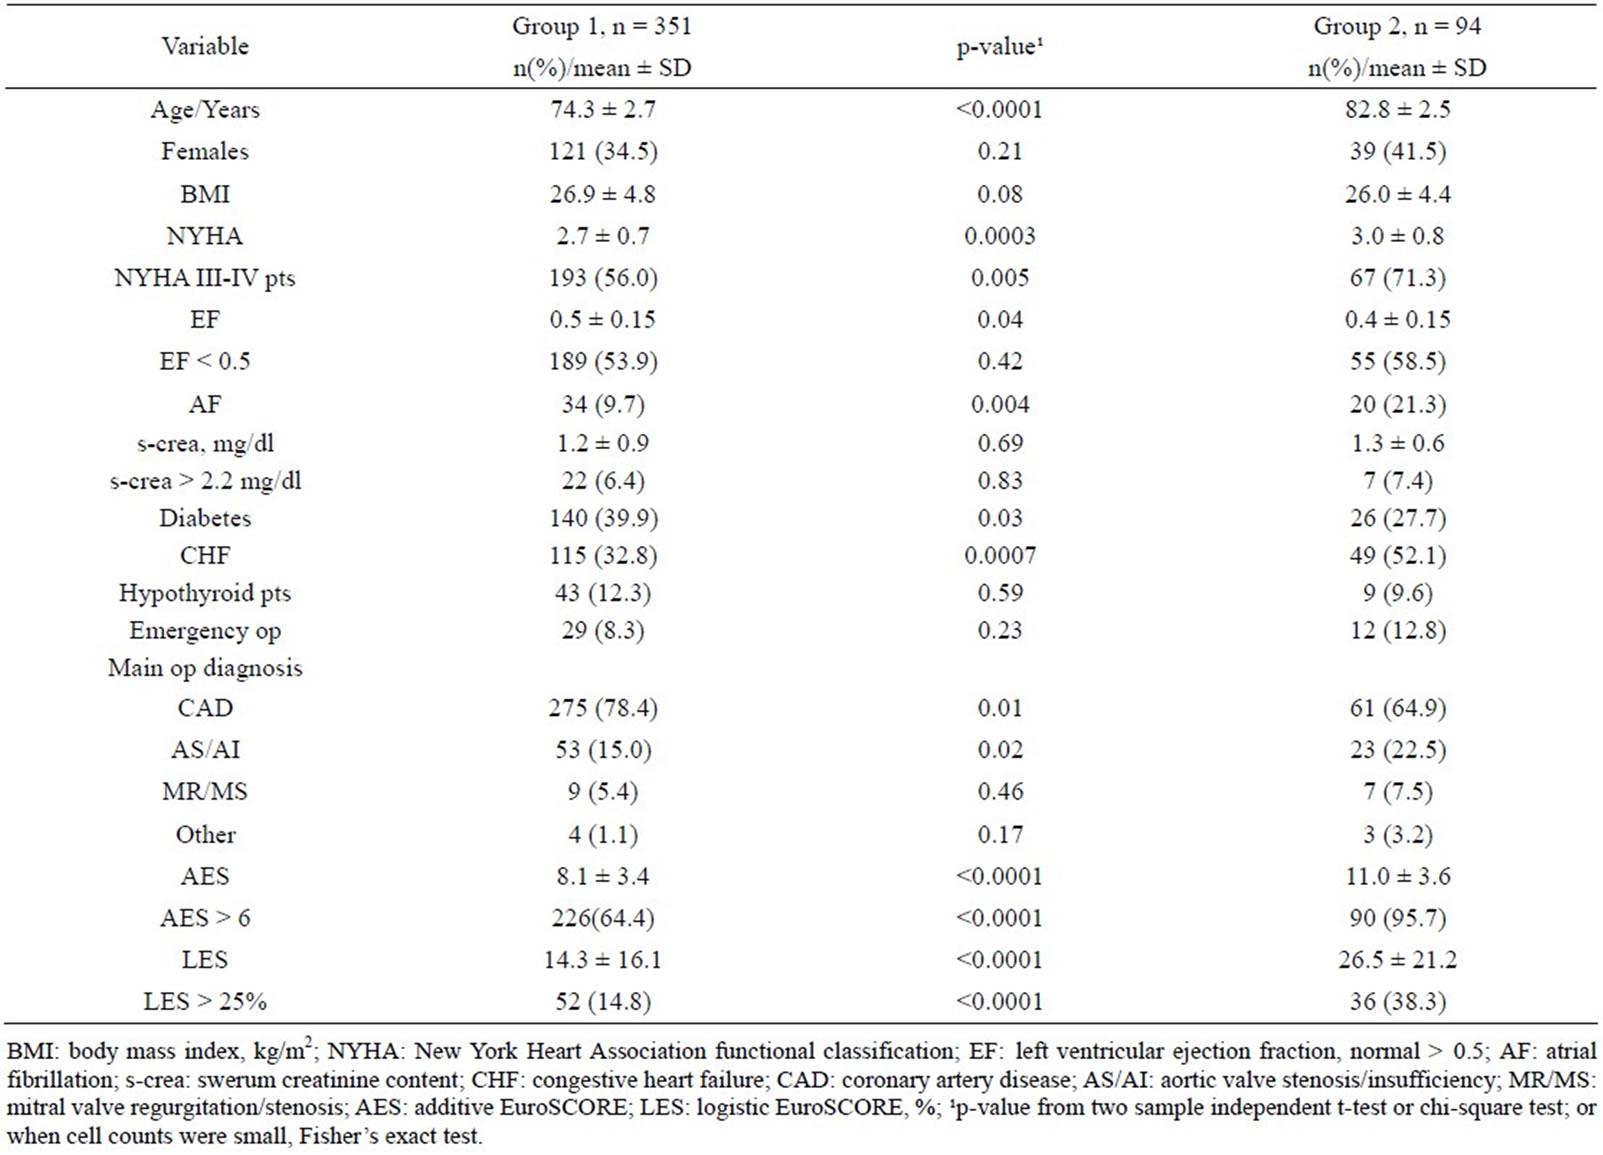
Table 1. Demographics.
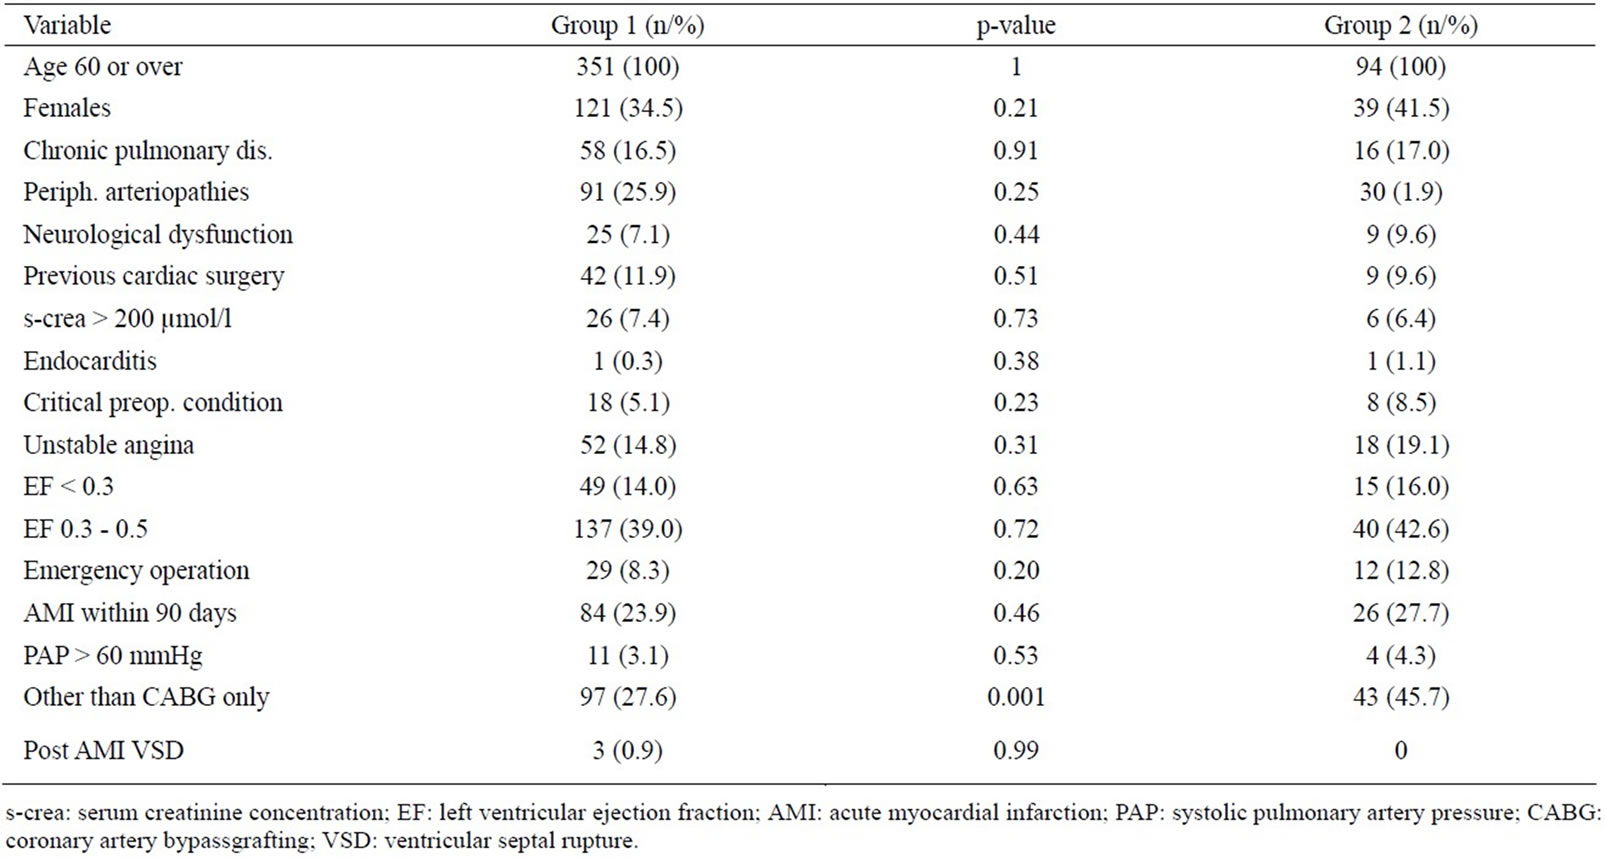
Table 2. EuroSCORE variables.
besides number of CABG only surgery in Group 1, p = 0.005 and more pts with procedures on aortic valve in Group 2, p = 0.03. Details in Table 3. Operative mortality was low (6/1.7% in Group 1 and 1/1.1%, p = 1.00) in both groups, cardiopulmonary bypass times, aortic crossclamp times and need for IABP support postoperatively did not differ between the groups. All operative mortality pts had very high ES scores, mean AES 11.9 ± 53 and all pts had AES > 6, mean LES 34.9% ± 30.7% and 4 pts with LES > 25%. All pts were in NYHA III-IV and 3 pts were operated as emergency. Hospital/30 day mortality was slightly higher in Group 2: 18/5.2% in Group 1 and 10/10.7% in Group 2, p = 0.06. AES for Group 1 hospital deaths was 11.5 ± 4.36 and for Group 2 12.2 ± 4.24, p = 0.68.
LES for Group 1 hospital deaths was 31.6% ± 27.2% and for Group 2 34.1% ± 21.07%, p = 0.82. All pts were high-risk pts (AES > 6 in both Groups). There were 8 (44.4%) of very high-risk pts (LES > 25%) in Group 1 and 6(60.0%) in Group 2, p = 0.69. There were no statistically significant differences in pts in NYHA class III-IV (all pts), number of emergency operations, p = 0.9, pts with diabetes, p = 0.26, pts on dialysis, p = 0.37, preop s-crea, p = 0.38, pts with CHF, p = 0.69, pts with EF < 0.3, p = 0.37 or in the number of pts who needed IABP support, p = 0.08.
Mean ICU for Group 1 was 2.63 ± 5.93 days, range 0 - 60 and median 1 day. For Group 2 it was 3.24 ± 5.01 days, range 0 - 25 and median 1 day, p = 0.36.
There were more patients in Group 2 who had ICU > 2 days (24/25.81% vs 48/13.91%), p = 0.01.
Mean LOS for Group 1 patients was 8.40 ± 6.43 days, range 0 - 60 and median 6. For Group 2 it was 9.51 ± 6.47 days, range 0 - 44 days and median 7, p = 0.11. The need for prolonged hospitalization was similar between the Groups (p = 0.13). Occurrence of postoperative stroke (CVA) was similar between the Groups, p = 0.7. Occurrence of postoperative renal failure (AKI) was higher in Group 2 pts (p = 0.002) despite similar preoperative kidney status by s-crea. There were more postoperative AF in Group 1 calculated from pts with normal sinus rhythm preoperatively but the difference did not reach statistical significance (p = 0.09).
Need for continued hospitalization or rehabilitation was considerably higher in Group 2 pts where 21/24.42% pts were discharged to another institute, p = 0.03. Hospital outcomes are summarized in Table 4. Total follow-up time for Group 1 was 32460 months, mean 99.3 ± 45.8 months, median 114 months and range 1 to 150 months. For Group 2 total follow-up was 5956 months, mean 71.8 ± 46.3 months, median 73 months and range 1 - 140 months. At the closure of follow-up 132 pts (37.6%) in Group 1 were alive and 11 pts (13.3%) in Group 2, p < 0.0001, all with a follow-up time of 10+ years. Details are summarized in Table 5. Ninety two pts (28.1%) exceeded their life expectancy at the closure of follow-up; 66 (18.9%) in Group 1 (mean age 85.1 ± 2.6 years) and 26 (32.1%) in Group 2, p = 0.06 (mean age 93.6 ± 2.1 years). Most variables by univariate analysis determined Group status but multivariate analysis revealed that only diabetes (for Group 1) and additive ES (for Group 2) were independent determinants of Group status. None of the operative and postoperative variables were independent determinants of Group status. OR for ages and follow-up mortality was not calculated. Results are summarized in Table 6. Comments. Cardiac surgery can be performed with low operative and hospital mortality on elderly
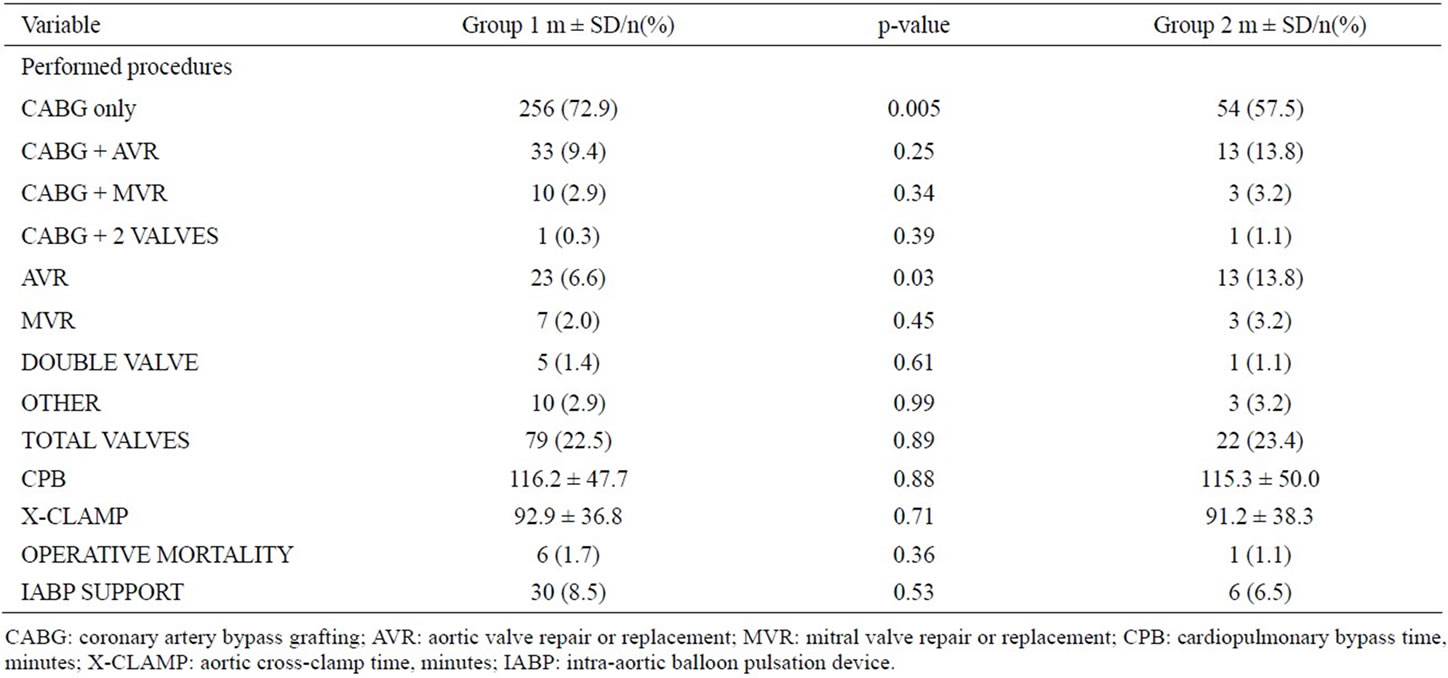
Table 3. Operative details.
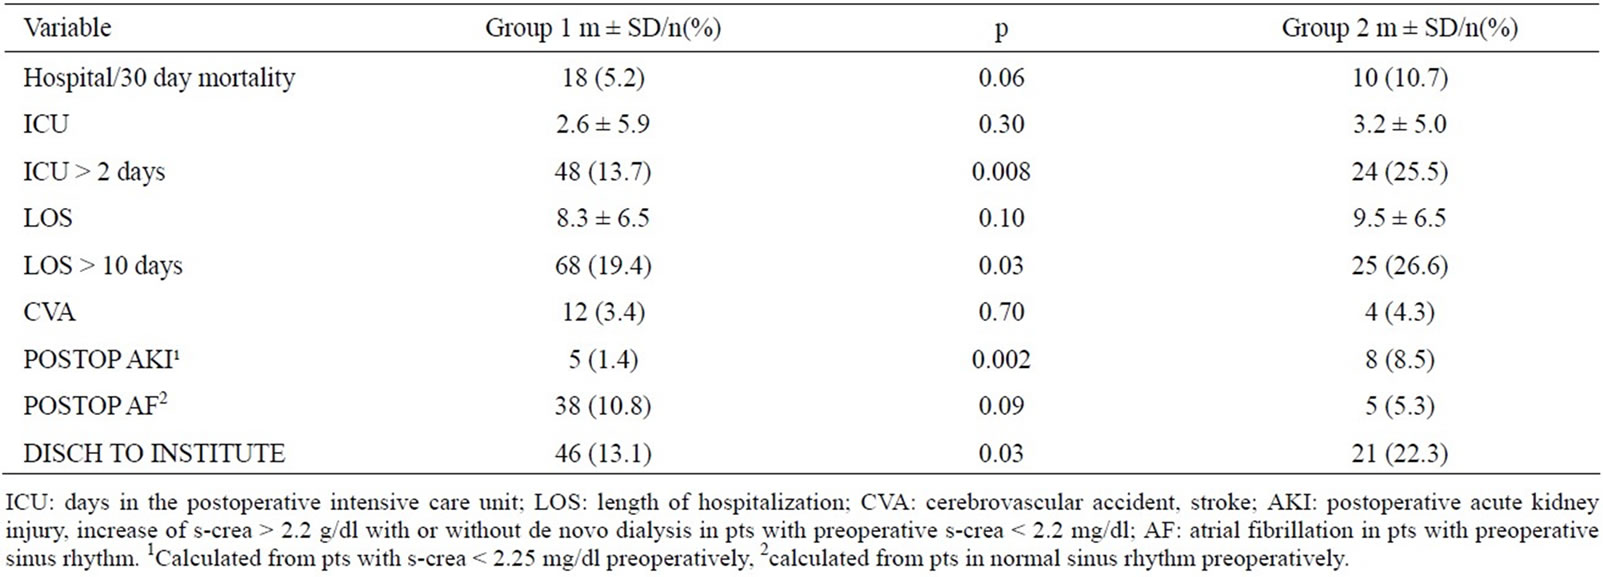
Table 4. Hospital outcomes.

Table 5. Follow-up.
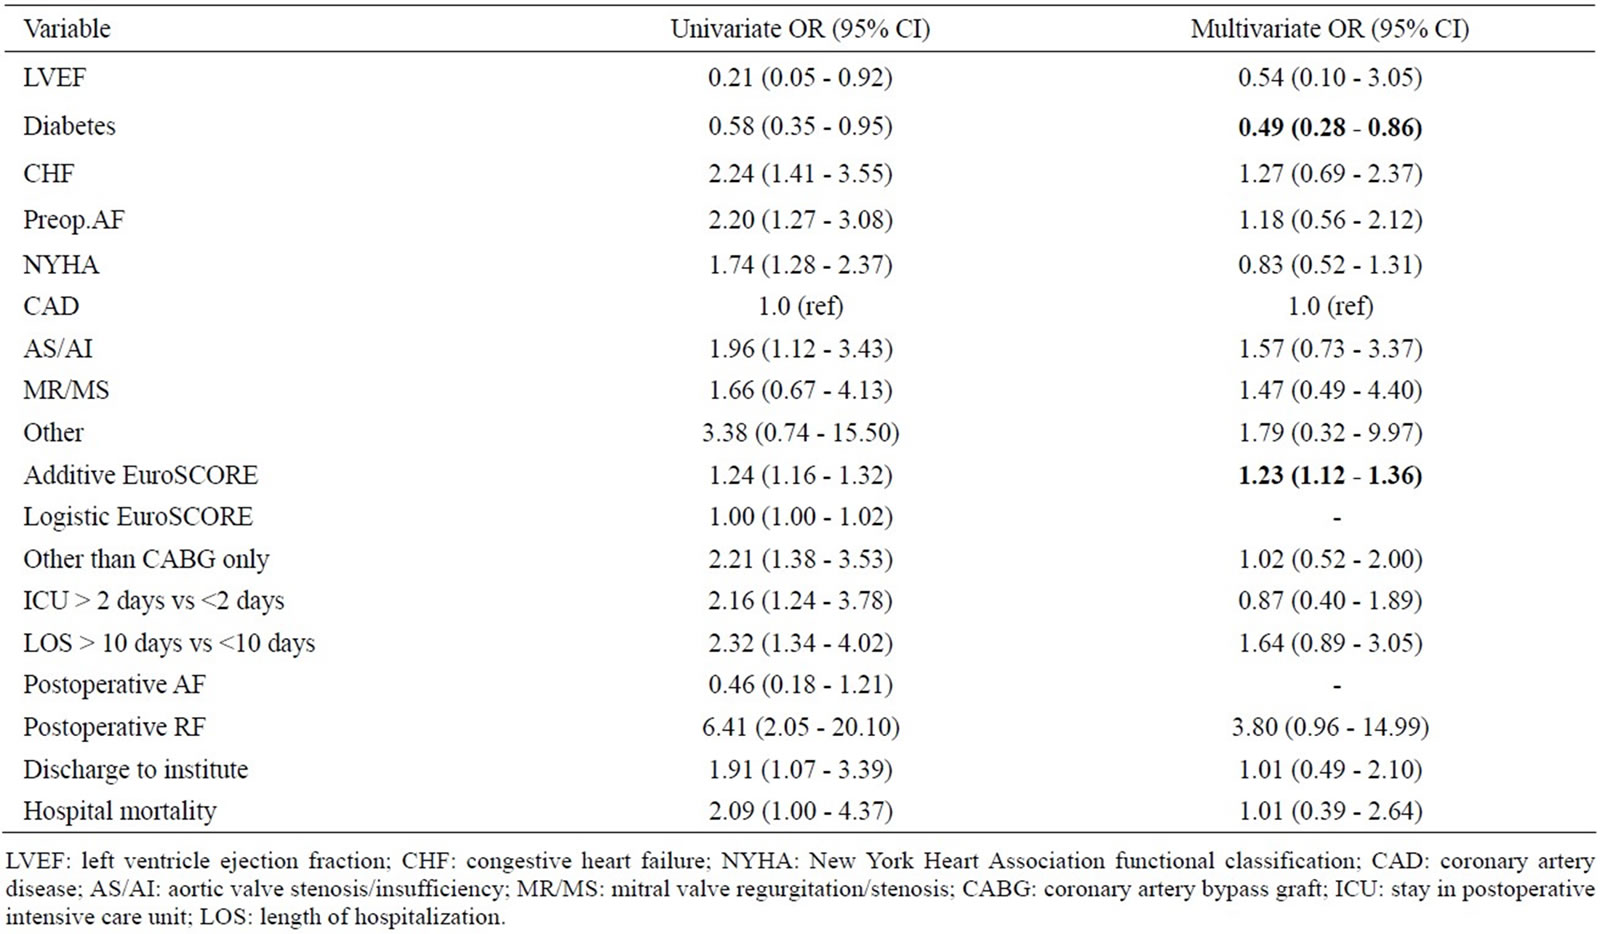
Table 6. Logistic regression analyses comparing variables of Group 2 to Group 1.
patients and acceptable outcomes may be expected [17, 18]. Engoren et al. [8] compared 103 octogerians to 103 septuagerians who underwent mixed cardiac surgery procedures. They observed more preoperative CVA’s in octogerians which was not observed in our series (p = 0.44) and less preoperative renal dysfunction (similar in our series, p = 0.83). The outcomes were quite similar to our series and they concluded that cardiac surgery can be performed in the elderly with good hospital and late functional results but with higher hospital costs. There are several statistically significant differences in patient demographic variables between Group 1 and 2 pts which are quite similar with other reports [19].
We have used ES for comparison of Groups rather than for mortality predictions as ES was designed for. The total ES scores were higher in Group 2 with very significant difference although among individual scores only other surgery than CABG only had a significant difference. Leaving the age factor out from calculations AES was higher in Group 2 pts (p = 0.005) but LES not (p = 0.14) underscoring the great impact of age in ES calculations in elderly pts. In a recent report from Frilling et al. [3] compared three different scores (STS, EuroSCORE and Ambler) for operative mortality in elderly pts. All scores overestimated operative mortality and they concluded that surgical risk scores for risk assessment and treatment decisions should be reevaluated. Leaving the age factor off the calculations may be a way to get more reliable calculations. Operative details were very similar between the Groups except in numbers of CABG and AVR procedures. Operative mortality in both Groups was very low and equal (total 7 of 445, 1.6%) which has not always been observed [20]. Hospital/30 day mortality was slightly higher in octogerians (10.8% vs 5.2%, p = 0.06) [21]. Risk adjusted hospital/30 day mortality was similar with no difference in AES or LES scores which were very high (AES 11.4 ± 4.4 vs 12.6 ± 4.1, p = 0.48 and LES 31.5 ± 28.0 vs 36.3 ± 26.4, p = 0.66). ICU and LOS were similar but Group 2 pts needed longer ICU and LOS with statistically significant difference against Group 1 pts, which is in concert with other relevant reports. There were no differences between postoperative occurrence of CVA’s and AF despite high incidence of preoperative AF in Group 2 pts. The occurrence of renal failure was higher in Group 2 pts (p = 0.002) despite similar renal status by s-crea preoperatively and has been observed earlier [10]. Discharge home rate was lower in Group 2 pts, p = 0.003 which has been demonstrated by Bardacki et al. [22] although in this report 52.4% of octogerians were discharged home but is our series it was 77.7%. Follow-up mortality was higher in Group 2 pts which is related to the age difference and differences in comorbidities but parallels the mortality of general population of same age [19]. Many pts in both Groups exceeded their life expectancy as also demonstrated by Collins et al. [5]. Univariate analysis was used to determine which individual variables were associated to Group status (Group 2 vs 1) and by this to outcomes. There were several variables associated with Group status in demographic variables (n = 7), in operative (n = 1) and hospital outcomes (n = 4). Multivariate analysis of different variables from univariate analysis revealed that only diabetes (for Group 1 status) and AES (for Group 2 status) were independently and significantly associated with Group status Drawbacks. This is a retrospective observational study from a single institution with rather few numbers of pts.
5. CONCLUSION
Pts with advanced age may undergo cardiac surgery with low operative and hospital mortality. Only diabetes (for Group 1) and AES (for Group 2) are independent predictors for Group status. Changes in presentation characteristics and early outcomes do not justify declining needed cardiac surgery by advanced age only. The postoperative and early outcomes did not show any differences by multivariate analysis, so one may expect good early results in pts 80 years or over compared to pts 70 - 79 years old when good clinical judgment with risk assessment is used.
REFERENCES
- Collart, F., Feier, H., Kerbaul, F., et al. (2005) Valvular surgery in octogerians: Operative risk factors, evaluation of uroscore and long term results. European Journal Cardio-Thoracic Surgery, 27, 276-280. doi:10.1016/j.ejcts.2004.10.041
- Deiwick, M., Tandler, R., Mollhoff, T., et al. (1997) Heart surgery in patients aged eighty years and above: Determinants of morbidity and mortality. The Thoracic and Cardiovascular Surgeon, 3, 119-126. doi:10.1055/s-2007-1013702
- Frilling, B., Von Renten-Kruse, W. and Rieb, F.C. (2010) Evaluation of operative risk in elderly patients undergoing aortic valve replacement: The predictive value of operative risk scores. Cardiology, 116, 213-218. doi:10.1159/000319703
- Collins, S.M., Brorsson, B., Svenmarker, S., Kling, P.A. and Aberg, T. (2002) Medium-term survival and quality of life of Swedish octogerians after open heart surgery. European Journal Cardio-Thoracic Surgery, 22, 794-801. doi:10.1016/S1010-7940(02)00330-5
- Fruitman, D.S., MacDougall, C.E. and Ross, D.B. (1999) Cardiac surgery in octogerians: Can elderly patients benefit? Quality of life after cardiac surgery. Annals of Thoracic Surgery, 68, 2129-2135. doi:10.1016/S0003-4975(99)00818-8
- Khan, J.H., Magnetti, S., Davis, E. and Zhand, J. (2000) Late outcomes of open heart surgery in patients 70 years or older. Annals of Thoracic Surgery, 69, 165-170. doi:10.1016/S0003-4975(99)01185-6
- Mortasawi, A., Arnrich, B., Rosendahl, U., et al. (2002) Is age an independent determinant of mortality as suggested by EuroSCORE? BMC Surgery, 2, 8-14. doi:10.1186/1471-2482-2-8
- Engoren, M., Arslanian-Engorren, C., Steckel, D., Nethardt, J. and Fenn-Buderer, N. (2002) Cost, outcome and functional status in octogerians and septuagerians after cardiac surgery. Chest, 122, 1309-1315. doi:10.1378/chest.122.4.1309
- Goyat, S., Henry, M. and Mohajeri, M. (2005) Outcome and quality of life after cardiac surgery in octogerians. ANZ Journal of Surgery, 75, 429-435. doi:10.1111/j.1445-2197.2005.03390.x
- Alexander, K.P., Anstrom, K.J., Muhlbaier, L.H., et al. (2000) Outcomes of cardiac surgery in patients age over 80 years: Results from the national cardiovascular network. Journal of the American College of Cardiology, 35, 731-738. doi:10.1016/S0735-1097(99)00606-3
- Nashef, S.A., Roques, F., Michel, P., Gauducheau, E., Lemeshow, S. and Salamon, R. (1999) European system for cardiac operative risk evaluation (EuroSCORE). European Journal Cardio-Thoracic Surgery, 16, 9-13. doi:10.1016/S1010-7940(99)00134-7
- Roques, F., Michel, P., Goldstone, A.R. and Nashef, S.A. (2003) The logistic EuroSCORE. European Heart Journal, 24, 882-883. doi:10.1016/S0195-668X(02)00799-6
- Social Security Main Death index. http://www.ssdmf.com
- EuroSCORE calculators. http://www.euroscore.org
- Social Security Period Life Table. http://www.ssa.gov/OACT/STATS/table4c6htms
- Centers of Disease Control and Prevention http://www.cdc.gov/nchs/fastats/lifexpec.htm#
- Ghanta, R.K., Shekar, P.S., McGurk, S., Rosborough, D.M. and Aranki, S.F. (2011) Long-term survival and quality of life justify cardiac surgery in the very elderly patient. Annals of Thoracic Surgery, 92, 851-857. doi:10.1016/j.athoracsur.2011.04.083
- Zingone, B., Gatti, G., Rauber, E., et al. (2009) Early and late outcomes of cardiac surgery in octogerians. Annals of Thoracic Surgery, 87, 71-78. doi:10.1016/j.athoracsur.2008.10.011
- Nissinen, J., Wistbacka, J.-O., Loponen, P., et al. (2010) Coronary artery surgery in octogerians: Long-term outcome can be better than expected. Annals of Thoracic Surgery, 89, 1119-1124. doi:10.1016/j.athoracsur.2009.12.063
- Avery II, G.J., Ley, S.J., Hill, J.D., Hershon, J.J. and Dick, S.E. (2001) Cardiac surgery in the octogerian: Evaluation of risk, cost and outcome. Annals of Thoracic Surgery, 71, 591-596. doi:10.1016/S0003-4975(00)02163-9
- Yamane, K., Hirose, H., Youdelman, B.A., Bogar, L.J. and Diehl, J.T. (2011) Conventional aortic valve replacement for elderly patients in the current era. Circulation Journal, 5, 2692-2698. doi:10.1253/circj.CJ-11-0541
- Bardakci, H., Cheema, F.H., Topkara, V.K., et al. (2007) Discharge to home rates are significantly lower for octogerians undergoing coronary artery bypass graft surgery. Annals of Thoracic Surgery, 83, 483-489. doi:10.1016/j.athoracsur.2006.09.047
NOTES
*This work was supported by Elma Larsson Foundation, Los Angeles USA and Los Angeles Thoracic and Cardiovascular Foundation, Los Angeles USA.
#Corresponding author.