Open Journal of Epidemiology
Vol.4 No.2(2014), Article ID:45457,26 pages DOI:10.4236/ojepi.2014.42015
Injury-Related Profiles among School-Aged Children in Cameroon: Analysis Based on the “First Survey—Health Young People”
Christelle Senterre1*, Alain Levêque1, Danielle Piette2, Michèle Dramaix1
1Research Centre of Epidemiology, Biostatistics and Clinical Research, School of Public Health, Université Libre de Bruxelles, Brussels, Belgium
2Research Centre of Social Approaches to Health, School of Public Health, Université Libre de Bruxelles Brussels, Belgium
Email: *Christelle.Senterre@ulb.ac.be
Copyright © 2014 by authors and Scientific Research Publishing Inc.
This work is licensed under the Creative Commons Attribution International License (CC BY).
http://creativecommons.org/licenses/by/4.0/


Received **** 2014
ABSTRACT
Aims: Establish profiles of young “at risk” of injuries, first, on an overall point of view and, secondly, for some types of injuries (sport, home, road traffic, school and work injuries). Methods: We have taken nearly 50 variables into consideration: 17 variables for construction of the socioeconomic status, 9 variables for the investigation of symptoms, 11 concerning drugs, 5 for healthy habits, 3 for investigating the violence behavior, 4 concerning the school, 3 for subjective health and finally 3 for social network. We have used the principal component analysis, the multiple correspondence analysis and the weighted-frequency score for reducing the number of them. After these reductions, 15 variables were available for analyses. The relationship between injuries and investigated factors was assessed using the Pearson’s chi-square test. We also calculated odds ratio (OR) with their 95% confidence intervals (95%CI) to estimate the strengths of the associations. To further assess these relationships but also for taking into account the potentials confounding effects of some variables, logistic regression model and multinomial logistic regression model were applied. Results: The whole injury prevalence was equal to 45.6% and among the injured, the proportion of the several types was equal to 33.8% for sport injuries, 32.2% for home injuries, 16.6% for traffic injuries, 11.6% for school injuries and 5.7% for work injuries. We can say that, in light of the variables studied, the “at risk” profile for having reported an injury is being a boy, being younger, having drug experiences, with the violent profile, and declaring several symptoms. There are no consistent and marked deviations in this study from the findings obtained in previous studies. Conclusion: Analyzing injuries in general is interesting but for preventing them it is important to know in which activities children and students are engaged when they are injured.
Keywords:Injuries, Health Behavior, Youth, Epidemiology, Cameroon

1. Introduction
If in industrial countries, death from all form of unintentional injury has decreased significantly. In Africa, there is a dramatic increase [1] . Injury-related mortality rates in sub-Saharan Africa are among the highest in the world and according to the WHO, Cameroon has an estimated annual mortality rate due to the injury of nearly 102 per 100,000 individuals [2] . Moreover, mortality is sometimes described—as Howe, Huttly and Abramsky [3] said, as “the “tip of the iceberg”, because for every child who dies many more will suffer non-fatal injuries” and “a proportion of these will be left with varying degrees of disability”. So, next to this high mortality fairly well documented, there is also a significant morbidity for which there is a lack of information [1] [3] -[6] . Furthermore, information regarding the epidemiology of injury in Africa is sparse and availability of data on children and young people are extremely limited [2] [3] [6] [7] . Moreover, the majority of these studies were usually based on hospital data; such data may provide information on the type and severity of injuries, but they contain little information on associated factors [1] [2] [4] [6] [8] -[11] . As said by Williams [12] , medical records are designed for recording the type and severity of injuries and generally not to give detailed descriptions about the circumstances or other relevant information about the child. Data based on population surveys, which can provide more information on associated factors, are rare—especially for young people—but are very important because they can provide patterns of injury and demonstrate the existence of variations in health profiles from childhood, through early adolescence, to young adulthood. At the best of our knowledge, a small number of studies have investigated the problem based on population data. Peltzer [13] and colleagues have studied injury and social determinants among in-school adolescents in six African countries (Kenya, Namibia, Swaziland, Uganda, Zambia and Zimbabwe); Muula [7] and colleagues have studied socio-demographic correlates for serious injury among adolescents participating in the Djibouti Global School-based Health Survey; whereas Flisher [14] and colleagues have investigated injury-related behavior among South African high-school students. Finally, these data can help to identify the injuries that were not medically treated because it is known that even “small accidents” carry information towards a better prevention [15] -[17] . Based on the fact that Peltzer [13] and colleagues have found a large range in terms of variations of the injury’s prevalence (from 38.6% in Swaziland to 71.5% in Zambia), we are in accordance with Muula [7] and colleagues which reported that each country needs to document the epidemiology of its injuries. Next to this, Pickett [18] and colleagues have shown, based on the analyses of the data from some countries participating to the Health Behavior in School-aged Children Study, that there was a link between injuries and (multiple) risk behavior.
In order to contribute to the literature on children and adolescents health behaviors, we carry out this study using existing data from the “First Survey—Health Young People” which was performed at the end of 2008 in Cameroon. Our aims were to establish profiles of young “at risk” of injuries, first, on an overall point of view and, secondly, for some types of injuries (e.g. sport injuries, home injuries, traffic injuries, school injuries and work injuries).
2. Methodology
This article is based on a secondary analysis of the cross-sectional study “First Survey—Health of Young People”.
2.1. Study Design
The “First Survey Health of Young People” study was conducted within the framework of the “Implementation of a School Health Policy” at the request of the Ministry of Education in Cameroon, to collect health information in a representative sample of schoolchildren [19] . All young people included in this study were between 10 and 25 years old and attended primary or secondary education. Younger children were not included because experience has shown that it is hard for them to complete a questionnaire; accordingly, most international studies—like the “Health behavior in School-aged Children” study (HBSC) generally do not consider children less than 10 years in their protocols [20] . Primary school is compulsory in Cameroon. In 2004, school attendance was just below 90% for boys between 8 and 14 years old and around 80% in girls. At 18 years, it was 60% and 38%, respectively [21] .
The sample size was based on a precision of 3% around a proportion of 50%, a confidence interval of 95% and a design effect equal to 1.2 (based on the 1994/1995 and 1997/1998 HBSC Studies). A large sample of 62,000 young people was expected taking also account of the 4 socio-climate zones, the 10 regions and the 2 cities of Yaoundé and Douala. The sample was expected to be representative for the country’s regions, provinces, educational networks, types of education, French or English languages, levels of education and gender.
A self-administered questionnaire was used. It was largely inspired from the 2006 HBSC survey and was adapted to the Cameroonian context (with the help and the agreement of school doctors and experts from the Ministries of Health and Education). It was principally composed by closed and semi opened questions related to demographic characteristic, selected behaviors and other social and psychosocial variables. The filling of the questionnaire was done between October and November 2008, and data were encoded between December 2008 and February 2009. The final dataset received for the present analyses contained questionnaires from 47330 students, corresponding to a response rate equal to 76%.
2.2. Main Outcomes
Approach of the injury question was made by taking into consideration two main outcomes.
Firstly, for having an idea of the problem as a whole, we have considered the question “During the past 12 months, have you been injured (e.g. an open wound, a large bruise)?”. From the four initial levels (“I was not injured”, “1 time”, “2 times”, “3 times or more”), we have made a dichotomous answer (0) Not injured vs. (1) Injured at least one time. We have an answer to this question for 44,754 students on the 47,330 records in the dataset (94.6%).
Secondly, for having an idea of the problem by types of injury, we have considered two questions related to the place and the activity during the most serious injury. The question for the place was “think only about the most serious injury or accident that you had within the past 12 months. Where were you when this most serious injury happened? (Carefully tick the best answer to describe your most serious injury)” with the modalities of answers: 1/at home, in the courtyard; 2/in the garden, in the fields; 3/at school, including school ground and workshop, during school hours; 4/at school, including school ground, outside school hours; 5/at a sport field (not at school); 6/in street, in a parking lot; 7/in the countryside; 8/on the way to or from school; 9/elsewhere. The question investigating the activity was “What were you doing when this most serious injury or accident happened? (Carefully tick the best answer to describe your most serious injury)” with the modalities of answers: 1/riding a bicycle; 2/playing or training for sport, recreational activities; 3/school work (manual work); 4/was working, paid or unpaid work; 5/walking, running (not for sport team or exercises); 6/riding, driving or was a passenger on a scooter, a moped, a motor bike; 7/riding, driving or was a passenger on a car or other motor vehicle; 8/ other activity.
We have observed 20967 answers for the injury place and 19964 answers for the activity; with 19694 cases with both place and activity, 1273 with only the place (but not activity) and 270 with only the activity (and not the place). Based on these information, we have created a decision algorithm for compute five categories of types of injury. We have excluded 794 cases for lack of information (451 “elsewhere” and “other activity”, 178 “elsewhere” and missing value for the activity; 113 “elsewhere” and “walking, running not for a sport team or exercises”, 32 “walking, running not for a sport team or exercises” with missing value for the place, and 20 “other activity” with missing values for the place). The five types were, based on their occurrences: Sport injuries (33.8%), Home injuries (32.2%), Traffic injuries (16.6%), School injuries (11.6%) and Work injuries (5.7%).
2.3. Associated Factors
We have taken under consideration nearly 50 variables: 17 variables for construction of the socioeconomic status, 9 variables for the investigation of symptoms, 11 concerning drugs, 5 for healthy habits, 3 for investigate the violence behavior, 4 concerning the school, 3 for subjective health and finally 3 for social network. Even if, the sample size was very large, we have used principal component analysis, multiple correspondence analysis and weighted-frequency score for reduce the number of them. After these reductions, 15 variables were available for analyses.
2.3.1. Age and Gender
The age of the children/adolescent has been estimated by the subtraction of the birth year from the survey year. The minimum and maximum observed were 10 years and 25 years old. The proportions of each age groups were: 32.8% under or equal to 13 years, 23.4% of 14 - 15 years, 19.4% of 16 - 17 years and 24.4% of 18 Years or more. The sex ratio was nearly equal to one, with 51.8% of boys and 48.2% of girls.
2.3.2. Family Structure and Siblings
The family structure was approached by a constructed variable in four levels: “Only with his/her mother and father” (27.2%), “With his/her two parents and at least someone else” (19.9%), “With one of his/her two parents with or without someone else” (32.3%) and “Without parents but with at least someone else” (20.6%). This was based on the reporting to the question “Please answer for the home where you spend most of the time. Who are the adults living there with you?”; with answer consisted of the ticked adults in a list. The list was mother/fostering mother/father/tutor/aunt/uncle/grand-mother, female cousin/grand-father, male cousin. For the construction of the sibling variable, we have added up the number of brothers and sisters reported by the respondents based on the question: “How many children live with you in your home. Count also your half-brothers and half-sisters, your cousins or the children of your father in-law or mother in-law”. Median (P25-P75) of this distribution was equal to 5 (3 - 7) brothers and/or sisters. We have categorized this variable in three levels with the absence of sibling grouped with the lower number of brothers and/or sisters because of its weak occurrence (5.1%). So, the three levels were: “From zero to three sisters and/or brothers” (33.0%), “Between four and 6 brothers and/or sisters” (36.6%) and “Seven or more brothers and/or sisters” (30.4%).
2.3.3. Socioeconomic Status
The socioeconomic status was approximated by an index using the information collected on assets owned by the young’s family. The assets investigated were (through the dichotomous answer having or not): Tap water in the house/Tap water in the courtyard/Toilet with flushing water in running condition/Latrines/Elevated or hard ground in the house, dry when it rains/A shower or a bath with a tap/A fridge/A television/A radio/A computer /A car/A bicycle/A motor bike/One or more cows/One or more chicken/one or more goats/A garden with growing vegetables.
We have used a principal component analysis (PCA) for extracting from these set of variables the main uncorrelated components that captures the largest amount of information that is common to all of the variables [22] [23] . In our case, we have retained the first four components, according to the Kaiser’s criteria (eigenvalues > 1) and according to the examination of the scree plot [24] [25] (Figure 1). These four components explained nearly half of the total variance (49.1%) with 22.1% and 12.5% respectively for the two first components and only 7.7% and 6.8% for the last two components.
The first component seems to correspond to an “occidental urban” asset index characterized by tap water in the house (0.318), toilet with flushing water in running condition (0.291), shower or a bath with a tap (0.329), fridge (0.331), computer (0.329) and car (0.350). The second component seems to correspond to “rural livestock farmer” asset index characterized by bicycle (0.273), motor bike (r0.321), one or more cows (0.377), one or more chicken (0.434) and one or more goats (0.490). Third component seems correspond to “basic” asset index with latrines (0.426), elevated or hard ground in the house, dry when it rains (0.234) television (0.396) and radio (0.520). Finally, the fourth component is the most difficult to interpret, characterized only with tap water in the courtyard (0.381) and garden with growing vegetables (0.298). We have decided to call this component, the “grower/farmer” asset index.
Afterwards, we have categorized these components in four level for facilitate the analyses.; the first level corresponding to the lowest values of the specific asset index and the last level corresponding to the highest values (Figure 2).
2.3.4. Healthy Habits
A first step was to generate three variables (smoking, alcohol consumption and physical activity) derived from five questions. For the investigation of the smoking status we have compute a new variable from two questions
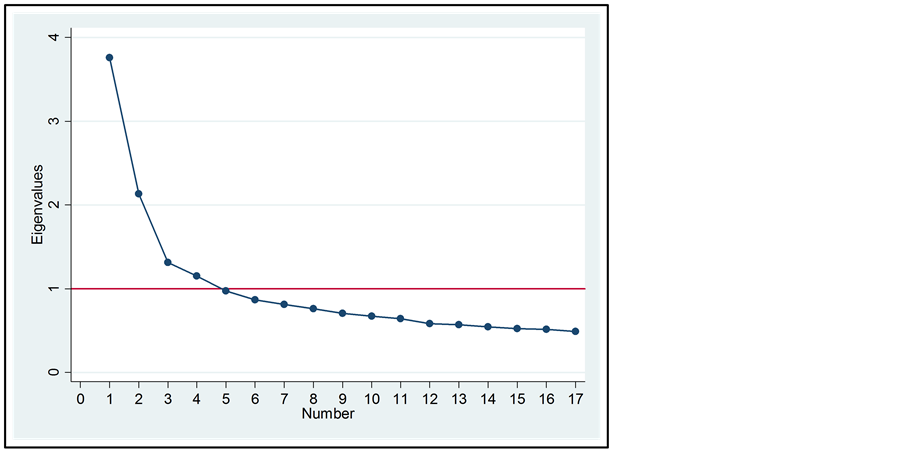
Figure 1. Scree plot of eignevalues after PCA for the construction of the socieconomic status.
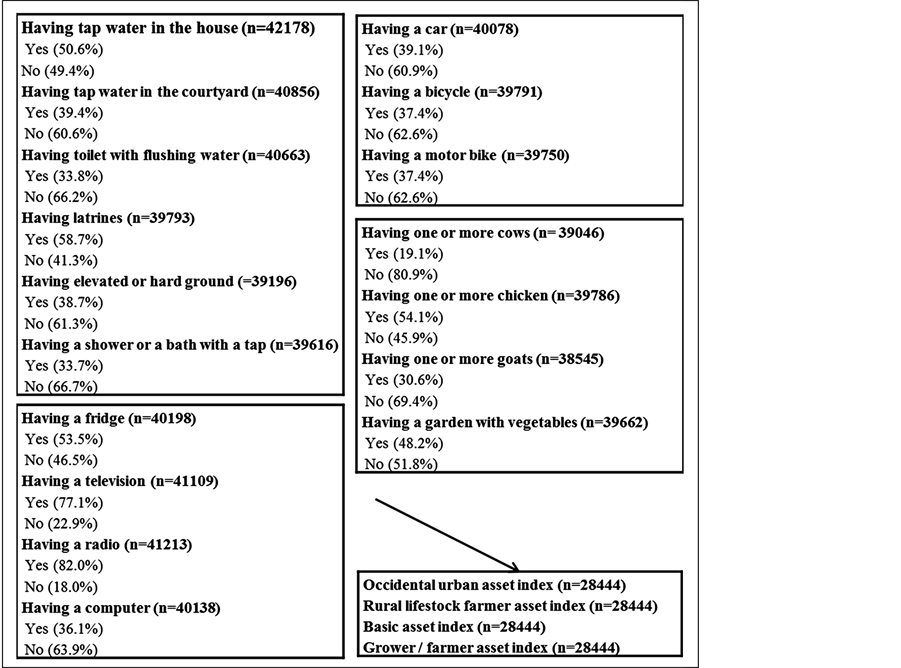
Figure 2. From the original variables used for the construction of the socioeconomic status to the final variable used.
“Have you ever smoke tobacco?” (Yes /No) and “How often do you smoke tobacco at present?” (I don’t smoke/ I smoke every days/at least once a week, but not every day/Less than once a week). Due to weak occurrence of active smoking, our variable had only two levels: (0) Never smoke and (1) Have tried or current smoker. For the alcohol consumption, we also used two questions to make one variable: “Have you ever drank alcoholic drinks (at least one glass of beer, of palm wine whisky, etc.)?” (Yes/No) and “Have you already had so much alcohol that you were really drunk?” (No, never/yes, once/yes, 2 or 3 times/yes, 4 to 10 times/yes, more than 10 times). Our variable was in three levels with (0) Never drink, (1) Drink but never being drunk and (2) Having been drunk at least one time. To objectivize the physical activity behavior we have used the question “Outside school hours, how often do you usually exercise in your free time so much that you get out of breath or sweat?” re-categorized in four levels (1) Never or less than once a month, (2) Between once a month and two times a week, (3) Between three and six times a week, (4) Every day.
A second step has consisted of a multiple correspondence analysis (MCA). It has identified two dimensions which explained 77.7% (75.3% for dimension 1 and 2.4% for the dimension 2) of the inertia among the three variables (Figure 3). Based on the patterns observed on the coordinate plot, we have computed the three levels of the indicator. These three levels, which present a gradient, were arbitrarily named: “Healthy habits”, “Intermediate healthy habits” and “Unhealthy habits” (Figure 4).
2.3.5. Drugs Consumption
The drugs consumption was constructed according to the question “During the past month, did you take any of
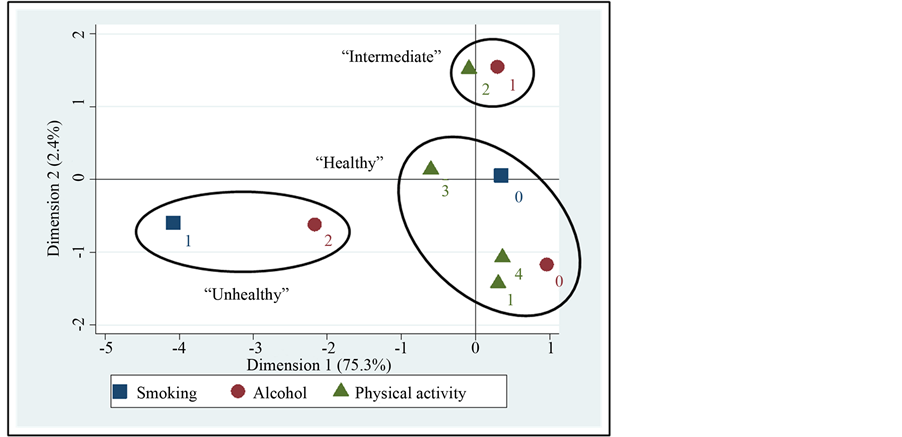
Figure 3. MCA coordinate plot for the creation of the “healthy habits” indicator.
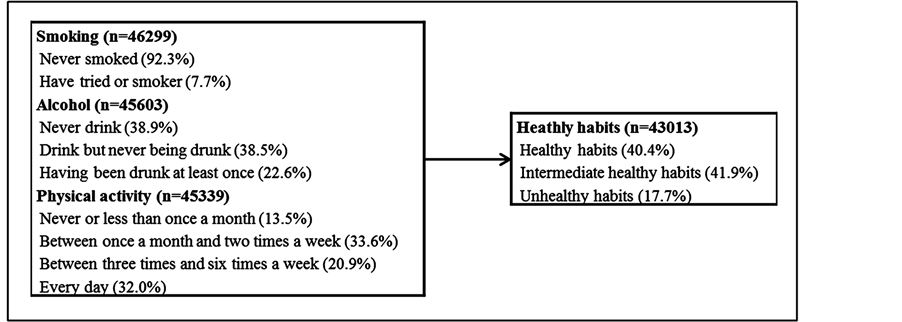
Figure 4. From the original variables used for the construction of the “healthy habits” indicator to the indicator used.
the following?”. We have taken into account eleven substances or groups of substances: cannabis/amphetamine, speed/heroin, illegal methadone/medicines to be hallucinated/cocaine/LSD, acid/Glue, solvent, gasoline, fuel/ hallucinogenic mushrooms/hallucinogenic plants/tranquilizers, barbiturates/ecstasy, “oui-oui” pills. In the survey there were six levels for each variable (from “No” to “Yes, every day”) but due to the weakness of some frequencies we have made dichotomous variables corresponding in one hand to (0) “No, don’t take” vs. (1) “Yes, at least one time”. Based on these dichotomous items we have made a score based on the simple addition of each item without weighting by the relative frequency because of the roughly equal low frequencies for each substance uses. So we have obtained a score range from zero to eleven. But due to low occurrences of the numbers of taken (only 8.5% have declared having taken two or more substances at least one time during the past month); we have re-categorized this score in three levels: “No drug taken”, “One drug taken” and “Two or more drugs taken” (Figure 5).
2.3.6. School Perception
The “School perception” indicator was constructed, with the help of a MCA, by putting together the four variables from the questions: 1/”How do you feel about school at present?” with the two levels (1) Like it a lot, (2) Like it a bit or don’t like it very much or at all. 2/”Since the beginning of the school year, do you usually absent school or school lessons not because you are ill but because you want to do something else like working or playing?” with the two levels (1) Never (2) Yes, at least from time to times. 3/”During the last 30 days, were the pupils in your class kind and helpful to you?” with the three levels (1) Never or rarely, (2) Sometimes, (3) Often or always. 4/”During the last 30 days, did your parents or tutors talked with you about homework and school?” with the three levels (1) Never, (2) Rarely or sometimes, (3) Often or always.
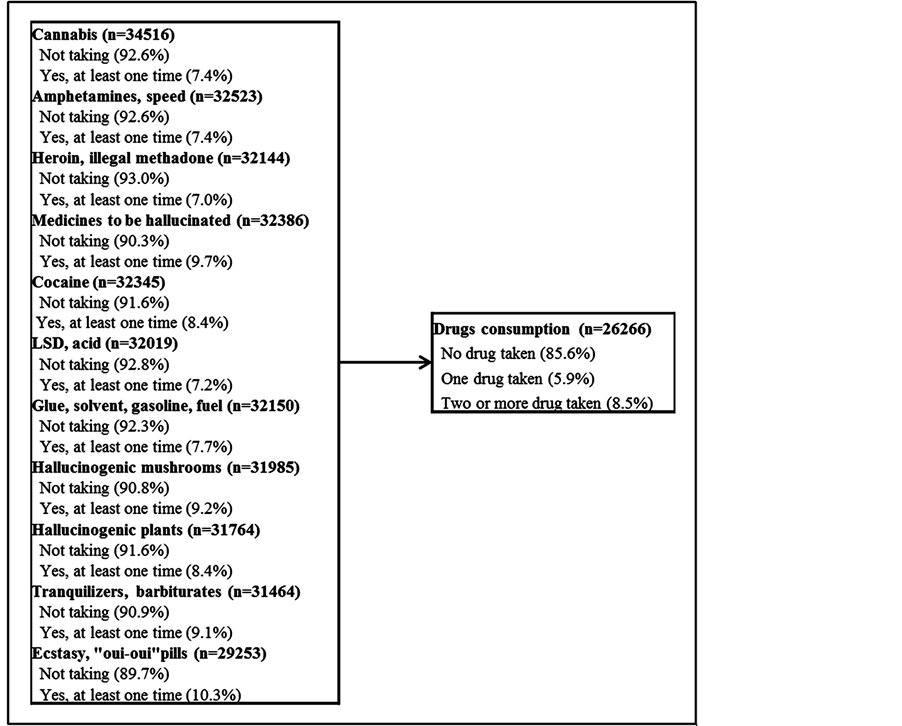
Figure 5. From the original variables used for the construction of the drug consumption score to the score used.
The MCA has identified two dimensions which explained 77.6% (64.7% for dimension 1 and 12.9% for the dimension 2) of the inertia among the four variables (Figure 6). Based on the patterns observed on the coordinate plot, we have computed the three levels of the indicator. These three levels, which present a gradient, were arbitrarily named: “Comfortable feeling with school”, “Intermediate feeling”, “Uncomfortable feeling with school” (Figure 7).
2.3.7. Social Network
The “Social network” indicator was constructed by putting together the three variables from the questions: 1/ “Last month do you feel alone in your head, did you feel abandoned, sad, without help?” with the three levels (1) Very often or quite often, (2) Sometimes, (3) Never. 2/”At present, how many close friends do you have?” with an answer in three levels (1) None, (2) One or two, (3) Three or more. 3/”During the last 30 days, did your parents or tutors talked with you about your leisure time and your activities outside school, about your problems, what you like or about what boring you?” with three levels (1) Never, (2) Rarely or sometimes, (3) Often or always.
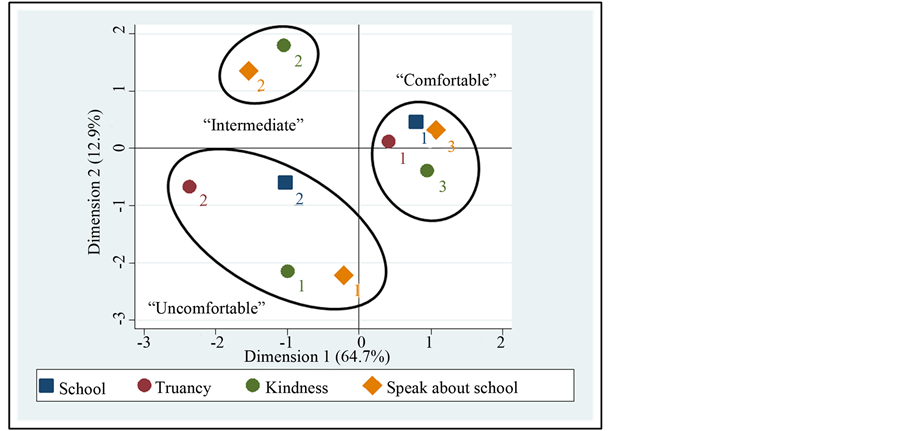
Figure 6. MCA coordinate plot for the creation of the “school perception” indicator.
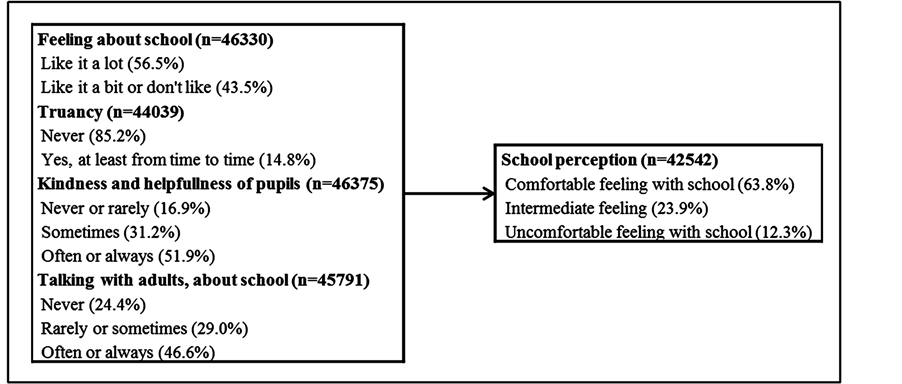
Figure 7. From the original variables used for the construction of the “school perception” indicator to the indicator used.
The MCA has identified two dimensions which explained 89.7% (63.9% for dimension 1 and 25.8% for the dimension 2) of the inertia among the three variables (Figure 8). Based on the patterns observed on the coordinate plot, we have computed the three levels of the indicator. These three levels, which present a gradient, were arbitrarily named: “Excellent network”, “Intermediate network”, “Poor network” (Figure 9).
2.3.8. Violence
The “Violence” indicator was constructed by putting together the three variables from the questions: 1/”Within the last 12 months, how many times did you fight?” with the 3 levels (1) Never, (2) One time and (3) Two times or more; 2/”During the last 30 days, how many times have you taken a weapon at school (like a knife, a pistol)?” with the three levels (1) Don’t have, (2) Don’t bring, (3) Bring at least one time and more; and finally 3/”Since the beginning of school year, have you been bullied, swindled, racketed (someone has forced you to give him/her something, some money, some clothes, while you did not want it)?” also with three levels (1) No, (2) Yes—once, (3) Yes—sometimes or more.
The MCA has identified two dimensions which explained 97.7% (96.6% for dimension 1 and 1.0% for the dimension 2) of the inertia among the three variables (Figure 10). Based on the patterns observed on the coor-
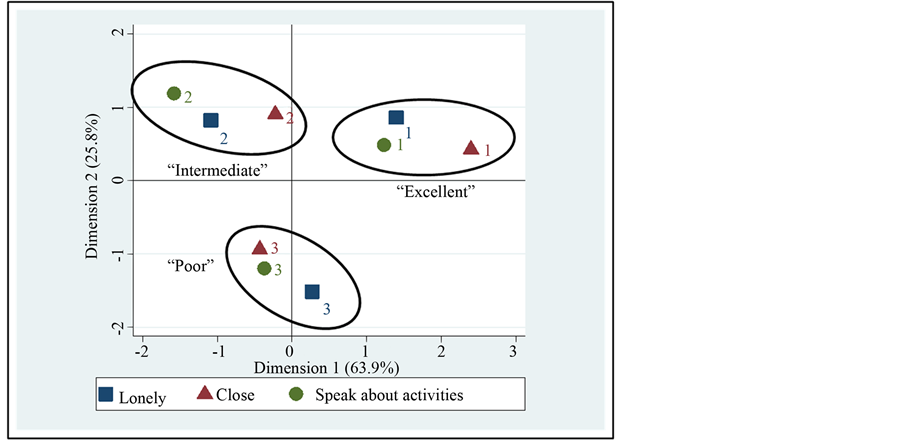
Figure 8. MCA coordinate plot for the creation of the “social network” indicator.
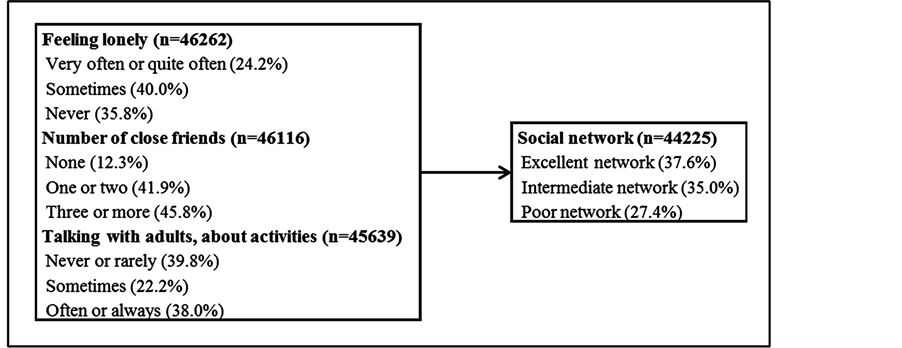
Figure 9. From the original variables used for the construction of the “social network” indicator to the indicator used.
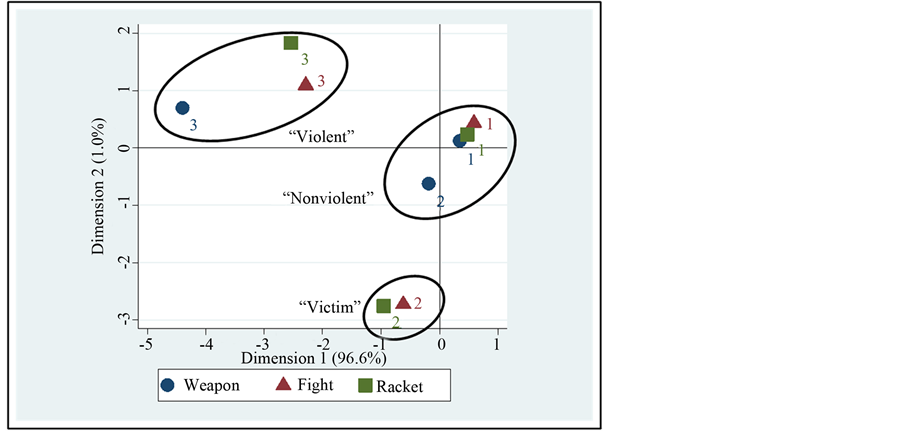
Figure 10. MCA coordinate plot for the creation of the “violence” indicator.
dinate plot, we have computed the three levels of the indicator. These three levels were arbitrarily named “Unviolent profile”, “Victim profile”, “Violent profile”(Figure 11).
2.3.9. Subjective Health
The “Subjective health” indicator was constructed by putting together the three variables from the questions: 1/ “How are you feeling at the moment?” with the three levels (1) Very happy, (2) Happy, (3) Don’t feel happy or not at all happy. 2/”Would you say that your health is…” with four levels (1) Excellent/Rather good/Neither good or bad/Not so good or poor, bad) and 3/”Do you usually feel tired when you wake up in the morning to go to school?” re-categorized in three levels (Never or rarely/Sometimes/One or more times a week).
The MCA has identified two dimensions which explained 91.5% (96.6% for dimension 1 and 1.0% for the dimension 2) of the inertia among the three variables (Figure 12). Based on the patterns observed on the coordinate plot, we have computed the three levels of the indicator. These three levels, which present a gradient, were arbitrarily named “Good subjective health”, “Intermediate subjective health”, “Poor subjective health” (Figure 13).
2.3.10. Symptoms
About the reported symptoms during the past month, we have taken into account these nine following variables: headache/stomachache/bellyache/ backache/want anything, feeling sad, unwell/to be not quiet, stressed up/want sleep but could not/dizziness, fainting/not glad at all, to be angry in there dichotomous version (“No” vs. “Yes, one day or more than one day”). The simple addition of these scores shows a range from 0 to 9 symptoms declared. Median (P25-P75) of this distribution was equal to 5 (3 - 6) symptoms. For given more weight to the low-frequency items, we have made a weighted-frequency score. In the summation equation, we have multiplied each symptom by the inverse of its relative frequency. We have after categorized this summation score on four levels that we have called: “Not many symptoms”, “Medium number of symptoms”, “A lot of symptoms” and “Extreme numbers of symptoms” (Figure 14).
3. Statistical Analyses
Both for the dichotomous and the polytomous outcomes, proportions of injuries were reported in each level of each potential associated factor. The relationship was assessed using the Pearson’s chi-square test. For the dichotomous outcome, when the proportions of these injuries increased (or decreased) in ordered categories of the potential associated factors, we applied the Cochran-Armitage test for trend. Results were considered statistically significant when p < 0.05. We also calculated odds ratio (OR) with their 95% confidence intervals (95%CI) to estimates the strengths of the associations. To further assess these relationships but also for taking into account

Figure 11. From the original variables used for the construction of the “violence” indicator to the indicator used.
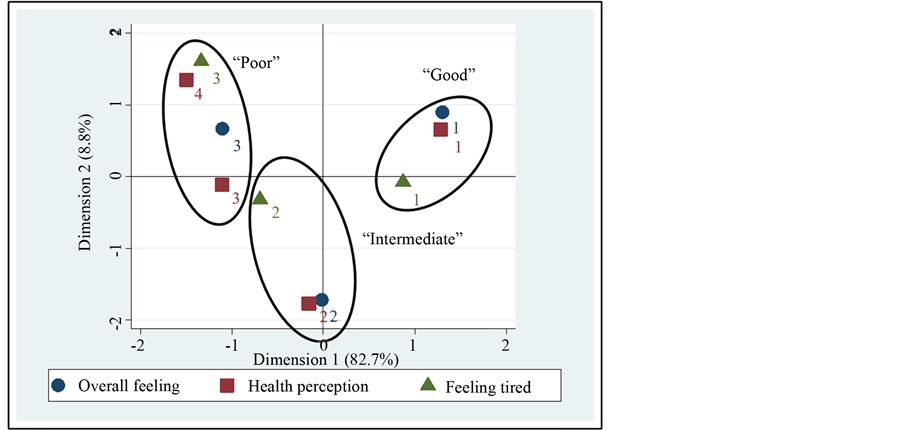
Figure 12. MCA coordinate plot for the creation of the “subjective health” indicator.
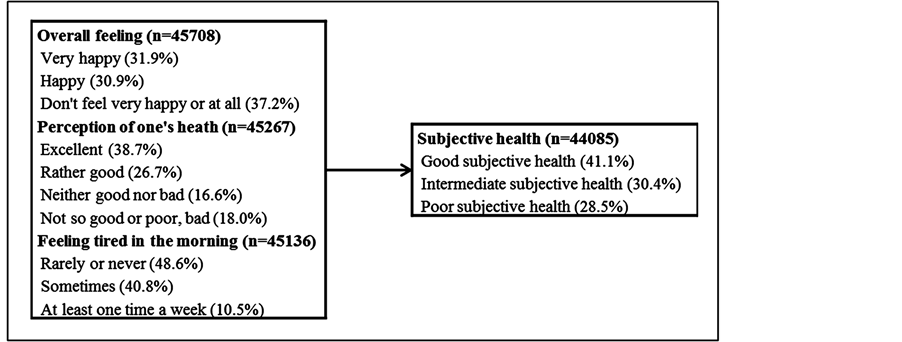
Figure 13. From the original variables used for the construction of the “subjective health” indicator to the indicator used.
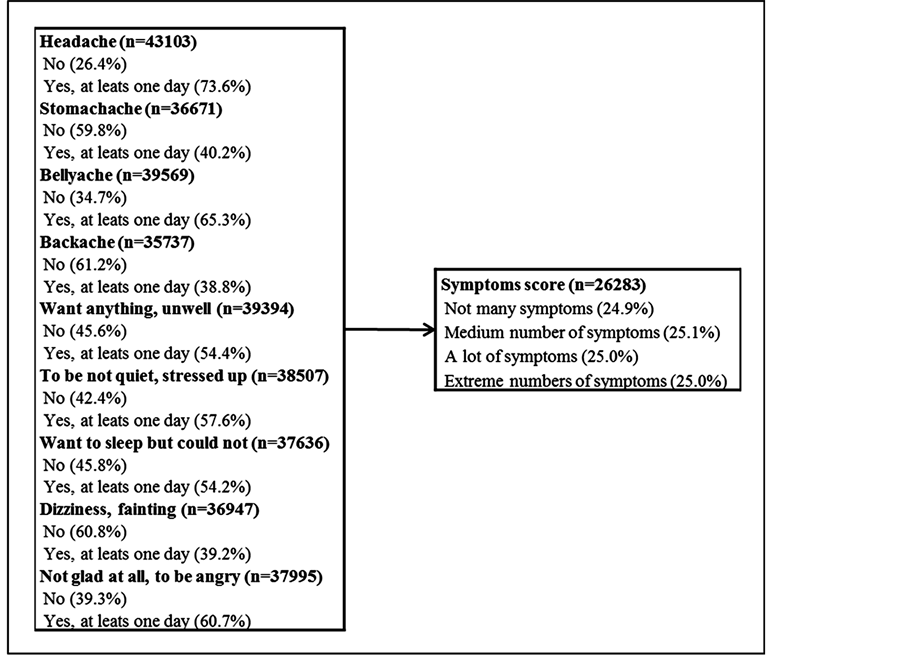
Figure 14. From the original variables used for the construction of the symptoms score to the score used.
the potentials confounding effects of some variables, a logistic regression model—for the dichotomous outcome—and a multinomial logistic regression model—for the polytomous outcome—were applied. The selection of the included variables resulted from a backward stepwise selection with a probability to remove equal to 0.05 and a probability to enter equal to 0.01. Because it is known that patterns of injuries and associated factors could differ by gender and age group, we have tested the interaction between the variables kept in the models and these two variables. The likelihood ratio tests were not statistically significant. Adjusted odds ratios, derived from the final models, were presented with their 95% confidence intervals and the p-value of the Wald’s test. To assess the fit of the models, we used, for the logistic regression model, the Hosmer and Lemeshow goodnessof-fit [26] and for the multinomial regression model, the generalized Hosmer and Lemeshow goodness-of-fit [27] .
4. Missing Values
We had a lot of missing values, however we have chosen to use the complete-case method [28] [29] . The comparisons between complete and incomplete cases have not shown major differences in terms of variations of proportions in the several levels of the investigated factors. So we can suppose that we are under a missing (completely) at random assumption; in that situation the complete cases used were a random sample of the original cases [28] [29] . In multivariate analyses, the nonoverlapping cases lead to the reduction of the sample size and also lead to a diminution of the power. But, because we have a large sample at the beginning (n = 47,330), the number of cases included in the multivariate models stay comfortable: n = 14,632 for the logistic regression and n = 11,968 for the multinomial regression model.
5. Results
The whole injury prevalence was equal to 45.6% (n = 44,754) and among the injured, the proportion of the several types were equal to 33.8% for sport injuries, 32.2% for home injuries, 16.6% for traffic injuries, 11.6% for school injuries and 5.7% for work injuries (n = 20,421).
5.1. Dichotomous Outcome
Univariate analyses show that boys are more likely to report an injury and that the proportions of injuries are the lowest when the family structure is composed only by the mother and the father. We also observe a decreasing linear trend when the age increases and an increase when the number of persons in the siblings increases (Table 1). Regarding the socioeconomic status, in one hand, the reported injuries increase linearly with the increasing of the “occidental urban” and the “rural livestock farmer” indexes; and on the other hand, the proportion of injuries decrease linearly with the increasing of the “basic” asset index (Table 2).
Table 3 shows that there were more injuries reported for the unhealthy habits group, for the group uncomfortable feeling with school, for the poor subjective health group and for the victim and violent profiles. There were also linearly increases when the drugs consumption and the symptoms scores increase.
The multivariable logistic model only retains, as factors significantly associated to injuries, the gender, the age, the drug consumption score, the violent profile and the symptoms score (Figure 15). The strength of the associations is nearly the same that those observed in univariate; but we can though notice that odds ratios are lower for the drugs consumption score (from 1.47 (1.32 - 1.63) to 1.38 (1.18 - 1.55) for the one drug taken” level and from 2.32 (2.11 - 2.54) to 2.00 (1.77 - 2.27) for the “two or more drug taken” level) and for the violent profiles (from 1.77 (1.68 - 1.87) to 1.45 (1.32 - 1.59) for the victim profile and from 2.04 (1.92 - 2.17) to 1.60 (1.44 - 1.78) for the violent profile) (Figure 15).
5.2. Polytomous Outcome
The analyses by types of injuries showed that boys and the youngers were always the most at risk, except for the

Table 1. Proportions of injuries and odds ratio (95%CI) according to gender, age groups, family structure and siblings.
*p value from a trend test.
Table 2. Proportions of injuries and odds ratio (95%CI) according to the four asset indexes.
*p value from a trend test.
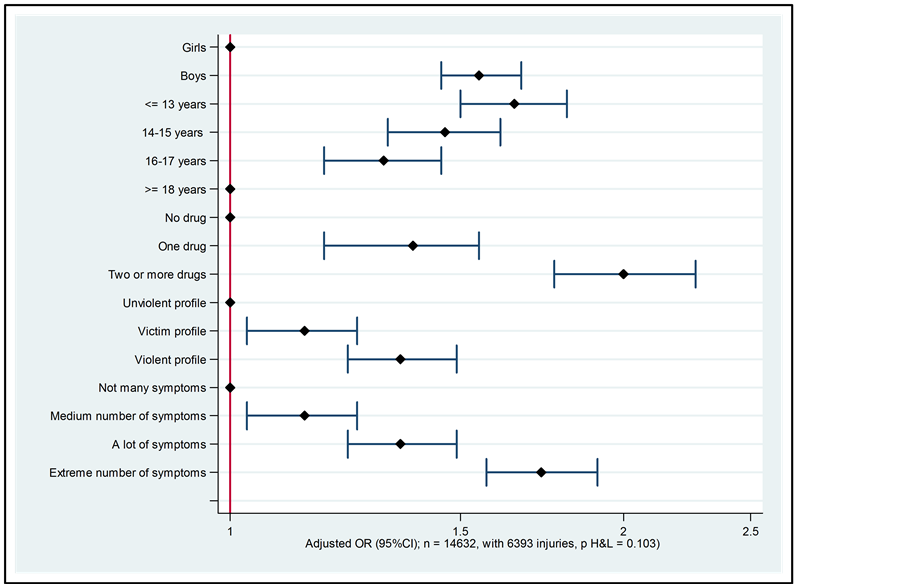
Figure 15. Adjusted OR (95%CI) derived from the multivariate logistic regression model.
Table 3. Table Proportions of injuries and odds ratio (95%CI) according to healthy habits indicator, drug consumption score, school perception indicator, social network indicator, violence indicator, subjective health indicator and symptoms score).
*p value from a trend test.
home injuries for which one it was the girls that have the higher proportion of injuries and, in the case of the work injuries, the proportions were lower for the young children. Also for these work injuries, it was the people living without mother and father which were the most at risk (Table 4). Regarding the socioeconomic status, there were an increase of the sport injuries and a diminution of the work injuries with the increasing of the “oc
Table 4. Proportion of the several types of injuries according to gender, age groups, family structure and siblings.
cidental urban” index. For the “rural livestock farmer” index, the proportion of traffic, school and work injuries gone up with the increase of this index. We can also observe that school injuries diminished with the augmentation of the basic index. Finally, work injuries augmented with the increasing of the “grower/farmer” index, whereas the sport and traffic injuries decreased (Table 5). Concerning the drug consumption, the violence indicator and the symptoms score, the situation goes in the same direction for all types of injuries but with variable intensities. Sport and school injuries decreased with the diminution of the social network indicator and work injuries increased when the subjective health indicator goes toward poorest (Table 6). The multivariable multinomial logistic model has retained, as significantly associated, the same factors as those obtained in the investigation of the dichotomous outcome; however the socioeconomic indexes were in addition to in the model. Differences with the univariate analyses were that, adjusted for all the variables included in the model, gender was no longer significantly associated to home injuries and the strength of the associations with the drug consumption score was weaker (Table 7).
6. Discussion
In order to contribute to the literature on children and adolescents health behaviors, we carry out this study using existing data from the “First Survey Health Young People” which was performed at the end of 2008 in Cameroon. Our aims were to establish profiles of young “at risk” of injuries, first, on an overall point of view and, secondly, for some types of injuries (e.g. home injuries, sport injuries, leisure injuries, road traffic injuries).
Table 5. Proportion of the several types of injuries according to the four asset indexes.
The whole injury prevalence was equal to 45.6% (n = 44754) and among the injured, the proportion of the several types were equal to 33.8% for sport injuries, 32.2% for home injuries, 16.6% for traffic injuries, 11.6% for school injuries and 5.7% for work injuries (n = 20421). To the best of our knowledge, few studies have investigated several types of injuries – and their associated factors – inside the same study [14] [30] [31] . On their paper on the epidemiology of non-fatal injuries among youth in 11 European countries participating to the HBSC cross national survey, Molcho [30] and colleagues have found that most injuries occurred at home and during sport activity. We have also found these two principal types of injuries in our study. They also found school and street as an important place of injuries but they don’t speak about work injuries. The difference probably came from the fact that the study was based on European and American data, high income countries in which the young have generally no need to work during their school years. Then again, in his study focusing on prevalence and social correlates of injury among in-school adolescents in Botswana, Peltzer [32] found approximately 9% of “doing work” as activity leading to the injury. He also found, as involved activities, “playing
Table 6. Proportion of the several types of injuries according to healthy habits indicator, drug consumption score, school perception indicator, social network indicator, violence indicator, subjective health indicator and symptoms score.
Table 7. Table Adjusted OR (95%CI) derived from the multivariate multinomial logistic regression model (n = 11968, with 1792 Sport, 1666 Home, 873 Traffic, 535 School, 319 Work injuries).
a sport” (a fifth) and “riding a bicycle or a scooter” (around 1/10). In their study in four Asian countries, Peltzer and Pengpid [31] have found, like us, that there were, in terms of activity, more “playing or training for a sport” than “riding or driving in a car or in other motor vehicle”/”riding a bicycle or scooter”. There was also less “doing any paid or unpaid work” than the two previous cited categories of activities.
We have observed that boys had significantly higher injury proportion than girls and that the injury rate decreased when age increased. These observations were a constant in all studies regardless the localizations of these studies [7] [13] [14] [30] [33] [34] . These results may reflect, according to Wilson [35] and colleagues, societal norms where boys are allowed more freedom than girls to explore their environments. But also, according to Morrongiello and Lasenby-Lessard [36] who have reported in their study on psychological determinants of risk taking by children that gender has been shown to have a strong influence on children's tendency to take risks, and on their injury rates. Consistent with epidemiological evidence that boys experience more frequent injuries than girls, laboratory research and studies in real-life situations show that boys engage in greater risk taking than girls. Furthermore, young children are also less adept at calculating risk they experiment with the features of their environments [15] . In the multivariate multinomial model, we have found the same tendencies for all the injury types, except for home injuries, for which the association with the gender became not significant. This result is in agreement with the analyses made by Molcho [30] and colleagues based on the data from 11 countries participating to the HBSC study.
Regarding the socioeconomic status, comparisons are a little difficult because nearly each study use its own construction/elaboration. For the overall injuries, we have found an increase of the proportion of injuries with the increasing of the rural livestock farmer index and a decrease with the decreasing of the basic index. Nevertheless, these associations did not remain in multivariate models. On the other hand, the multivariate multinomial model had shown, for the occidental urban index – corresponding for us to a conformable socio economic level, an increase of the sport injuries and a decrease of the work injuries. In the rural livestock farmer index, the highest proportions of work injuries were found for the high and the highest values of this index. Wilson [35] and colleagues, in their study in a sample of African children, have found a link between poverty and the injury risk: poor children were injured more often than others. While, Moshiro [37] and colleagues found, in their study led in Tanzania, that poverty levels were not associated with experiencing non-fatal injuries. According to Williams [12] and colleagues the link between the socioeconomic status and injury is not the same regarding the outcome taken into account. Where morbidity is the outcome, the results have been less consistent and studies failed to find any relationship with socioeconomic status. They also postulate that for adolescents, in comparison with young children, the effect of the socioeconomic status were less visible because of the influence of peer group, of young culture and because of influences of school which exert a stronger effect on health behaviors than family, home background and neighborhood factors.
Despite the fact that some studies found associations between the number of siblings in the house, with an increase of the occurrence of injuries with the augmentation of the number of brothers and/or sisters, our study has shown a modest association for the overall injuries, which had not remained in the multivariate analysis [38] .
Pattusi [39] and colleagues have not found association between family structure, investigated through the dichotomous variable living with both parent or living in another situation, and the risk of injury. It is the same tendencies in the study of Starkuviene and Zaborskis [40] , based on the Lithuanian HBSC data. They failed to identify significant associations between family composition and risk for injury among schoolchildren. It is the same extent for Pickett [41] and colleagues who have found modest and non-significant associations between injuries and the number of parents in residence. They found a little lower proportion of Canadian adolescents living with two parents in the injured group in comparison with those that were not injured. Contrariwise, in their study on pedestrian injuries among Hispanic children, Argan [42] and colleagues have found an increase of the injury risk with the household crowding.
Our “School perception” indicator takes into consideration the feeling about school, the kindness and helpfulness of others pupils, the truancy and the possibility to talk about homework and school with parents or tutors. In univariate analyses, our results have shown that there was more reported injuries for the school-children which reported having an intermediate or uncomfortable feeling with school compared with pupils which were in the group labeled as having comfortable feeling with school. These tendencies were the same fort each type of injuries. In our case, these associations remain not significant in multivariate analyses; this is in contrast with a number of others studies which have found association with truancy [13] .
Concerning the “Social network” indicator, which takes into consideration three dimensions: the loneliness feeling, the number of close friends and the possibilities to talk (about leisure activities but also about encountered problems) with parents or tutors, we found lower proportion of injuries in the intermediate and poor social network indictor in comparison with the group having an excellent social network. Starkuviene and Zaborskis [40] have also found a higher risk of injury for the Lithuanian schoolchildren who reported spending much time with friends. Peltzer [13] , in his paper on injuries and social determinants among in-school adolescents in six African countries, has found a link between loneliness and injuries.
According to Pickett [43] and colleagues, on one hand, supportive social climates can minimize engagement in risk taking and may also protect adolescents from the occurrence of injury; and on the other hand, non-supportive environments are associated with adverse health outcomes. In our study we found lowest proportions of injuries in the intermediate and poor network in comparison with the excellent network; but this association doesn’t remain in multivariate analysis.
Smoking, alcohol consumption and physical activity were the basis of our healthy habits indicator. Univariate analysis of the overall injuries had shown a higher proportion of injuries in the unhealthy group in comparison with the intermediate and the healthy habits groups but this association did not remain in the multivariable models. This may be due to the fact that we have a small proportion of unhealthy behaviors. Smoking and drunkenness were not highly prevalent in our sample, and also these young are more in a pattern of a trying behavior rather than a fixed consuming behavior. In his paper on injuries and social determinants among in-school adolescents in six African countries, Peltzer [13] also don’t find a link with physical activity but he found association with smoking and drinking. It is the same observations in a Chinese cohort of students, for Zhou, Chen and Dong [44] which found an association with alcohol consumption but also with the trying smoking behavior. Muula [7] and colleagues, in their study based on the data of the Djibouti Global School-based Health Survey, found that adolescents who smoke cigarettes were more likely to report injuries. Sindelar, Barnett and Spirito [45] have demonstrated in their review on adolescent alcohol use and injury that alcohol-positive adolescents are more likely than alcohol-negative adolescents to be injured, require trauma service care and have injury complications.
Our violence indicator, based on to being engage in fights, taking weapon at school and being victim of racket, is one of the factors strongly associated with the occurrences of injuries. There were more injuries in the violent and victim profiles both in the general and by type of injuries.
Several studies have shown the links between weapon-carrying and/or physical fighting and/or bullying victimization and injuries [46] -[50] . This is a complex problem because some young are clearly engaged in violent behaviors but it is also demonstrated that the bullied young and/or the victims of extortion have reported carrying a weapon for protection and were engaged in fights because they are victim of attack from other pupils. Therefore, due to the fact that data were cross-sectional, it is impossible to assign a cause-and-effect relationship between carrying a weapon, becoming involved in fights and/or being victim of extortion. Beside these links between violent behaviors, it is also important to note that, as shown by Pickett [48] and colleagues, based on data from European countries, by Bailey [51] and colleagues in the United States, by Pengpid and Peltzer [52] in Thailand, by Muula [49] and colleagues in Venezuela, as well as by Rudatsikira [53] and colleagues in Namibia, these types of results can be a marker for a lifestyle that has inherent injury risks for boys and girls. This lifestyle, that includes fighting, has been described as the multiple risk behavior syndromes, a behavioral syndrome that can include substance use and abuse, truancy and other problem behaviors during adolescence.
In his paper on injuries and social determinants among in-school adolescents in six African countries, Peltzer [13] find a gradual association with drug use. The same observation was made by Vital [54] and colleagues. Our results go in this direction both for injuries in general and for the several types. Siziya [55] and colleagues in their paper on the socio-demographic factors related to cannabis use found that Zambian adolescents who reported to have been bullied were also likely to have used cannabis before. Knowing that there is a link between bullying and occurrence of injury, these results are important. It is also interesting to note that these results were also observed in adulthood. Miller [56] and colleagues have found that alcohol and drug abusers have a higher probability of injury, of more injury than require hospitalization, and of more injury episodes than the controls enrolled in their study. Same tendencies were found by Cherpitel [57] . It is then important to ensure that drug consumption in adolescence will be only a temporary behavior, which will not be kept in adulthood.
Our subjective health indicator, based on the overall feeling, the perception of one’s health and the feeling of tiredness in the morning, despite the significantly p-value, was not really associated with the proportion of overall injuries. Regarding the injuries types, this indicator was much more associated in case of work injuries and to a lesser extent in case of traffic injuries but these observations remained not in multivariate models. However, Zhou, Chen and Dong [44] have found an increase of the injury proportions with the increase of the self-perceived agrypnia in a cohort of Chinese students. Also, Li [58] and colleagues have shown a negative association between sleep duration and occurrence of injuries among school-aged children in rural China. Stallones, Beseler and Chen [59] have also found association between injuries and being late in school and afternoon sleepiness, among adolescent farm residents in the United States. Finally, even if Pattusi [39] and colleagues have found a higher risk of injuries among Brazilian adolescents who have reported behavioral and emotional problem, they have not found a link with self-related health.
Despite that, we have found a strong and linear association between the number of declared symptoms and the occurrences of injuries. This gradient remains significant in multivariate analyses both for the overall injuries and for the several types. Vital [54] and colleagues have also found that a psychological profile of frequent complain of some kind of distress, namely depression, anxiety, and back pain, among others, is associated with having more injury-related events. The systematic review of Turner, Mc Clure and Pirozzo [60] agreed with that observation. Chen [33] and colleagues have also found association between psychological symptoms, measured with the help of a symptom-checklist, and the happening of injuries. Eventually, Starkuviene and Zaborskis [40] have found a higher risk of injuries for the Lithuanian schoolchildren who reported unhappiness.
Although comparison with international studies is hampered by definitions of risk behavior, it would appear that there are no consistent and marked deviations in this study from the findings obtained in previous studies (conducted either in high, middle or in low income countries).
In their paper on multiple risk behavior and injury, Pickett [41] and colleagues have observed strong gradients in risk for injury according to the numbers of risk behaviors reported, so multiple risk behavior, i.e. the simultaneous engagement in self-reported risks such as smoking, drug and alcohol use and truancy, is a recognized individual risk factor for injury [42] . Peltzer [13] had also observed that injury risk increased consistently and strongly with the increasing number of risk behaviors. The same observation was made by Muula [7] and colleagues. They have found that injured adolescents were more likely to have multiple problems. Finally, Turner, Mc Clure and Pirozzo [60] in their systematic review on injury and risk-taking behavior have shown that risktaking behavior, however it is measured, is associated with an increased chance of suffering from injury.
Analyzing injuries in general is interesting but for preventing them it is important to know in which activities children and students are engaged when they are injured. It is vital for injury prevention strategies [12] . Therefore, in summary, we can say that, in light of the variables studied, the “at risk” profile for having reported an injury was being a boy, being younger, having drug experiences, with violent profile, and declaring several symptoms. The “at risk” profile for having reported a sport injury was being a boy, with a highest value of “occidental urban” index, having drug experiences, with violent profile, and declaring several symptoms. The home injury profile was being younger, also with an experience of drugs consumption and an important score of symptoms declared. To be a boy, with highest “occidental urban” index and also with a record of drugs consumption as well as an important score of symptoms declared was the profile for the traffic injuries. Drugs experiences and declaring several symptoms were present the school and work profiles too, just as to be a boy. However in the “at risk” profile for school injuries, the injured people were younger, with low values of “basic” index and with a victim profile. For the work injury, be an “at risk” profile signified to be older with high values of “rural livestock farmer” index.
To see the situation in a “positive vision” is to say, as Peltzer [61] in his paper on the health behavior and protective factors among school children in four African countries, that there is an important part of the schoolchildren which are engaged in healthy behaviors (e.g. non-tobacco use, nor or moderate alcohol consumption, no drug use, physically active for at least 60 minutes per day) and these healthy behaviors are correlates with school attendance, parental or guardian connectedness, peer support at school, or parental supervision. There are links between unhealthy or risky behaviors and injuries but we also say that there are links between healthy behavior and protective factors, therefore, it is important to plan actions which aim to reduce risk behaviors and to increase protective behaviors among individuals and groups, as well as positive changes to the physical environment (“safe place to live”).
7. Limitation of the Study
Several limitations of this study should be noted. First, the cross sectional study design precludes any determination of the direction of causality. Concerning the report of injuries, the 12 months recall may lead to an underestimation of injuries because of the “less serious”—those who did not result in a care—can be forgotten [16] [62] . Moreover, this First Survey—Health Young People covers a broad range of topics related to the health of youth; as such, in-depth information on the exact circumstances leading to individual injury events cannot be obtained. Despite the fact that this type of survey ranges a myriad of factors, it is obvious that the variables used can only get a partial picture of the whole phenomenon. The possibility of biased also exist: the reporting of health and risky behaviors in a self-completed questionnaire may be influenced by a desire to provide socially desirable responses. Moreover, because the study is based on school-children, we do not have data for young people and adolescents who do not attend school, the latter being known to be more likely to adopt unhealthy lifestyle, to live in a less safer environment and therefore to face multiple health risks.
Acknowledgements
The study was under the responsibility of C. Mbena (Ministry of secondary education, Cameroon) and of D. Piette, G Houioux & P. de Smet (ULB, Belgium). MP.Kuate (Ministry of primary education, Cameroon) and P. Libite (Cameroon’s National Institute of Statistics) were very active respectively during the preparation of the survey and the data processing. The project was financed by the World Bank via Plan Cameroon, the “PASE” (MrTchameni, “Plan d’Appui au SystèmeEducatif”), and finally Education Management Europe (Serge Coussement) who sub-contracted the project to the ULB.
References
- Otieno, T., Woodfield, J.C., Bird, P. and Hill, A.G. (2004) Trauma in Rural Kenya. Injury, 35, 1228-1233. http://dx.doi.org/10.1016/j.injury.2004.03.013
- Juillard, C., Mballa, G.A.E., Ndongo, C.B., Stevens, K. and Hyder, A. (2011) Patterns of Injury and Violence in Yaoundé Cameroon: An Analysis of Hospital Data. World Journal of Surgery, 35, 1-8. http://dx.doi.org/10.1007/s00268-010-0825-5
- Howe, L.D., Huttly, R.A. and Abramsky, T. (2006) Risk Factors for Injuries in Young Children in Four Developing Countries: The Young Lives Study. Tropical Medicine & International Health, 11, 1557-1566. http://dx.doi.org/10.1111/j.1365-3156.2006.01708.x
- Nsekero, E., Curationis, M. and Brysiewicz, P. (2010) Injury Surveillance in a Central Hospital in Kigali, Rwanda. Journal of Emergency Nursing, 36, 212-216.
- Osifo, O.D., Iribhogbe, P.E. and Ugiagbe, E.E. (2012) Epidemiology and Pattern of Paediatric and Adolescent Trauma Deaths in a Level 1 Trauma Center in Benin City, Nigeria. Injury, 43, 1861-1864. http://dx.doi.org/10.1016/j.injury.2011.07.016
- Mefire, A.C., Mballa, G.A.E., Kenfack, M.A., Juillard, C. and Stevens, K. (2013) Hospital-Based Injury Data from Level III Institution in Cameroon: Retrospective Analysis of the Present Registration System. Injury, 44, 139-143. http://dx.doi.org/10.1016/j.injury.2011.10.026
- Muula, A., Siziya, S. and Rudatsikira, E. (2011) Prevalence and Socio-Demographic Correlates for Serious Injury among Adolescents Particpating in the Djibouti 2007 Global School-Based Health Survey. BMC Research Notes, 4, 372.
- Zwi, K.J., Zwi, A.B., Smettanikov, E., Söderlund, N. and Logan, S. (1995) Patterns of Injury in Children and Adolescents Presenting to a South African Township Health Center. Injury Prevention, 1, 26-30. http://dx.doi.org/10.1136/ip.1.1.26
- Kobusingye, O.C. and Lett, R.R. (2000) Hospital-Based Trauma Registries in Uganda. Journal of Trauma-Injury Infection & Critical Care, 48, 498-502. http://dx.doi.org/10.1097/00005373-200003000-00022
- Kanchan, T., Menezes, R.G. and Monteiro, F.N.P. (2009) Fatal Unintentional Injuries among Young Children—A Hospital Based Retrospective Analysis. Journal of Forensic and Legal Medicine, 16, 307-311. http://dx.doi.org/10.1016/j.jflm.2008.12.017
- Patton, G.C., Coffey, C., Sawyer, S.M., Viner, R.M., Haller, R.M., Bose, K., Vos, T., Ferguson, J. and Mathers, C. (2009) Global Patterns of Mortality in Young People: A Systematic Analysis of Population Health Data. Lancet, 374, 881-892. http://dx.doi.org/10.1016/S0140-6736(09)60741-8
- Williams, J.M., Currie, C., Wright, P., Elton, R.A. and Beattie, T.F. (1997) Socioeconomic Status and Adolescent Injuries. Social Science & Medicine, 44, 1881-1891.
- Peltzer, K. (2008) Injury and Social Determinants among In-School Adolescents in Six African Countries. Injury Prevention, 14, 381-388. http://dx.doi.org/10.1136/ip.2008.018598
- Flisher, A.J., Ward, C.L., Liang, H., Onya, H., Mlisa, N., Terblanche, S., Bhana, A., Parry, C.D. and Lombard, C.J (2006) Injury-Related Behaviour among South African High-School Students at Six Sites. South African Medical Journal, 96, 825-830.
- World Health Organization and United Nations Children’s Fund (2008) World Report on Child Injury Prevention. The World Health Organization, Geneva.
- Li, G. and Baker, S.P. (2012) Injury Research. Theories, Methods and Approaches. Springer, New York.
- World Health Organization (2004) Guidelines for Conducting Community Surveys on Injuries and Violence. The World Health Organization, Geneva
- Pickett, W., Schmid, H., Boyce, W.F., Simpson, K., Scheidt, P.C., Peter, C., Mazur, J., Molcho, M., King, M.A., Godeau, E., Overpeck, M., Aszmann, A., Szabo, M. and Harel, Y. (2002) Multiple Risk Behavior and Injury: An International Analysis of Young People. Archives of Pediatrics and Adolescent Medicine, 156, 786-793. http://dx.doi.org/10.1001/archpedi.156.8.786
- Piette, D., Houioux, G., De Smet, P. and Mbena, C. (2010) Démarche participative d'une étude de la santé des jeunes d'âge scolaire au Cameroun. IUHPE World Conference on Health Promotion and Education, Geneva.
- Health Behavior in School-Aged Children. http://www.hbsc.org
- Institut National de la Statistique and ORC Macro (2004) Enquête Démographique et de Santé du Cameroun 2004. INS et ORC Macro, Calverton. http://www.measuredhs.com
- Filmer, D. and Pritchette, L. (2001) Estimating Wealth Effects without Expenditures Data—Or Tears: An Application to Educational Enrollments in States of India. Demography, 38, 115-132.
- Jackson, J. (2003) A User’s Guide to Principal Components. Wiley Series in Probability and Statistics, Wiley, New York.
- Everitt, B. and Dunn, G. (2001) Applied Multivariate Data Analysis. 2nd Edition, Wiley, London. http://dx.doi.org/10.1002/9781118887486
- Tabachnick, B. and Fidell, L. (2001) Using Multivariate Statistics. 4th Edition, Allyn & Bacon, Boston.
- Hosmer, D.W. and Lemeshow, S. (2000) Applied Logistic Regression. 2nd Edition, Wiley Series in Probability and Statistics, Wiley, New York.
- Fagerland, M.W. and Hosmer, D.W. (2012) A Generalized Hosmer-Lemeshow Goodness-of-Fit Test for Multinomial Logistic Regression Models. Stata Journal, 12, 447-453.
- Little, R. and Rubin, D. (1987) Statistical Analysis with Missing Data. Wiley Series in Probability and Statistics, Wiley, New York.
- Graham, J.W. (2012) Missing Data: Analysis and Design. Statistics for Social and Behavioral Sciences, Springer, New York. http://dx.doi.org/10.1007/978-1-4614-4018-5
- Molcho, M., Harel, Y., Pickett, W., Scheidt, P.C., Mazur, J., Overpeck, M.D. and on behalf of the HBSC Violence and Injury Writing Group (2006) The Epidemiology of Non-Fatal Injuries among 11-, 13- and 15-Year Old Youth in 11 Countries: Findings from the 1998 WHO-HBSC cross National Survey. International Journal of Injury Control and Safety, 13, 205-211. http://dx.doi.org/10.1080/17457300600864421
- Peltzer, K. and Pengpid, S. (2012) Injury and Social Correlates among In-School Adolescents in Four Southeast Asian Countries. International Journal of Environmental Research and Public Health, 9, 2851-2862. http://dx.doi.org/10.3390/ijerph9082851
- Peltzer, K. (2009) Prevalence and Social Correlates of Injury among In-School Adolescents in Botswana. African Safety promotion: A Journal of Injury & Violence Prevention, 7, 1-13.
- Chen, G., Smith, G.A., Deng, S., Chen, D., Kelleher, K. and Xiang, H. (2005) Psychological Symptoms and Nonfatal Unintentional Injuries among Chinese Adolescents: A Prospective Study. Journal of Adolescent Health, 37, 460-466. http://dx.doi.org/10.1016/j.jadohealth.2004.09.005
- Currie, C.E., Willimas, J.M., Wright, P., Beattie, T. and Harel, Y. (1996) Incidence and Distribution of Injury among Schoolchildren Aged 11-15. Injury Prevention, 2, 21-25. http://dx.doi.org/10.1136/ip.2.1.21
- Wilson, M., Hasselberg, M., Kigwangalla, H., Boursiquot, B. and Laflamme, L. (2013) The Association between Family Health Status and Child Injury in a Sample of African Children. International Journal of Injury Control and Safety, 20, 91-93. http://dx.doi.org/10.1080/17457300.2011.648674
- Morrongiello, B.A. and Lasenby-Lessard, J. (2007) Psychological Determinants of Risk Taking by Children: An Integrative Model and Implications for Interventions. Injury Prevention, 13, 20-25. http://dx.doi.org/10.1136/ip.2005.011296
- Moshiro, C., Heuch, I., Åstrøm, A.N., Setel, P., Hemed, Y. and Kvåle, G. (2005) Injury Morbidity in an Urban and a Rural Area in Tanzania: An Epidemiological Survey. BMC Public Health, 5, 11.
- Celis, A., Gomez, Z., Martinez-Sotomayor, A., Arcila, L. and Villaseñor, M. (2003) Family Characteristics and Pedestrian Injury Risk in Mexican Children. Injury Prevention, 9, 58-61. http://dx.doi.org/10.1136/ip.9.1.58
- Pattussi, M.P., Lalloo, R., Bassani, D.G. and Olinto, M.T. (2008) The Role of Psychosocial, Behavioural and Emotional Factors on Self-Reported Major Injuries in Brazilian Adolescents: A Case-Control Study. Injury, 39, 561-569. http://dx.doi.org/10.1016/j.injury.2007.11.013
- Starkuviene, S. and Zarborskis, A. (2005) Links between Accidents and Lifestyle Factors among Lithuanian Schoolchildren. Medicina (Kaunas), 41, 73-80.
- Pickett, W., Garner, M.J., Boyce, W.F. and King, M.A. (2002) Gradients in Risk for Youth Injury Associated with Multiple-Risk Behaviours: A Study of 11,329 Canadian Adolescents. Social Science & Medicine, 55, 1055-1068. http://dx.doi.org/10.1016/S0277-9536(01)00224-6
- Argan, P., Winn, D., Anderson, C. and Del Valle, C. (1998) Family, Social and Cultural Factors in Pedestrian Injuries among Hispanic Children. Injury Prevention, 4, 188-193. http://dx.doi.org/10.1136/ip.4.3.188
- Pickett, W., Dostaler, S., Craig, W., Janssen, I., Simpson, K., Shelley, S.D. and Boyce, W.F. (2006) Associations between Risk Behavior and Injury and the Protective Roles of Social Environments: An Analysis of 7235 Canadian School Children. Injury Prevention, 12, 87-92. http://dx.doi.org/10.1136/ip.2005.011106
- Zhou, L., Chen, D. and Dong, G. (2013) Characteristics and Related Factors of Nonfatal Injuries among Adolescents in Shenzhen City of China. BMC Public Health, 13, 392.
- Sindelar, H.A., Barnett, N.P. and Spirito, A. (2004) Adolescent Alcohol Use and Injury. A Summary and Critical Review of the Literature. Minderva Pediatrica, 53, 291-309.
- Lowry, R., Powell, K.E., Kann, L., Collins, J.L. and Kolbe, L.J. (1998) Weapon-Carrying, Physical Fighting, and Fight-Related Injury among U.S. Adolescents. American Journal of Preventive Medicine, 14, 122-129. http://dx.doi.org/10.1016/S0749-3797(97)00020-2
- Hammig, B.J., Dahlberg, L.L. and Swahn, M.H. (2001) Predictors of Injury from Fighting among Adolescent Males. Injury Prevention, 7, 312-315.http://dx.doi.org/10.1136/ip.7.4.312
- Pickett, W., Craig, W., Harel, Y., Cunningham, J., Simpson, K., Molcho, M., Mazur, J., Dostaler, S., Overpeck, M.D., Currie, C.E. and on behalf of the HBSC Violence and Injuries Writing Group. (2005) Cross-National Study of Fighting and Weapon Carrying as Determinants of Adolescent Injury. Pediatrics, 116, e855-e863. http://dx.doi.org/10.1542/peds.2005-0607
- Muula, A., Herring, P., Siziya, S. and Rudatsikira E. (2009) Bullying Victimization and Physical Fighting among Venezuelan Adolescents in Barinas: Results from the Global School-Based Health Survey 2003. Italian Journal of Pediatrics, 35, 38.
- Kubwalo, H.W., Muula, A.S., Siziya, S., Pasupulati, S. and Rudatsikira, E. (2013) Prevalence and Correlates of Being Bullied among In-School Adolescents in Malawi: Results from the 2009 Global School-Based Health Survey. Malawi Medical Journal, 25, 12-14.
- Bailey, S.L., Flewelling, R.L. and Rosenbaum, D.P. (1997) Characteristics of Students Who Bring Weapons to School. Journal of Adolescent Health, 20, 261-270. http://dx.doi.org/10.1016/S1054-139X(96)00283-2
- Pengpid, S. and Peltzer, K. (2013) Bullying and Its Associated Factors among School-Aged Adolescents in Thailand. Scientific World Journal, 2013, Article ID 254083. http://dx.doi.org/10.1155/2013/254083
- Rudatsikira, E., Siziya, S., Kazembe, L.N. and Muula, A.S. (2007) Prevalence and Associated Factors of Physical Fighting among School-Going Adolescents in Namibia. Annals of General Psychiatry, 6, 18.
- Vital, E., Oliveira, R., do Céu Machado, M. and de Matos, M.G. (2011) Injuries and Risk-Taking Behaviours in Portuguese Adolescents: Highlights from the Health Behaviour in School-Aged Children Survey. Journal of Safety Research, 42, 327-331. http://dx.doi.org/10.1016/j.jsr.2011.06.009
- Siziya, S., Muula, A.S., Besa, C., Babaniyi, O., Songolo, P., Kankiza, N. and Rudatsikira, E. (2013) Cannabis Use and Its Socio-Demographic Correlates among In-School Adolescents in Zambia. Italian Journal of Pediatrics, 39, 13.
- Miller, T.R, Lestina, D.C. and Smith, G.S. (2001) Injury Risk among Medically Identified Alcohol and Drug Abusers. Alcoholism Clinical and Experimental Research, 25, 54-59. http://dx.doi.org/10.1111/j.1530-0277.2001.tb02127.x
- Cherpitel, C.J. (1999) Substance Use, Injury and Risk-Taking Dispositions in the General Population. Alcoholism Clinical and Experimental Research, 23, 121-126. Http://Dx.Doi.Org/10.1111/J.1530-0277.1999.Tb04032.X
- Li, Y., Jin, H., Owens, J.A. and Hu, C. (2008) The Association between Sleep and Injury among School-Aged Children in Rural China: A Case-Control Study. Sleep Medicine, 9, 142-148. http://dx.doi.org/10.1016/j.sleep.2007.01.018
- Stallones, L., Beseler, C. and Chen, P. (2006) Sleep Patterns and Risk of Injury among Adolescent Farm Residents. American Journal of Preventive Medicine, 30, 300-304. http://dx.doi.org/10.1016/j.amepre.2005.11.010
- Turner, C., McClure, R. and Pirozzo, S. (2004) Injury and Risk-Taking Behavior—A Systematic Review. Accident Analysis & Prevention, 36, 93-101. http://dx.doi.org/10.1016/S0001-4575(02)00131-8
- Peltzer, K. (2009) Health Behavior and Protective Factors among School Children in Four African Countries. International Journal of Behavioral Medicine, 16, 172-180. http://dx.doi.org/10.1007/s12529-008-9015-3
NOTES

*Corresponding author.