Open Journal of Civil Engineering
Vol.06 No.04(2016), Article ID:70612,18 pages
10.4236/ojce.2016.64048
Intersheet Distance Modeling and Thermal Characterization of New Micro/Nano-Composites Composed by Clay Matrix and PEG 6000 Addition
Iatimad Akhrif1, Mostapha El Jai2, Laila Mesrar1, Raouf Jabrane1
1Geosciences and Environment Laboratory, Faculty of Sciences and Techniques, Sidi Mohammed Ben Abdellah University, Fez, Morocco
2Advenced Materials & Applications Research Team, Ecole Nationale Supérieure d’ Arts & Métiers de Meknès, Moulay Ismail University, Meknes, Morocco

Copyright © 2016 by authors and Scientific Research Publishing Inc.
This work is licensed under the Creative Commons Attribution International License (CC BY 4.0).
http://creativecommons.org/licenses/by/4.0/


Received: June 1, 2016; Accepted: September 12, 2016; Published: September 16, 2016
ABSTRACT
Nowadays, the energetic efficiency becomes one of the major interests of the global society. Thus, the energetic challenges of the new century enforce the scientific and industrial environment to the development of new efficient materials, which present more than the classical thermal properties, according to the energy storage, energy consumption and other specific needs. In this context, the present work constitutes the third step of the development of a new kind of composite materials (micro- composites and nano-composites), using natural marl (clay) clay and biodegradable polymer, which is the PolyEthylene Glycol 6000 (PEG 6000). This step corresponds to characterization of the variation of the specific heat (denoted Cp) of the materials elaborated. So, in order to estimate the capacity of thermal energy adsorption, we utilized a SHIMATZU-DSC 60 Differential Scanning Calorimeter. The main results present the evolution of the Cp according to the PEG 6000 doping and also the specific melting enthalpy of the polymer within the natural clay matrix; by the way this enthalpy constitutes the specific heat stocked in the materials.
Keywords:
Kaolinite/Illite, Micro and Nanocomposite/Clay Matrix, Phase Chage Materials, PolyEthylene Glycol 6000 Thermal Analysis, DRX Characterization, Differential Scanning Calorimetery, Transformation Enthalpy, Latent Heat

1. Introduction
Recently, the Phase Change Materials (PCM) begin to constitute an important issue for the development of a new generation of construction materials. Several works essay to characterize the PCMs itself as the paraffin wax [1] - [3] , the mixture of several materials [4] , macro-incorporated into bricks or other construction materials [2] [5] [6] or micro-encapsulated within metallic shapes in order to stabilize the PCMs [7] .
The role of the encapsulation of the PCMs into construction materials permits an intelligent storage of energy within the bricks and the walls. The energy source could be natural as solar radiation or artificial as industrial furnace, etc. The energy is so stocked as a latent heat according to the melting temperature and the specific heat (capacity) of the PCMs materials.
In this work, we have incorporated the polyethylene glycol 6000 (PEG 6000) into a natural marl (clay) matrix, according to simple grinding and humid mixing techniques. We didn’t use any other artificial encapsulation. The aim is to exploit the energy storage of the polymer related to the endothermic transformations that occur in the neighborhood of the melting temperature, at approximately 60˚C.
Hence, at first, it is important to present the characteristics of the marl (clay) matrix used and the different microscopic or mesoscopic transformations that occur in the base material, according to the different elaboration parameters.
So, in order to define the clay material, it is essential to consider specific context or domain of work. For example, geologists define it as a dispersed granulated domain where the elementary particle has to be smaller than 2 µm [8] [9] . Weaver regroups all phyllosilicate minerals under a lager class, designated by “physils” without considering any size criteria [10] .
However, civil and geotechnical engineers are interested more by the macroscopic behavior expressed by the mechanical characteristics; such as the plasticity [11] , the elasticity and Young Modulus [12] , clay adsorption [13] [14] , etc.
The ceramists also have other interests; they classify these materials according to their allotropic transformations [15] [16] during the heat treatment, in order to optimize the ceramics production in industry.
A new tendency of the exploitation of this kind of materials, heat treated or not, wins more and more interests of construction industries, to replace classical building materials such as cement and concrete by the newest ones.
This interest is now boosted by the use of natural clay material which is abundant and considered as low-cost building material. But in another perspective, these materials could be concurrent to the classical construction materials [17] . The possibility of the consolidation of the clay with other ecological materials could affect greatly the mechanical and thermal properties of this latter.
Now, if some industries are interested in the production of construction bricks [17] , we are here interested in the fabrication of the same bricks. Indeed, we want to develop a new kind of coating which could be applied on the building surface in order to act on the thermal inertia and the thermal capacity of the walls.
Thus, the aim of this work is to characterize the new micro- & nano-composite composed by clay matrix and PEG 6000 reinforcement. This characterization is made by XRD analysis, DSC technique for thermal characterization, and some microscopy according to the SEM and the TEM techniques.
Some empiric models will be calculated in order to estimate the behavior of the characterized properties according to the PEG 6000 percentages.
2. Material and Methods
2.1. Presentation of the Row Clay Matrix
The samples by which we are interested correspond to Miocene clay which outcrops in the eastern area of Fez (Figure 1) at the Ben Jallik quarry [18] .
The importance of the clay-based materials in the ceramic industry is due to their plastic properties allowing final ceramic products to retain their shapes after firing [18] .
The XRD analysis permits to determine the major crystalline elements present in the clay.
Figure 2 presents the XRD peaks observed on the raw material. These peaks correspond to the Kaolinite, the Illite (mica), the quartz and Calcium Carbonate as major and apparent crystalline components.
According to [11] , the principal clay crystalline phases correspond to Kaolinite (K001 at 2θ = 12.3466˚) and Illite (I001 at 2θ = 8.7994˚) according to table 4 of the same ar-

Figure 1. Map of Fez-Taza region (Middle-North of Morocco) and the location of sampling expressed by the red star [18] .
 (a)
(a)
 (b)
(b)
Figure 2.Microscopic characterization of the row material [11] . (a) XRD spectrum of row clay material by SEM; (b) Visualizing the Kaolinite structure microscopy (30000×).
ticle. The other major components correspond to the quartz and to the calcite which are present at important percentages ( [11] and [19] ).
The corresponding peaks were designated according to the classical works of [8] [20] [21] .
In [11] , we reported a SEM microscopy of the row material, where the detection of the Kaolinite structure was possible, presenting as a helical shape (Figure 2(b)) and (Figure 3(a)). Figure 3(c) present the TEM microscopy we made in the same characterization.
2.2. Presentation of the Polyethylene Glycol 6000
The choice of the PEG 6000 was performed firstly because of it is considered as an ecological polymer [22] , secondly according to its hydrophilic property [23] [24] . Thus we will not need other chemical solvent to destroy the links existing between the monomers chains in order to increase the entropy of the system. Distilled (purified) water can ensure this role, and the ecological constraint will be respected as well.
Another reason to choose PEG 6000 is the testing of the effect of a nonionic polymer on the nanoclay intersheet spaces, such as the PEG 6000 molecules in solution. If the results are reasonable and sufficient, we can after adopt other polymers (or other PolyEthylene Oxides or Glycol) for the specific application.
The Polyethylene Oxide is a non-ionic hydro-soluble synthetic polymer [23] [25] . Its chemical structure is ?(CH2-CH2-O-)n and it is the simplest hydro-soluble synthetic polymer that exists [23] . According to its molar mole, the polyethylene Oxide is designated by poly (ethylene glycol) (Mm < 20000 g∙mol−1) [23] .
 (a) (b)
 (c)
(c)
Figure 3. Microscopic characterization of the row material using TEM Microscopy and the corresponding EDS spectrum.
The PEGs have a high rate of crystalline phases and present interested hydro-dy- namic and flocculation properties. So it could be a good initial candidate, because of the important entropy which has to be furnished to the system {clay, polymer, water} at the stage of the elaboration in aqueous milieu. Due also to its low viscosity [23] , the mutual friction between molecules will be low; we estimate so that it is our first preferred candidate to test the acceptance of the Polymer by the clay intersheet space.
According to these advantages, hydro-solubility, hydrodynamic, non-ionic (mechanical intercalation), lower viscosity, ecologic and biodegradable, low cost (50 $/Kg), etc., we tempt to elaborate low cost and ecological micro-composites and after nanocomposites dedicated for research and industrial uses.
2.3. Elaboration Methods
Starting from the objective of making new material by a lowest cost, we have adopted classical methods by some little modifications.
The first elaboration method, related to the production of the micro-composites, corresponds to a simple grinding and classical mixing in water solution, as described in previous articles [11] [26] .
The second protocol by which we were able to produce the nano-composites is described in the article [26] . It corresponds to aqueous mixing of the material by a corresponding methodology.
We designate the resulting materials as nano-composites according to the results found by the DRX techniques and other Methylene blue protocol, which indicated that the saturation of the resulting clay by the Methylene Blue depends really on the percentages of the added polymer [11] [26] .
The micro-composite, result of the grinding dry method, presents a saturation level (by Methylene Blue) of the clay as constant. So no modification of the nanostructure occurs for the micro-composites [11] .
For each protocol, we adopted a variable quantity of PEG 6000, starting from 0.1 g PEG 6000 per 6 g of clay to 0.6 g per 6 g of clay, with a constant step of 0.1 g per 6g of clay.
We are presenting in the next sections the results of the corresponding XRD analysis especially the intersheet distance evolution and the thermal capacity evolution according to the elaboration parameters (elaboration methods and polymer quantity).
3. Results and Discussion
3.1. XRD Results and the Intersheet Distance Modeling
3.1.1. Polynomial Modeling of the Intersheet Distance of the Minerals
According to the results found in [26] , it is the humid method (in aqueous milieu) that affects the intersheet distance (see Figure 4 below). Nevertheless, by the dry grinding method the intersheet distance remains constant.
The XRD analysis were performed using the X’Pert PRO PANalytical, operating at 45 kV and 40 mA using Cu-Kα monochromatic radiation (λ = 1.54 Å).

Figure 4. XRD spectra superposition related to the different PEG 6000 percentages [26] .
So in this paragraph we present the modeling of the intersheet distance of the two corresponding minerals, Kaolinite and Illite, according to the PEG 6000 percentages. For that purpose, we recall that we made three measurements by each sample to ensure the repetitiveness of the results. The modeling uses the polynomial Lagrange interpolation.
In Figure 4, we report the superposition of the different XRD spectra according to the adopted PEG percentages [26] .
At the first time, we adopted a fitting by 6 degrees polynomial (7 experimental points). This higher degree of freedom makes the polynomial vary intensively and the behavior model does not fit to the experimental evolution. Thus, we decrease the freedom of the fitted polynomial by using a 5 degree one.
The calculations were performed by modeling toolbox of Matlab Software.
Figure 5 shows the evolution of the intersheet distance of the Illite according to the PEG 6000 percentages; and Figure 6 presents the results related to the Kaolinite phase.
The experiments distance values of the intersheet distances are represented by the little blue circles. The green line corresponds to the Lagrange polynomial fitting (top figures of Figure 5 and Figure 6).
Knowing that the only polynomial that will not present modeling error is that one which has 6 degrees, so the polynomial adopted here, having 5 degrees, presents normally a corresponding modeling error. So we estimate the corresponding quadratic error using the formulation of the Equation (1):
 (1)
(1)
where d001i: is the experimental distance of Kaolinite or Illite Pi(x): estimated distance using the 5 degree fitting polynomials of each mineral phase.

Figure 5. Intersheet distance (Å) evolution of the Illite (blue lines in the top figures) and the corresponding models (green line in the top figures and down figure).
The calculation of this quadratic error for the 3 samples related to Illite and Kaolinite are presented by the system (2):
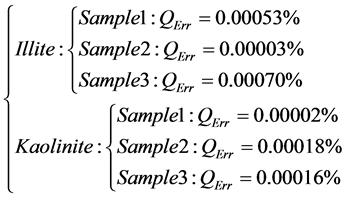 (2)
(2)
We observe that the values of the quadratic errors are negligible. So we validate the polynomial fitting related to the two minerals.
For the two minerals, Kaolinite and Illite, we observe that there is a critical polymer value related to the evolution of the intersheet distance. In this case, this value corresponds to (the neighborhood of) 0.4 g of PEG 6000/6g of clay.

Figure 6. Intersheet distance (Å) evolution of the Kaolinite (blue lines in the top figures) and the corresponding models (green line in the top figures and down figure)
3.1.2. Thermodynamical Interpretation [26]
The intercalation of a polymer in the silicates was explained according to thermodynamics by [27] , according to which a nano-composite could be formed if the Gibbs enthalpy , during the formation process is negative. The Gibbs enthalpy variation is defined by:
 , where
  is the enthalpy variation, which expresses the intermolecular interactions, and ΔS is the entropy variation, associated with the configuration variations of the system.
Starting from the above relation, Giannelis proved that the loss of entropy at the separation of some parties of the polymer within the nanoclay sheets is approximately compensated by a gain of entropy. This phenomenon is due to the increasing of the formation freedom of the organic molecules intercalated, which are liberated on the stage of intercalation.
In consequence, the Gibbs enthalpy determines whether the intercalation takes place or not. Hence, we can interpret the enthalpy by the existence of interactions between the polymer and the nanoclay sheets.
So, the intercalation ( ) is determined according to the nature of the forces that exist in the neighborhood of what we can call the effective molecule:
- repulsive force between the excluded volume of the nanoclay layers (positive energy),
- low attraction due to the Van Der Waals effects (negative energy),
- Depletion forces due to the intercalation of the polymer into the nanoclay layers (positive energy).
3.2. Thermal Characterization
3.2.1. Thermal Analysis of the Row PEG 6000
Thermal capacity expresses the energy to be absorbed by a substance before the measurement of the first thermal macroscopic effect, corresponding to the increasing of the corresponding temperature by 1 degree.
It is a kind of threshold that permits to estimate the maximum thermal energy absorption of the materials; so greater the thermal capacity is, greater could be the storage of energy and lower is the evolution (increasing) of the temperature.
Figure 7 presents the evolution of the specific (mass) power absorbed by the pure PEG 6000.
1) Estimation of the heat capacity and the melting temperature
Related to the behavior of the curve, the concavity of the curve, at the left side, shows that the melting point corresponds to the endothermic peak [28] .
This temperature is approximately 63.29˚C. The bibliography gives a very near value, in the neighborhood of 60˚C [23] .
For the specific heat capacity could be approximated by equation (3):
 (3)
(3)
where:  is the specific thermal power measured by the experience; (˚K/min) is the heat ratio, in this case equal to 30˚K/min

Figure 7. Specific power (mW/mg) spectrum of pure PEG 6000 on the interval of temperature [20˚C, 140˚C].
The calculation gives:
 (3')
(3')
The melting specific energy (enthalpy per mass unit) could be calculated by equation (2):
 (4)
(4)
where:  the approximated interval of time corresponding to the starting and ending of the melt transformation.
But since the results are given in discrete form, we cannot calculate the entropy of the transformation directly; we have to estimate it according to Gauss integral, according to Equation (3):
 (5)
(5)
where  is the discretization step of the time axle, equal to 1 s;
And  is the thermal power measured by the equipment at each time step
  in Figure 8.
After calculation we estimate the melting entropy at:
 (5')
(5')
2) Estimation of the glass transition
The previous curve, expressing the specific power of the PEG 6000, permits also to estimate the glass transition of this polymer.
For this purpose, it is an obligation to estimate the area (temperature intervals) which corresponds to the glass transition according to the tangents, calculated and plotted at Figure 9 (red and black lines).
Thus, the Tg temperature is estimated at 35.31˚C, related to a specific heat equal to 0.406 mW/mg.

Figure 8. Melting heat approximated.

Figure 9. Estimation of the glass transition point (blue star).
3.2.2. Thermal Analysis of the Clay Material
Figure 10 shows the DSC analysis of the natural clay used.
Concerning the values of the specific heat Cp, we can see that it value is not constant. So we decided to zoom on the temperature range by which we are interested for the use of the material; let’s take the interval [30˚C, 60˚C]. Figure 11 presents a localization of the DSC curve on the temperature range adopted.
We see that the specific heat varies linearly according to the temperature. We model this variation by Equation (4), obtained by linear regression.
 (6)
(6)
With the linear correlation coefficient equal to R² = 0.9966.
As a non-rigorous approximation, we can adopt an average value of the Cp on this interval. After calculation we find:
 (7)
(7)
It is a reasonable value according to [29] .
Figure 10 shows also an endothermic peak; the maximum of power is denoted at the neighborhood of 140˚C.
According to [28] , this peak corresponds to the dehydration of the clay. The corresponding specific enthalpy is estimated at (red area of Figure 10):
 (8)
(8)
3.2.3. Thermal Analysis of the Composites Samples
Figure 10 presents the plot of the “specific power VS temperature” curves related to the DSC analysis of the samples.
1) Endothermic peaks evolution
According to the different samples, we observe that the appearance of the endothermic peak evolutes greatly according to the PEG 6000 addition:

Figure 10. DSC of the row material (marl).

Figure 11. DSC curve at the interval [30˚C, 60˚C].
- For example, for the superior green curve, related to an addition of 0.1 g of PEG 6000 per 6 g clay, the endothermic peak does not exist; the polymer does not affect the macroscopic thermal behavior of the composite.
- For 0.2 g of PEG 6000, the endothermic peak appears for the first time in two different regions: the melting of the polymer occurs two times. It could be caused by a worse dispersion of the polymer into the clay matrix, or by a local melting at 54˚C, re-crystallization at 58˚C and another melting at 60.5˚C. This phenomenon could exist related to the low value of PEG 6000 which is very affected by the heating. Another supposition corresponds to the disintegration of the polymer at the second peak.
- Other values of PEG 6000 present also the same behavior, according to 0.4 g and 0.6 g of PEG 6000.
- For 0.3 g and 0.6 g of polymer per 6 g of clay, unique endothermic peak appears clearly for each sample.
Related to these results and from this qualitative analysis, it is important to quantify the difference between the materials from an energetic perspective.
The consumption of the power increases according to the polymer addition. This is due to the energy necessary for the melting of the polymer (kinetic energy of the polymer’s molecules to move according to the degree of freedom of the particles).
In the next paragraph we estimate the specific (mass) heat necessary for the polymer melting into the clay matrix.
2) Melting enthalpy of the PEG 6000 within the materials
The blue circles of Figure 12 presents the evolution of the specific enthalpy consummated at the melting of the PEG 6000 into the clay matrices, estimating by the Gauss sum, according to Equation (5).
We remark that the evolution of the specific enthalpy values (blue circles) could be approximated as linear or as exponential according to the polymer doping; that is why we decide to calculate the models, by regression technique and to adopt the best one according to the linear correlation coefficient R2.
The linear model is given by Equation (9) and exponential model is given by Equation (10):

Figure 12. Evolution of the specific melting enthalpy of PEG 6000 within the clay matrix.
 (9)
(9)

 (10)
(10)

where .
.
It is clear now that the linear model is the best one where the .
.
This result is in great concordance with the mixture model which predicts linear variation of the enthalpy of a composite material (and liquid substances also), depending on the enthalpies of the constituted elements. In the same direction, the mixture model predicts also the linearity of the variation of the specific heat according to the variation of the proportion of each component.
Thus, the results found correspond totally with the mixture model.
3) Modeling the specific heat variation of the new composites
In Figure 13, we observe that the heat exchanged by the composite samples do not stabilize on the expected temperatures interval of working of these materials; for this case [30˚C, 60˚C].
This unstable variation corresponds so to the heat exchanged by the portion of the clay matrix, according to the behavior of the pure clay, reported on Figure 10 and Figure 11.
We report, in Table 1, the variation of the specific heat ΔCp (mJ∙mg−1∙K−1) of each material on the temperature interval of [30˚C, 60˚C].
Consequently, it is not possible on this stage to present a characteristic value of the specific heat Cp independently temperature.

Figure 13. DSC curves of the samples.

Table 1. Specific heat variation models of the samples on the interval [30˚C, 60˚C].
4. Conclusions
As it is mentioned in the introduction, the main goal of our research is to develop new ecological and low cost materials for construction industry, bricks fabrication, natural insulation coating, etc.
To achieve this objective, we adopted local marl mixed by the PEG 6000.
The XRD analysis proved some microscopic evolution of the materials elaborated with humid mixing, instead those elaborated by dry grinding technique. We recall that the elaboration protocols are detailed in [11] [26] .
But as a contradiction with our expectation, the most important changes of the thermal properties occur for the sample made by the grinding dry method, where the thermal behavior of the polymer (PEG 6000) appears clearly starting from a concentration of 0.2 mg PEG per 6 mg of clay.
For the samples elaborated by the humid mixing method, we denote very little changes: the materials remain approximately similar to the row clay. We do explain this result by the fact that the polymer chains have been intercalated into the nanoclay sheets and by the way, the effect of the heating on the PEG 6000 decreases according to this nanometric transformations.
Now, since we are interested in the energy storage and/or restitution, we can see that the incorporation of the PEG 6000 (at a mesoscopic scale, by grinding method) allows absorbing significant thermal energy as melting enthalpy. Thus, we expect that the microscopic modifications will occur at higher temperatures.
This energy can be restituted after at the stage of crystallization of the polymer under 60˚C.
The results found prove that the incorporation of the PEG 6000 into clay bricks could work as Phase Changing Materials, but at microscopic scale.
The interesting think here is that the polymer is totally mixed by the clay, and we do not have to create macroscopic alveolus forms at bricks processing (cost minimization).
As perspective, it would be interested to make more thermal analyses in order to characterize the material at the cooling cycle and to understand more the step of recrystallizatoin of the polymer within the natural clay matrix.
Cite this paper
Akhrif, I., El Jai, M., Mesrar, L. and Jabrane, R. (2016) Intersheet Distance Modeling and Thermal Characterization of New Micro/Nano-Compo- sites Composed by Clay Matrix and PEG 6000 Addition. Open Journal of Civil Engineering, 6, 577-594. http://dx.doi.org/10.4236/ojce.2016.64048
References
- 1. Goia, F. and Boccaleri, E. (2016) Physical-Chemical Properties Evolution and Thermal Properties Reliability of a Paraffin Wax under Solar Radiation Exposure in Areal-Scale PCM Window System. Energy and Buildings, 119, 41-50.
http://dx.doi.org/10.1016/j.enbuild.2016.03.007 - 2. Sobolciak, P., Abdelrazeq, H., Özerkan, N.G., Ouederni, M., Nógellová, Z., AlMaadeed, M.A., Karkri, M. and Krupa, I. (2016) Heat Transfer Performance of Paraffin Wax Based Phase Change Materials Applicable in Building Industry. Applied Thermal Engineering, 107, 1313-1323.
- 3. Zhou D., Tian, Y., Qu, Y. and Chen, Y.K. (2016) Thermal Analysis of Phase Change Material Board (PCMB) under Weather Conditions in the Summer. Applied Thermal Engineering, 99, 690-702.
http://dx.doi.org/10.1016/j.applthermaleng.2016.01.121 - 4. Patrik, S., Karkri, M., Al-Maadeed, M.A. and Krupa, I. (2016) Thermal Characterization of Phase Change Materials Based on Linear Low-Density Polyethylene, Paraffin Wax and Expanded Graphite. Renewable Energy, 88, 372-382.
http://dx.doi.org/10.1016/j.renene.2015.11.056 - 5. Alawadhi, E.M. (2008) Thermal Analysis of a Building Brick Containing Phase Change Material. Energy and Buildings, 40, 351-357.
- 6. Khedache, S., Makhlouf, S., Djefel, D., Lefebvre, G. and Royon, L. (2015) Preparation and Thermal Characterization of Composite “Paraffin/Red Brick” as a Novel Form-Stable of Phase Change Material for Thermal Energy Storage. International Journal of Hydrogen Energy, 40, 13771-13776.
- 7. Lei, L., Tang, F. and Fang, G.Y. (2014) Synthesis and Characterization of Microencapsulated Paraffin with Titanium Dioxide Shell as Shape-Stabilized Thermal Energy Storage Materials in Buildings. Energy and Buildings, 72, 31-37.
http://dx.doi.org/10.1016/j.enbuild.2013.12.028 - 8. Da Silva Favero, J., Parisotto-Paterle, J., Weiss-Angeli, V., Brandalise, R.N., Gomes, L.B., Bergmann, C.P. and dos Santos, V. (2016) Physical and Chemical Characterization and Method for the Decontamination of Clays for Application in Cosmetics. Applied Clay Science, 124-125, 252-259.
- 9. Eslinger, E. and Peaver, D. (1988) Clay Minerals for Petroleum Geologists and Engineers. SEPM Short Course Notes n° 22, ix + 405 pp. Society of Economic Paleontologists and Mineralogists, Tulsa.
- 10. Weaver, C.E. (1989) Clays, Muds and Shales. Developments in Sedimentology, 44, 1-5.
- 11. Akhrif, I., El Jai, M., Mesrar, L., Elkhalfi, A., Touache, A. and Jabrane, R. (2014) Physical Characterization and Elaboration Discussion of a Clay-PEG 6000 Composite with Natural Clay Matrix. Engineering, 6, 338-354.
http://dx.doi.org/10.4236/eng.2014.67037 - 12. Kool, A., Thakur, P., Bagchi, B., Hoque, N.A. and Das, S. (2015) Mechanical, Dielectric and Photoluminescence Properties of Alumina—Mullite Composite Derived from Natural Ganges Clay. Applied Clay Science, 114, 349-358.
http://dx.doi.org/10.1016/j.clay.2015.06.021 - 13. Santamarina, J.C., Klein, Y.H. and Prencke, E. (2002) Specific Surface: Determination and Relevance. Canadian Geotechnical Journal, 39, 233-241.
http://dx.doi.org/10.1139/t01-077 - 14. Hang, P.T. and Brindley, G.W. (1970) Methylene Blue Absorption by Clay minerals. Determination of Surface Areas and Cation Exchange Capacities (Clay-Organic Studies XVIII). Clays and Clay Minerals, 18, 203-212.
http://dx.doi.org/10.1346/CCMN.1970.0180404 - 15. McKenzie, D. (1985) The Extraction of Magma from the Crust and Mantle. Earth and Planetary Science Letters, 74, 81-91.
http://dx.doi.org/10.1016/0012-821X(85)90168-2 - 16. Aurélie, M. (2008) Caractéristiques thermophysiques de matériaux à base d'argile: Evolution avec des traitements thermiques jusqu'à 1400°C. Thèse Doctorat de l’Université de Limoge, Limoge.
- 17. ARGIO Bricks-TERRACOGROUP SA (2013) Technical Note of the New ARGIO CLEVER BRICK.
- 18. Laila, M., Akhrif, I. and Raouf, J. (2014) Study of MnO2 Doping Effect on the Miocene Clays in the Region of Taza (Morocco). Journal of Engineering and Interdisciplinary Research, 1, 18-23.
- 19. Laila, M. (2013) Geotechnical, Mineral and Technical Characterization of the Miocene Marls of the South Riffan (Taza-Fez): Study and Consolidation. Sciences and Techniques PhD Dissertation, Sidi Mohamed Ben Abdellah University, Morocco.
- 20. Biscaye, P.E. (1964) Distinction between Kaolinite and Chlorite in Recent Sediments by X-Ray Diffraction. The Amercian Mineralogist, 49, 1281-1289.
- 21. Eric, N. and Crescent, E. (1964) Reduction of Orientation Effects in the Quantitative X-Ray Diffraction Analysis of Kaolin Minerals. The American Mineralogist, 49, 705-714.
- 22. Sarier, N. and Onder, E. (2010) Organic Modification of Montmorillonite with Low Molecular Weight Polyethylene Glycols and Its Use in Polyurethane Nanocomposite Foams. Thermochimica Acta, 510, 113-121.
http://dx.doi.org/10.1016/j.tca.2010.07.004 - 23. SAFC Biosciences (2006) Protein Purification Techniques. Vol. 2, Nonionic Precepitation, Technical Bulletin.
- 24. Lee, H., Venable, R.M., Mackerell Jr., A.D. and Pastor, R.W. (2008) Molecular Dynamics Studies of Polyethylene Oxide and Polyethylene Glycol: Hydrodynamic Radius and Shape Anisotropy. Biophysical Journal, 95, 1590-1599.
http://dx.doi.org/10.1529/biophysj.108.133025 - 25. Harrison, R.G. (1993) Protein Purification Process Engineering. Marcel Dekker, New York, 115-208.
- 26. Akhrif, L., Mesrar, L., El Jai, M., Benhamou, M. and Jabrane, R. (2015) Elaboration and X-Ray Diffraction Techniques Characterization of Nanocomposites Clay-PEG 6000 with Clay Matrix. International Journal of Multidisciplinary and Current Research, 3, 564-671.
- 27. Giannelis, E.P. (1998) Polymer-Layered Silicate Nanocomposites: Synthesis, Properties and Applications. Applied Organometallic Chemistry, 12, 675-680.
http://dx.doi.org/10.1002/(SICI)1099-0739(199810/11)12:10/11<675::AID-AOC779>3.0.CO;2-V - 28. Mettler-Toledo (2009/2010) Flash Differential Scanning Calorimetry for Research and Development. Mettler-Toledo AG, Analytical, Suisse.
- 29. Eppelbaum, L., Kutasov, I. and Pilchin, A. (2014) Applied Geothermics. Lecture Notes in Earth System Sciences, Springer-Verlag, Berlin.
http://dx.doi.org/10.1007/978-3-642-34023-9