Open Journal of Civil Engineering
Vol.4 No.3(2014), Article ID:49798,15 pages
DOI:10.4236/ojce.2014.43021
Pedestrian Crash Prediction Models and Validation of Effective Factors on Their Safety (Case Study: Tehran Signalized Intersections)
Pegah Jafari Haghighatpour1*, Reza Moayedfar2
1Master of Science, Department of Engineering, Islamic Azad University South Tehran Branch, Tehran, Iran
2Department of Engineering, Arak University, Iran
Email: *st_p_jafari@azad.ac.ir, r-moayedfar@araku.ac.ir
Copyright © 2014 by authors and Scientific Research Publishing Inc.
This work is licensed under the Creative Commons Attribution International License (CC BY).
http://creativecommons.org/licenses/by/4.0/


Received 7 July 2014; revised 27 July 2014; accepted 29 August 2014
ABSTRACT
The quantity and severity of traffic accidents have increased with the development of machinery life and traffic growth in cities and roads in the past 50 years. Among the road users, pedestrians are the most vulnerable groups to be exposed to high risks. Vehicle crashes with pedestrian are almost inevitable and cause injury or death to pedestrian. Crash investigation and statistical studies indicate that percentage of pedestrian deaths caused by vehicle accidents are much more than all deaths. A considerable amount of accidents occur at signalized and urban intersections which are the intensive crash places. Therefore in this paper appropriate models that could specify safety indicators have been indicated with existing information by characterized parametric and nonparametric variables for twenty signalized intersections. Categories and correlations of variables also have been investigated. Three models including Regression, Poisson, and Negative binomial with defined variables have been determined. T and chi square tests, calibration and comparison of variables have been done by curve fitting. The role of each parameter was specified in pedestrian crashes. Validating models had the following outcomes: Pedestrian crash prediction models were based on none linear relations at intersections. Predictable variables, developing extended linear models and also pedestrian crash prediction are on the basis of Negative binomial distribution which is used due to more data dispersion. As observed, the Negative binomial regression because of its more R2 correlation factor has more validity among other regression models such as linear regression and Poisson. Calibrated models are put into sensitivity analysis to study the effect of each previously mentioned parameter in overall performance. Hence much better perception of future transportation plans can be achieved by development of safety models at planning levels.
Keywords: Crash Prediction Models, Pedestrian, Sensitivity Analysis, Signalized Intersection, Validation

1. Introduction
Depending on accidents, they may have different causes. Eliminating the risk of each cause requires separate solutions. Intersections safety has always been the main purpose of planning and transportation due to special importance and role of intersections in street network. Important priority of decision is to reduce the number of pedestrian accidents at intersections. Pedestrian crashes and activities depend on demographic, land use, road network, geometric and transit characteristics. An increase in demographic and socio-economic characteristics such as population, household units, and total employment within walking distance of an intersection may increase pedestrian volume and the number of pedestrian crashes at intersection. While an increase in mean income level within the same area may result in a decrease (or sometimes increase) in pedestrian volume and the number of pedestrian crashes at the intersection. Pedestrian volume and pedestrian crashes could also depend on land use characteristics within the walking distance of an intersection. People living in apartments may walk more than those living in residential neighborhoods, or vice versa. Likewise, an increase in street width (or the number of lanes); speed limit, traffic volume, and the number of transit stops within the vicinity of an intersection may increase pedestrian exposure to risk and crashes at the intersection. Therefore, data pertaining to these characteristics are required for developing and assessing pedestrian crash estimation models [1] .
Research on the feasibility of modeling crash counts at intersections as a function of traffic volume and other variables has been ongoing for over a decade. Example efforts in the 1990s include modeling intersection crash counts by [2] . Some examples of recent efforts include forecasting crashes at the planning level and crash prediction modeling in New Zealand and Australia. Research has also been undertaken to understand pedestrian safety problems and estimate risk to pedestrians. Brude and Larsson studied the effect of pedestrian and traffic volumes on pedestrian crashes at intersections (121 signalized, 155 unsignalized, and 9 roundabouts) in Sweden. They found that pedestrian volume had a significant and positive relationship to pedestrian crashes in a single predictive model that covered all intersection types [3] . Huang et al. proposed a Full Bayes (FB) modeling approach to account for heterogeneities of crash occurrence due to spatio-temporal effects on traffic safety; an empirical evaluation was conducted to compare the proposed FB method to the state-of-art approaches. Results showed that Bayesian hierarchical models with accommodation for site specific effect and serial correlation have better goodness of fit than non-hierarchical models [4] . Lyon and Persaud used data from Toronto, Canada in the development of pedestrian crash prediction models using pedestrian and vehicular volumes and vehicular volumes only for three and Four-legged urban intersections, with and without signal control. It was observed that the use of pedestrian volume information results in a much richer model, emphasizing the importance of collecting this information in routine traffic counting programs [5] . Wier et al. discussed multivariate regression models using data for 176 census tracks in San Francisco, California and 5 years worth of crash data. The study found that traffic volume, arterial streets without public transit, proportion of land area zoned for neighborhood commercial use and residential-neighborhood commercial use, employment, resident population, and population below poverty level have a positive correlation while the proportion of people aged 65 and over have a negative correlation with pedestrian crashes [6] . Torbic et al. developed a methodology to quantify pedestrian safety effects related to existing site characteristics or proposed improvements on urban and suburban arterials. The methodology included base models for threeand four-legged Signalized intersections and several accident modification factors (AMFs). The study found that daily pedestrian crossing volume has a statistically significant relationship to vehicle-pedestrian crashes at signalized intersections [7] . Lee based on models developed using data for two hundred signalized intersections in Washington DC, reported that pedestrian volume and vehicular volume are two strong predictor variables that can be used to estimate pedestrian Crashes [8] . Elvik found that the total number of pedestrian crashes could go down if a substantial share of trips by motorized travel were transferred to walking or cycling. The effect depends strongly on the degree of non-linearity of risk [9] . Harwood et al. suggested that the relationship between the number of pedestrian crashes and the vehicular volume and pedestrian traffic are not altered when other variables such as the Proximity to a school, the presence of a bus stop or the presence of an alcohol sales establishment is included in a model. The role of demographic characteristics, socio-economic characteristics, land use characteristics, road network characteristics and the presence of transit stops on pedestrian crashes was not examined and used in pedestrian crash estimation models for signalized intersections [10] . Those that examined did not consider site specific data or the effect of spatial proximity (or buffer width) to extract demographic characteristics, socio-economic characteristics, and land use characteristics in estimating pedestrian crashes. So considering these variables and examining the effects would help to make better transportation planning and land use decisions. Field of study has been considered as Tehran in this article. Tehran is one of the major and Sixteenth cumulated cities with a density of about eleven thousand square kilometers in the world. Large population and the high volume of vehicle traffic have increased the number of traffic accidents in Tehran. Period studied according to the existing information in police statistics collection system and traffic Studies has been considered from 2012 to 2013 in this paper. During these years according to traffic police statistics, about 17.3 percent of the total 648,615 traffic accident has occurred at the intersection of Tehran. Assuming that the occurred accident at Tehran Intersection is independent and the number of accidents is discrete, non-negative and integer variable and also considering that the information in the traffic police crashes database and traffic studies Company are correct and free of errors, 20 intersections have been investigated by using linear regression, Poisson and negative binomial methods for the period of two years.16 intersections data is used in Statistical models. These intersections include Beheshti-Sohrevardi, Jannat Abad-Iran’s Pars (niayesh), Keshavarz-Jamalzadeh, modiriat (darya)-Saadat Abad, Shaghayegh-Ferdos, Taleghani-Bahar, Aboozar-Aemmeye Athar, Africa-Haghani (Jahan koodak), Beheshti-Ghaem Magham, BeheshtiMirza Shirazi, Emam Khomeini-Khosh, Farahzad-Darya, Farjam-Nirooye Daryaee, Felestin-Keshavarz, Karim Khan-Hafez, Motahari-Ghaem Magham. However, the article introduces 3 intersections of 20 intersections used in the statistical models including Beheshti-Sohrevardi, Taleghani-Shariati, Nabard-Aemmeye Athar. The modeling of pedestrian crashes have been done at 16 intersections then curve fitting and statistical tests have validated by using data’s from four intersections comprising Taleghani-Shariati, Motahari-Sohrevardi, sardar E Jangal-Golestan, Nabard-Aemmeye Athar. Moreover impact of each factor on the number of crashes has been investigated. It is considerable that SPSS 18 software is used in the data analysis.
2. Type of Pedestrian Crashes
The pedestrian route is cut off when the vehicle is turning approximately. 32.2% of all pedestrian crashes of this type and over 50% of these accidents occur at intersections. Also 22% of crashes occur when the driver visibility before intersection has been limited. 16% of accidents due to driver violation from right of way. 26.5% of all pedestrian crashes are vehicle accident with a pedestrian crossing the street except through the intersection. 32% of accidents are while the driver has enough visibility and pedestrian quickly ran to the street. 72% of pedestrian’s crash is occurred in the vehicle-pedestrian collisions when the vehicles moving in reverse gear [11] .
3. Methodology
The model represents reality to understand how the system behaves in different situations, which impossible to use in practical experience. Models are divided into three groups including Description, prediction and planning in transportation issues. The descriptive models have scientific value and ability to simulate in future and planning models used results of the predicted models to achieve specific goals. The aim of this study is to select the best model for predicting pedestrian crashes at intersections and determining effective factors on them. Scatter plots and preliminary statistical tests indicated that the relationship between pedestrian crashes and predictor variables are non-linear in nature. Non-linear relationships based on Poisson distribution, negative binomial distribution, and lognormal distributions as well as zero-inflated model were tested to identify the best model that can explain the relationship between pedestrian crashes and the selected predictor variables. Also the incremental model has been tested to identify the best model that could elaborate the relationship between pedestrian crashes and selected predictor variables. Pedestrian crash estimation models based on statistical analysis software (SPSS, 18) was used to develop the models in this study. As a first step, effective factors are evaluated in accident and predictive Variable with good correlation was used to develop a pedestrian crash estimation models for close range intersections. The significance level for each selected predictor variable has been investigated. Variables which their Significance level was greater than 0.5 play an important role in the estimation of pedestrian crashes in 95% confidence interval. Independent variables such as demographic, socio-economic, land use characteristics that crash prediction are related to them can be used to assess the relevance of pedestrian crashes and pedestrian crash prediction models developed by the spatial proximity and function level. However, because the collection of this information in the database is very difficult in Tehran and there is no organization to provide such information to us. Or if there is, unfortunately these data are not available to students. Therefore, some of the effective parameters information in crash prediction model that have been obtained by comprehensive studies company be investigated in this paper. The methodology involves the following steps:
1) Identify study intersections.
2) Identify data elements.
3) Identify the number of pedestrian crashes as the predicted variable which dependent to other characteristics.
4) Extract incoming vehicles volume on the main and secondary routs.
5) Extract the number of transit stops and schools within the vicinity of intersections.
6) Extract the number of lanes at main and auxiliary road, Area traffic plan, Type of signal, one way streets, Intersection’s angle and pedestrian volume.
7) Examine correlation between the predictor variables.
8) Develop pedestrian crash estimation models.
3.1. Identify Study Intersections and Data Elements
Examining Beheshti-Sohrevardi, Taleghani-Shariati, Nabard-Aemmeye Athar intersections from investigated Tehran 20 intersections in statistical models to develop pedestrian crash prediction models have been selected in this paper. Demographic, socio-economic, land use, road network and transit characteristics in the vicinity of these signalized intersections should represent typical characteristics of an urban area. Pedestrian crashes and activity depends on demographic, socio-economic, land use, road network and transit characteristics. An increase in demographic and socio-economic characteristics such as population, household units, and total employment within walking distance of an intersection may increase pedestrian volume and the number of pedestrian crashes at the intersection. It is noteworthy that to calculate and consider these parameters some limits should be specified. This requires geographical surveys, census studies and etc but the possibility of such study does not exist in this paper. Only Several factors in crashes such as incoming vehicles volume on the main and secondary routs, the number of transit stops and schools within the vicinity of intersections, the number of lanes at main and auxiliary road, area traffic plan, type of signal, one way streets, intersection’s angle and pedestrian volume can be addressed. The average number of pedestrian crashes as the dependent variable is used to develop pedestrian crash estimation models at intersections. Pedestrian crashes data to extract pedestrian crashes have been covered around the intersection for two-year period.
3.2. Extract Incoming Vehicles Volume on the Main and Secondary Routs
Traffic volume is important variables in occurring crashes at intersections. Research also indicates that with increasing incoming vehicle volume, the number of accidents increases at intersection. Pickering knows traffic volume is one of the main parameters in his research [12] . It is notable that for every 10,000 vehicles per day, the number of crashes between 15 to 20 percent increase but in high volume the percentage decreases. The number of crashes depend on incoming traffic volume on the main and secondary routs. This parameter is independent that the number of pedestrian crashes depends on it.
3.3. Extract the Number of Transit Stops and Schools within the Vicinity of Intersections
People generally walk or use bicycle to achieve the public transportation system (bus) from its location in the vicinity of the intersection. To study these affects, the number of public transportation stations identified from intersections and consider in pedestrian crash estimation model. In addition pedestrians that cross intersections to go to school are effective in the number of crashes. This parameter is also independent of the parameters.
3.4. Extract the Number of Lanes at Main and Auxiliary Road, Area Traffic Plan, Type of Signal, One Way Streets, Intersection’s Angle and Pedestrian Volume
All the factors mentioned in the caption are independent parameters and affecting on pedestrian crashes. For example, the slope of intersections is the point that in collisions between vehicles and pedestrians creates incident point for road users. So intersection entrance ramp should give the possibility to driver that do necessary movement with complete visibility, enough safety and minimal collision with others to cross through intersections. Streets along at intersection should somewhat direct and have less slope. Optimum angle of intersection is 90 degree or near it due to intersections safety and economic issues. Intersection with inclined angle requires a greater level and especially reduces visibility for truck drivers. Also vehicles will require a lot of space for turning left or right. Traffic signals are used to control traffic separation and different traffic flow improvement at the intersections. Drivers increase speeds to cross the intersection on the final green times and suddenly stop when traffic signal is red. Also pedestrian volume has been done in main and secondary routes during the 15- minute study.
4. Statistical Properties of the Intersections
4.1. Sohrevardi-Beheshti Intersection
Beheshti Avenue is one-way and has 5 lanes in each direction and Sohrevardi Avenue is bilateral and has 3 lanes in each direction also there is a left turn at Sohrevardi. Figure 1 illustrates this intersection. Intersection angle is not 90 degrees and has 3-phase intelligent traffic signal. This intersection has bus stop and special bus way. Schools are around the intersection and there isn’t any area traffic plan. In 2012 the average daily volume of vehicles is 24,253,695 in the main rout and 12,861,049 in secondary path and in 2013 the average daily volume of vehicles is 25,369,563 in the main rout and 13,889,933 in the secondary path. In 2012 the volume of pedestrians during the 15-minute study is 342,580 in the main rout and 185,253.00 in the secondary path. The number of pedestrian crashes is 17 persons. In 2013 the volume of pedestrians during the 15-minute study is 369,986 in the main rout and 195,236 in the secondary path. The number of pedestrian crashes is 15 persons.
4.2. Shariati-Taleghani Intersection
Taleghani Avenue is one-way from west to east and has 4 lanes in each direction and Shariati Avenue is oneway from north to south and has 3 lanes in each direction also there is discrete turn on two-sides in this intersection. Figure 2 illustrates this intersection. Intersection’s angle is not 90 degrees and has 2-phase intelligent traffic signal. This intersection has bus stop and special bus way. Schools are around the intersection and there is an area traffic plan. In 2012 the average daily volume of vehicles is 2,060,326 in the main rout and 6,160,350 in secondary path and in 2013 the average daily volume of vehicles is 2,282,929 in the main rout and 7,220,330 in the secondary path. In 2012 the volume of pedestrians during the 15-minute study is 226,784 in the main rout and 143,457 in the secondary path. The number of pedestrian crashes is 12 persons. In 2013 the volume of pedestrians during the 15-minute study is 285,365 in the main rout and 162,209 in the secondary path. The number of pedestrian crashes is 11 persons.
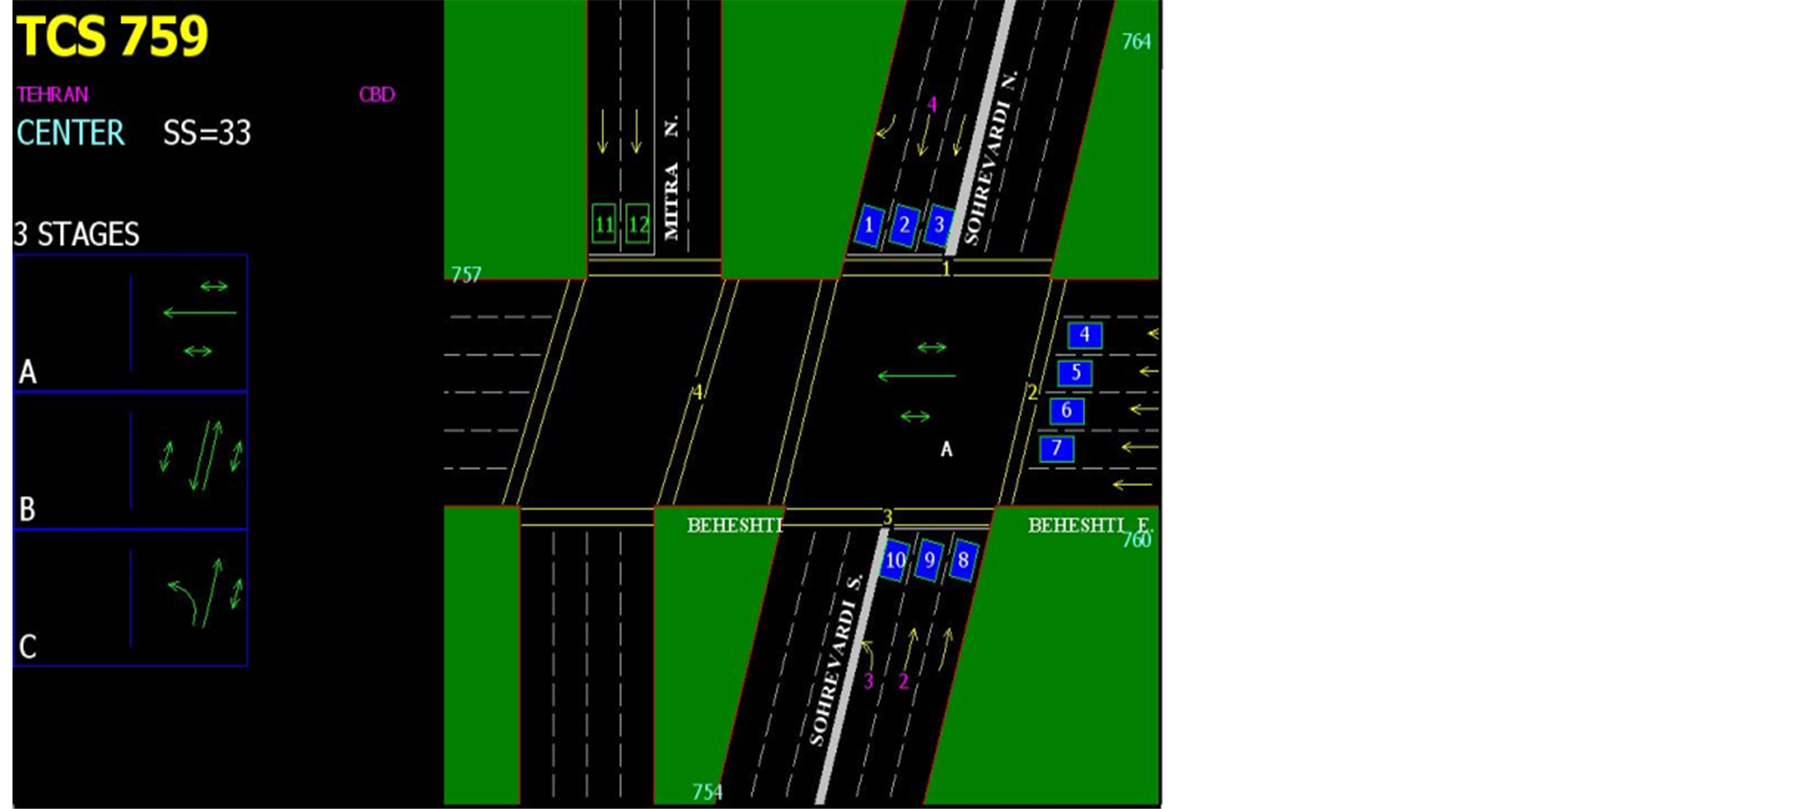
Figure 1. Sohrevardi-Beheshti intersection.
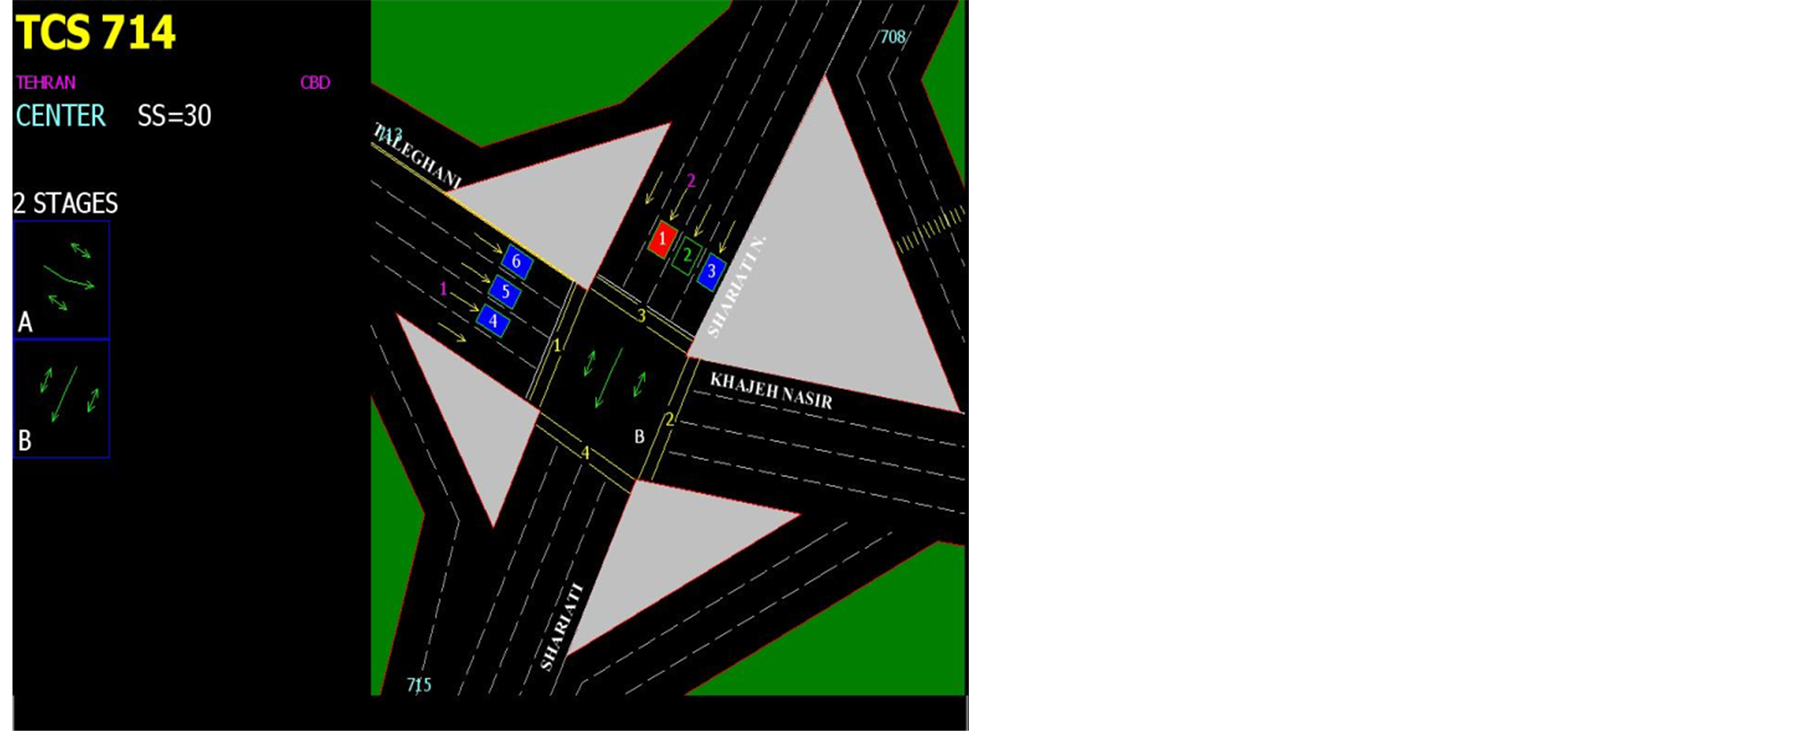
Figure 2. Shariati-Taleghani intersection.
4.3. Aemmeye Athar-Nabard Intersection
Aemmeye Athar Avenue from west to east has 2 lanes in each direction and Nabard Avenue from north to south has 2 lanes in each direction also there isn’t any discrete turn and area traffic plan. Figure 3 illustrates this intersection. Intersection’s angle is 90 degrees and has 2-phase intelligent traffic signal. This intersection has bus stop and special bus way. Schools are around the intersection. In 2012 the average daily volume of vehicles is 14,340,120 in the main rout and 6,298,805 in secondary path and in 2013 the average daily volume of vehicles is 14,108,345 in the main rout and 6,163,025 in the secondary path. In 2012 the volume of pedestrians during the 15-minute study is 248,325 in the main rout and 100,236 in the secondary path. The number of pedestrian crashes is 9 persons. In 2013 the volume of pedestrians during the 15-minute study is 259,664 in the main rout and 112,349 in the secondary path. The number of pedestrian crashes is 12 persons.
5. Development of Pedestrian Crash Prediction Models
The focus of this stage is using extracted site-specific information, integration, evaluation and selection for developing pedestrian crash estimation models at earlier stages. As previously mentioned only independent variables that are well correlated with each other are used to develop models. Generalized linear models that based on Poisson distribution and negative binomial distribution or incremental models usually are used to develop pedestrian crash estimation models. The average number of pedestrian crashes is used as the dependent variable at intersections during 2-year period. Incoming vehicles volume on the main and secondary rout in the early months of the year, public transit stops (bus) and schools within the vicinity of intersections, total incoming vehicles volume, the number of lanes at main and auxiliary road, area traffic plan, type of signal, one-way streets, intersection’s angle and pedestrian volume have been collected and considered as the predicted and independent variable. Scatter plots and preliminary statistical tests indicated that the relationship between pedestrian crashes and predictor variables are non-linear in nature. Non-linear relationships are based on Poisson distribution, negative binomial distribution, and lognormal distributions. Also incremental models to identify the best model that can explain the relationship between pedestrian crashes and the selected predictor variables have been tested. As the first step after entering data’s into spss software, dependent and independent variables that have well correlated with greater than 0.5 is kept. Correlation between the independent variables should be less than 0.5, other variables that do not qualify will not be participating in crashes prediction models. Correlation between the variables is investigated to select the final set of predicted variables to develop pedestrian crash estimation models. According to the correlation matrix obtained from the SPSS software NL1, NL2, TT, LS, OW, S, BR variables among other variables are removed for modeling in this paper. After examining the correlation, three types of models including: regression, Poisson and Binomial have been done to predict crashes. By validating (Curve Fitting) each of tests and investigating a variety of tests including chi-square and T-test in connection with each of models, the most appropriate model that has R2 close to 1 will be selected for predicting pedestrian crashes in future. Effective variables in crashes are shown in Table1
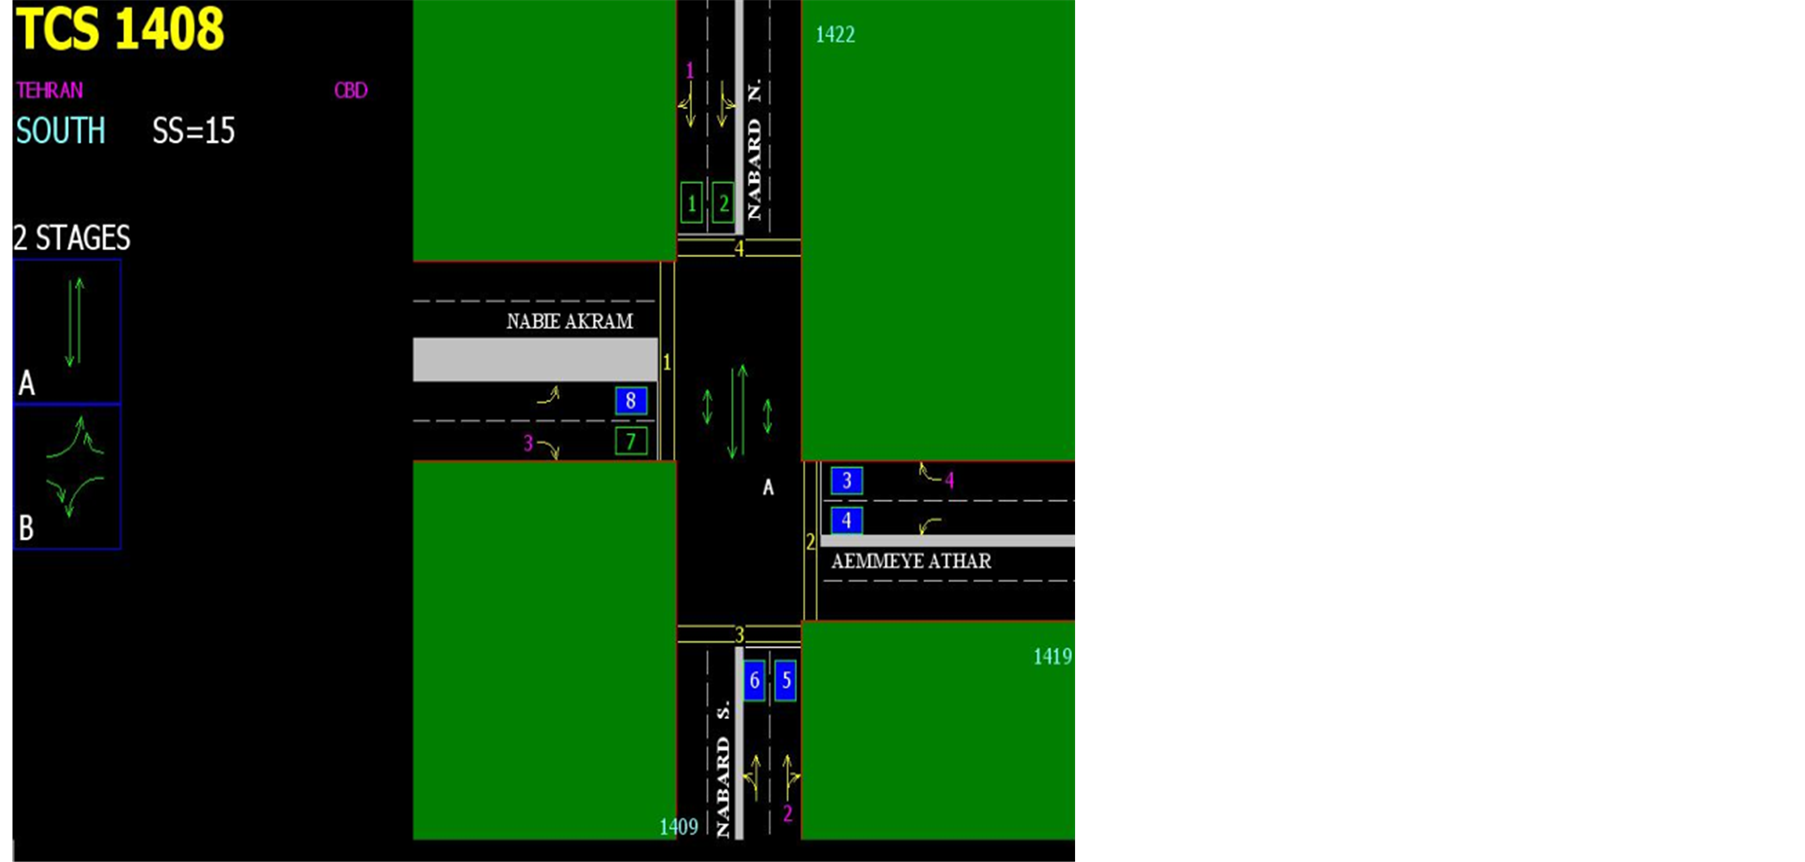
Figure 3. Aemmeye Athar-Nabard intersection.

Table 1. Effective variables in crashes.
6. Pedestrian Crash Prediction Models
The pedestrian crash estimation models have been developed by considering information for intersections. The purpose of statistical model is to identify the relationship between the expected number of crashes at intersections E (Yi) and dependent parameters to intersection Xj, (j = 1, 2, ..., n). So a set of series including q parameter that describe road characteristics, traffic volume, and other related properties will be devoted to it. According to research, linear regression, Poisson and negative binomial models were more appropriate for pedestrian crashes modeling and are very useful in the crashes analysis [12] . Modeling of quantitative factors is used as numerical. Qualitative factors are used 0, 1 and 2 as coded. NOA Variable (number of crashes per year) has been considered as the dependent variable and the other variables have been considered as independent variables. Independent variables should not well correlate with each other. Therefore Pearson correlation coefficient was used to calculate data correlation index. Data shows that the number of pedestrian crashes increased by population growth near schools, public transportation stations, and the number of sideway approaches at intersections, pedestrian volume increases, and the number of discrete turn. However, we can observe fewer pedestrian crashes if commercial and residential centers are close to the intersection. Because drivers reduce their speed when faced with such centers.
6.1. Linear Regression
The general form of the model is as follows:
 (1)
(1)
where:
Y is dependent variable, Xi’s are independent variables and βi’s are the regression coefficients. The generalized form for predicting crashes at intersections is as follows:
 (2)
(2)
where:
Yi: Number of crashes at intersection I;
Xj: independent variables;
βj: unknown variable coefficients.
The method of minimum squares and maximum likelihood are used to estimate β. Distribution of βi is not considered in minimum squares method, but normal distribution with zero mean and constant variance σ2 > σ are considered in the maximum likelihood method. T-test is used to test whether the variables are normally distributed and sample mean is equal to population mean. NOA is the number of crashes and dependent variable in this model. The results of the linear regression with studied intersections data have been indicated in Table2 The results show that the variables are significantly higher than 0.05 and adjusted R2 of the model is 0.538, which indicates a relatively poor fitting of the model and also variables have weak relationship with dependent variable (number of crashes per year).
Linear regression model with Computational coefficient is as follows:

6.2. Poisson Regression
Poisson regression models are discrete models and used when consequence are rare. Considering that crashes statistics are discrete, non-negative, integer variable and the average number of crashes at intersections is low, this method can well modeling crashes at intersection. The general form of the model is as follows:
 (3)
(3)
The relationship between the number of crashes at i intersection (i = 1, 2, and 3…, n) and the q parameter (Xil, Xi2, Xiq) is as follows:
 (4)
(4)
 (5)
(5)
where:
Yi: the independent variable with Poisson distribution and μi mean, Xi: independent variables at intersection i.
The results of the Poisson model with studied intersections data can observe in Table3 It can observe that
Table 2 . Results of linear regression model [13] .
Table 3. Results of Poisson regression model [13] .
variables standard deviation is less than 1. So the actual distribution of data is lower than model and model fitting would not be appropriate. Poisson regression model with variable computational coefficients are calculated as follows:

6.3. Negative Binomial
Negative binomial distribution is discrete distribution and used for high dispersion of crashes data. Also unlike the Poisson distribution, it has two parameters. If Yi is the number of crashes with negative binomial distribution by α and k parameters at intersection i and predictor variables is Xiq, The number of crashes relationship is calculated as follows:
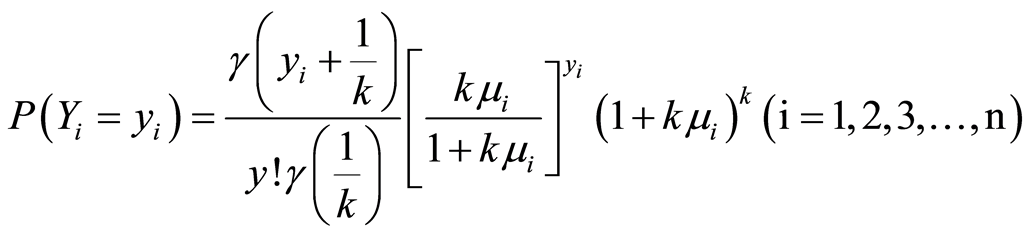 (6)
(6)
where:
 : Gamma function.
Mean and variance of crash data’s negative binomial distribution are as follows relationships:


If dispersion parameter (k) is zero, negative binomial distribution will tend to Poisson distribution. And if k is negative (variance is smaller than mean), negative binomial model is not appropriate. Therefore Poisson model should be used.
The results of the negative binomial model with studied intersection data are shown in Table4 The p-value is greater than 0.5 indicates that the model is suitable for variable. Negative binomial regression model with variable computational coefficients are calculated as follows:

7. Comparison the Output of Linear Regression, Poisson and Negative Binomial Models
Due to the fact that crashes are accidental, scattered and independent, Poisson model is more appropriate than the linear regression model to investigate crashes. Some researches were used Poisson regression models to establish any relationship between traffic accidents and effective factors in creating them. The limitation of the Poisson model is equality of mean and variance and does not established in crashes. If this assumption is not true, the statistics derived from the model will be incorrect and the standard deviation that usually estimated by maximum likelihood method will be deviated. Some researchers in recent years have concluded that crashes data are significantly too scattered. It means that the variance is much greater than the mean of data. So this will lead to incorrect estimates of crashes probability. Negative binomial model is more appropriate because the Pearson chi-square value is less than the Poisson model. Indicated summary results show non-linear relationship between predictor variables and pedestrian crashes. Therefore, the best pedestrian crash estimation models is created when classified are based on the level of pedestrian’s activity.
8. Validating Models
Model was calibrated by chi square and t tests with crashes statistic at intersections and the dispersion between observed and predicted values with Curve-Fitting graphs can be observed in Figure 4 and Figure 5 in this sec-
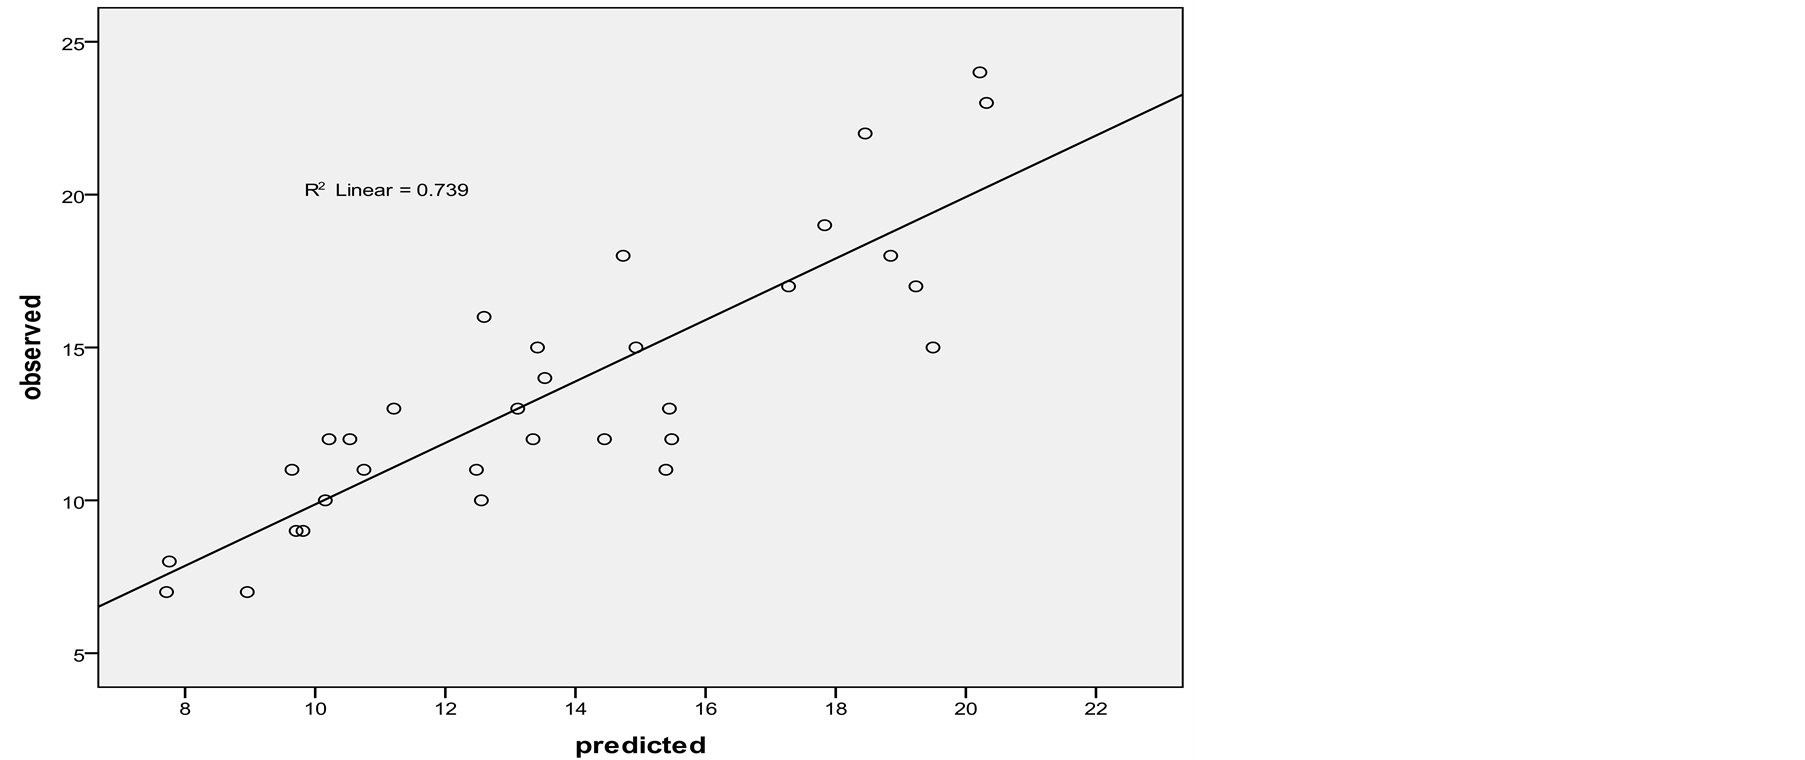
Figure 4. Scatter plot between observed and predicted Poisson model at intersections.
Table 4. Results of Negative binomial regression model [13] .
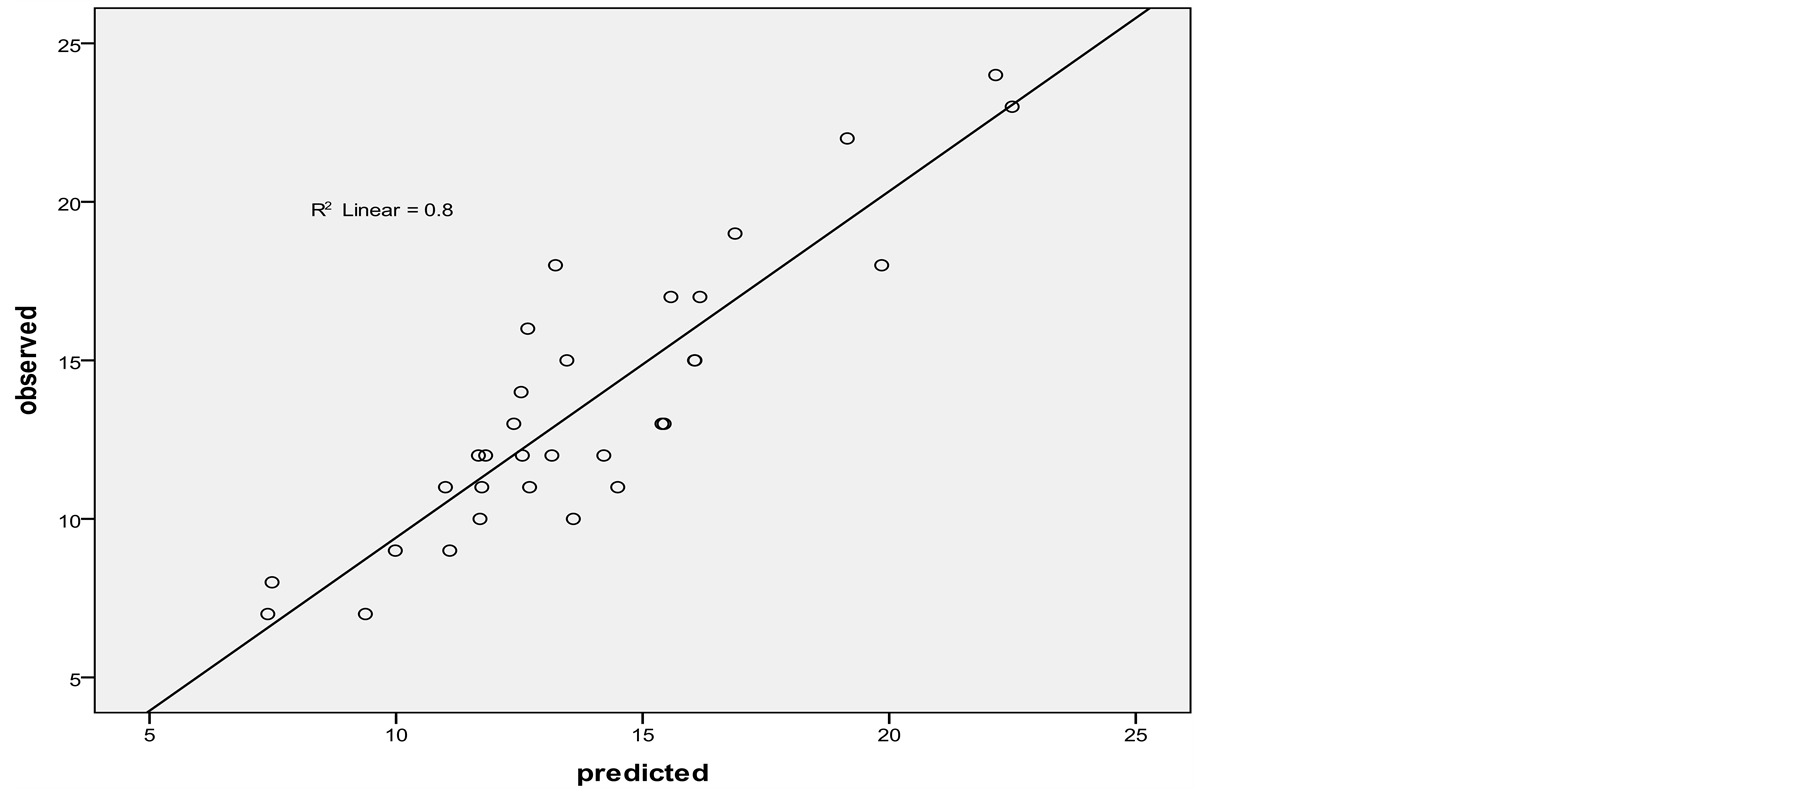
Figure 5. Scatter plot between observed and predicted negative binomial model at intersections.
tion. According to results, it can be observed that the negative binomial regression model due to R2 = 0.8 has better performance than the Poisson model. Also remaining four intersections that were not included in the model can be used for specifying the error rate in observation and model and model validating. That only the first intersection will be mention in this paper. Scatter plots and preliminary statistical tests indicated that the relationship between pedestrian crashes and predictor variables are non-linear in nature. Non-linear relationships based on Poisson, negative binomial, and lognormal distributions. Also the incremental model has been tested to identify the best model that could elaborate the relationship between pedestrian crashes and selected predictor variables. By validating (Curve Fitting) each of tests and investigating a variety of tests including chi-square and T-test in connection with each of models, the most appropriate model that has R2 close to 1 will be selected to predict pedestrian crashes in future.
Information about the intersection of Taleghani-shariati is explained in Section 5.
Negative binomial model:


9. Sensitivity Analysis and Provide Solutions for the Pedestrians Safety at Intersections
Study the effects of output variables from input variables of statistical model is called sensitivity analysis1. In other words, sensitivity analysis is a method for changing the statistical model inputs to an organized (systematic), that can be predicted the effects of changes in model’s output. Calibrated models will be under the sensitivity analysis to study the effect of each mentioned factor in overall performance. At first, three intersections profile as sample be selected for this method then the number of pedestrian crashes change rate due to change of any parameters will be examined by Excel software. Only one intersection’s sensitivity analysis is investigated in this paper. The results of the sensitivity analysis are shown in Table 5 and Table6 As the rate of change, the parameters that expressed in to percentage are used to calculate the effect of changes rate in performance value. The results of sensitivity analysis for Taleghani-Beheshti intersection show that the maximum sensitivity of pedestrian crashes is related to bus stop which nears to intersection and increases 17.13% of pedestrian crashes. This happens because more pedestrians are crossing stations. Discrete turn reduces 16.72% of pedestrian crashes at intersections. Pedestrian crashes due to driver visibility reduction will be increased when streets angle leading to intersection is other than 90 degrees than when it is 90 degrees. 10% increases in pedestrian volume in main route causes 2.63% increase in crashes rate and 10% decreases in pedestrian volume in main route causes 2.56% decrease in crashes rate. Other results can be observed in Table5
These factors are classified based on the type and nature of each factor after determining effective factors on pedestrian crashes at intersections. Many strategies that outlined below can help to reduce pedestrian crashes and improving pedestrian safety and their convenience at intersections and passage. These methods include the following:
• Reduce vehicles speeds.
• Reduce the probability of intersecting streets with pedestrian pathways.
• Create particular lanes which separated from vehicles.
• Increase visibility between vehicles and pedestrians and increase safety warnings.
• Improvement of pedestrians and drivers behavior.
• Construct overpass and underpass bridges for pedestrian or cyclists.
• Reducing the width of streets in intersecting with pedestrian path.
• Emphasis on not doing other activities while pedestrians and cyclists move from pathways (speak, watch shops ,use cell phone, etc.).
• Increased in front of vehicles safety to reduce injuries to vulnerable groups.
• Install special pedestrian signals at intersections.
Table 5. 10% increase and decrease of effective parametric variables results in main and secondary routes of intersection [14] .
Table 6. Presence or absence of effective nonparametric variables results in the main and secondary routes [14] .
• Modification of intersections geometric design to enhance the driver’s visibility of pedestrians who cross the street width.
• Apply intelligent traffic systems to identify pedestrians and cyclists and to alert vehicles drivers.
• Provide pedestrian crash prediction models to investigate the effective factors and reduce the number of crashes at intersections.
• Reduction of public places in the vicinity of pedestrian to reduce the pedestrian volume.
• Another important point is pedestrian lanes painting at intersections. Painted surfaces are very slippery and dangerous for pedestrian during rainfall. For this reason, pedestrian lanes painted into two pieces which 2 meters away among them. So pedestrian cross from this created gap.
10. Conclusions and Recommendations for Future Research
Traffic accidents are one of the major public health threat and a national disaster. Thus reducing traffic accidents in developing countries is one of the most important issues because the number of accidents increases in these countries. Most accidents happen in urban traffic networks so the role of intersections is very important. Due to converging traffic flow, more accidents have been observed at intersections. Identifying effective factors on pedestrian crashes and providing pedestrian crash prediction models can help to improve pedestrian safety and prevent pedestrian crashes at intersections. Some models were shown to estimate pedestrian crashes at intersections during the research. Incoming vehicles volume on the main and secondary routs, number of transit stops and schools within the vicinity of intersections, number of lanes at main and auxiliary road, area traffic plan, type of signal, one way streets, intersection’s angle and pedestrian volume have been extracted and used in pedestrian crash estimation models for 20 intersections. After examining the correlations some parameters were excluded in model. Among models including: linear regression, Poisson and negative Binomial to select the best pedestrian crash prediction model from studied models with conducted tests on them that can express characteristics of pedestrian crashes in the best way, negative binomial due to less dispersion, more correlation and logical answer between Poisson and linear regression were considered more appropriate.

While the number of transit stops, shopping malls, area traffic plan cause to reduce the pedestrian crashes rate. Drivers tend to alert and pay more attention to pedestrian’s safety because they typically expect to encounter more pedestrians in these areas. The results of sensitivity analysis show that the maximum sensitivity of pedestrian crashes is related to bus stop which nears to intersection and increases 17.13% of pedestrian crashes. This happens because more pedestrians are crossing stations. Discrete turn reduces 16.72% of pedestrian crashes at intersections. Pedestrian crashes due to driver visibility reduction will be increased when streets angle leading to intersection is other than 90 degrees than when it is 90 degrees. 10% increases in pedestrian volume in main route causes 2.63% increase in crashes rate and 10% decreases in pedestrian volume in main route causes 2.56% decrease in crashes rate. Demographic, socio-economic, land use characteristics can be effective on the relationship between pedestrian crashes, vehicles and pedestrian volume. Aspects such as population by age group, automobile ownership and transit ridership (alighting and boarding passengers at each transit stop) and weather condition were not considered due to the lack of available data for the study period. Described methods in the previous section can great help to improve pedestrian safety and reduce pedestrian crashes after determining effective factors and providing pedestrian crash prediction model at intersections.
Recommendations for Future Research
Researchers interested in reducing pedestrian crashes to complete this research can continue their studies in the following subjects at intersections:
• Parameters such as demographic, socio-economic, land use characteristics that have an impact on the relationship between pedestrian crashes, vehicles and pedestrian volume, different aspects including population by age group, automobile ownership, transit ridership (alighting and boarding passengers at each transit stop) and weather condition that due to the lack of available data were not considered at intersections for the study period could be considered to estimate the pedestrian crash prediction model in their research.
• Research can also be done on the optimization of traffic signals phase for safe passage of pedestrians.
• Cordon study2 could used to limit public transit stops, commercial centers; schools and etc distance to the intersection and provide accurate data to the location.
References
- Pulugurthaa, S.S. and Sambharab, V.R. (2011) Pedestrian Crash Estimation Models for Signalized Intersections. Accident Analysis and Prevention, 43, 439-446. http://dx.doi.org/10.1016/j.aap.2010.09.014
- Joksch, H.C. and Kostyniuk, L.P. (1997) Modeling Intersection Crash Counts and Traffic Volume. http://deepblue.lib.umich.edu/bitstream/2027.42/1213/2/90762.0001.001.pdf
- Brude, U. and Larsson, J. (1993) Models for Predicting Accidents at Junctions Where Pedestrians and Cyclists Are Involved. How Well DO they Fit? Accident Analysis and Prevention Journal, 25, 449-509. http://dx.doi.org/10.1016/0001-4575(93)90001-D
- Huang, H., Chin, H.C. and Haque, M.M. (2008) Bayesian Hierarchical Analysis of Crash Prediction Models. Transportation Research Board 87th Annual Meeting Compendium of Papers DVD, Washington, DC.
- Lyon, C. and Persaud, B.N. (2002) Pedestrian Collision Prediction Models for Urban Intersections. Transportation Research Record # 1818, 102-107. http://dx.doi.org/10.3141/1818-16
- Wier, M., Weintraub, J., Humphreys, E.H., Seto, E. and Bhatia, R. (2009) An Area-Level Model of Vehicle-Pedestrian Collisions with Implications for Land Use and Transportation Planning. Accident Analysis & Prevention Journal, 41, 137-145. http://dx.doi.org/10.1016/j.aap.2008.10.001
- Torbic, D.J., Harwood, D.W., Bokenkroger, C.D., Srinivasan, R., Carter, D.L., Zegeer, C.V. and Lyon, C. (2010) Pedestrian Safety Prediction Methodology for Urban Signalized Intersections. Transportation Research Board 89th Annual Meeting Compendium of Papers DVD, Washington DC.
- Lee, C. and Abdel-Aty, M.A. (2005) Comprehensive Analysis of Vehicle-Pedestrian Crashes at Intersections in Florida. Accident Analysis & Prevention Journal, 37, 775-786. http://dx.doi.org/10.1016/j.aap.2005.03.019
- Elvik, R. (2009) The Non-Linearity of Risk and the Promotion of Environmentally Sustainable Transport. Accident Analysis & Prevention Journal, 41, 849-855. http://dx.doi.org/10.1016/j.aap.2009.04.009
- Harwood, D.W., Torbic, D.J., Gilmore, D.K., Bokenkroger, C.D., Dunn, J.M., Zegeer, C.V., Srinivasan, R., Carter, D., Raborn, C., Lyon, C. and Persaud, B. (2008) Pedestrian Safety Prediction Methodology. NCHRPWeb-Only Document 129: Phase. III. Transportation Research Board, Washington DC.
- FHWA How to Develop a Pedestrian Safety Action Plan Traffic Safety Basic Facts (2005).
- Pickering, D., Hall, R.D. and Grimmer, M. (1986) Estimation of Safety at Two-Way STOP-Controlled Intersections on Rural Highways. Transportation Research Record, 1401, 83-89.
- PASW. Statistics18 lnk. Statistics Software SPSS 18.
- Microsoft Office Excel ( 2007). Lnk.
NOTES

*Corresponding author.

1Sensitivity Analysis (SA).

2Cordon study.