Open Journal of Civil Engineering
Vol. 3 No. 2 (2013) , Article ID: 32514 , 9 pages DOI:10.4236/ojce.2013.32012
Damage Detection Method Using Support Vector Machine and First Three Natural Frequencies for Shear Structures
Department of System Design Engineering, Keio University, Yokohama, Japan
Email: *thuhienjolie@gmail.com
Copyright © 2013 Hien HoThu, Akira Mita. This is an open access article distributed under the Creative Commons Attribution License, which permits unrestricted use, distribution, and reproduction in any medium, provided the original work is properly cited.
Received March 21, 2013; revised April 22, 2013; accepted April 30, 2013
Keywords: Support Vector Machine; Damage Detection; Natural Frequency; System Identification; Damage Location Indicator
ABSTRACT
A method is proposed for detecting damage to shear structures by using Support Vector Machine (SVM) and only the first three natural frequencies of the translational modes. This method is able to determine the damage location in any story of a shear building with only two vibration sensors; to obtain modal frequencies, one sensor on the ground detects an input and the other on the roof detects the output. Based on the shifts in the first three natural frequencies, damage location indicators are proposed, and used as new feature vectors for SVM. Simulations of five-story, nine-story and twenty-one-story shear structures and experiments on a five-story steel model were used to test the performance of the proposed method.
1. Introduction
Structural health monitoring (SHM) has become a major focus of research in the area of structural dynamics. Many damage detection algorithms based on the modal properties of a structure including the natural frequencies, mode shapes, curvature mode shapes and modal flexibilities have been studied for several decades. However, most algorithms have difficulty identifying the precise location and magnitude of the damage. Moreover, even if such identification is possible, the accuracy and reliability of the properties are not sufficient [1].
Although frequency shift methods are simple and easy to apply, they have significant practical limitations. For instance, the measurements have to be very precise if the level of damage is not great. In addition, the change in the natural frequency associated with a certain mode in a structure does not provide any spatial information about where the damage occurred, because modal frequencies are global properties of the structure. Salawu [2] presented a review on detection of structural damage through changes in frequency. The approach is based on the fact that natural frequencies are sensitive indicators of structural integrity. The relationship between frequency changes and structural damage was discussed.
In 1998, Doebling et al. [3] reviewed the literature on vibration-based damage identification methods. Many of the methods use changes in the natural frequencies to detect damage. The amount of literature is large; they comprise not only applications to various structures, but also theoretical work on the use of frequency shifts for damage detection.
Many methods perform well at frequency-based damage identification in small degrees of freedom. For larger engineering structures, the number of obtained natural frequencies is less than the number of structural elements. This is one of the reasons why frequency change methods have limited abilities to detect damage [4]. To overcome these problems, some researchers have been using the substructure method [5], error matrix method [6], sensitivity-based method [7], combine sensitivity and statistical-based methods [8], and so on.
The SVM is a powerful tool for pattern recognition and it seems useful for detecting the location of damage. This requires data from the undamaged and damaged structure successfully train and classify the structure into damaged and undamaged classes. SVM has better generalization performance than other methods of problems of damage detection and location [9]. Meyer [10] presented a benchmark study comparing the performance of SVMs with other classification techniques for natural and artificial datasets.
Previous studies [11-15] conducted at the Mita Laboratory of Keio University, demonstrated that damage detection methods using SVM worked well in many cases. The scope of this work is to develop an improved method to identify the location of damage by using a limited number of sensors. We know that a natural frequency change associated with a certain mode does not provide spatial information about structural damage, but multiple natural frequency changes can give such information. However, in practical situations, the obtained natural frequencies are usually smaller than the degrees of freedoms. The proposed method only requires the first three natural frequencies. The first three natural frequencies are used to obtain the new damage location indicators. These indicators are the feature vectors for pattern recognition.
2. Damage Detection of Structures Using Support Vector Machine
2.1. Sensitivity of Damage Location Indicators
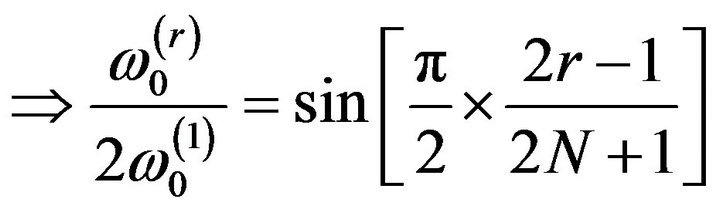
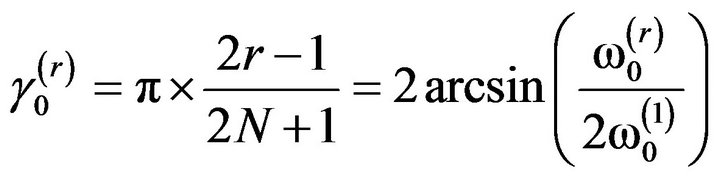
The rth natural circular frequency,  , of an N-degreeof-freedom (as shown in Figure 1) undamaged structure was given as Equation (9) in [16]:
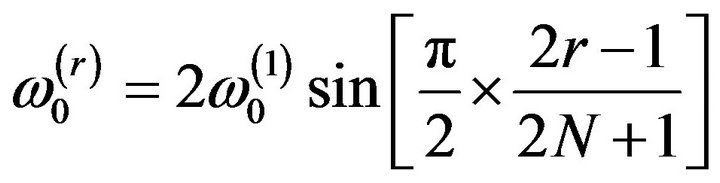 (1)
(1)
where  is the first frequency of undamaged structure.
 (2)
(2)
The wave propagation constant  mode of safe state can be defined as:
 (3)
(3)
Moreover, the  mode of the ith element damaged state was calculated by:
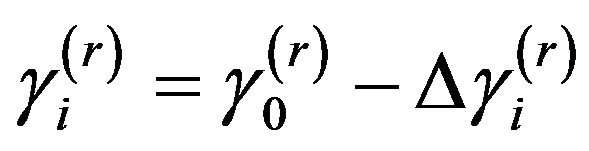 (4)
(4)
The change  due to damage
  to the ith element, can be obtained from Equation (28) in [17]:
 (5)
(5)
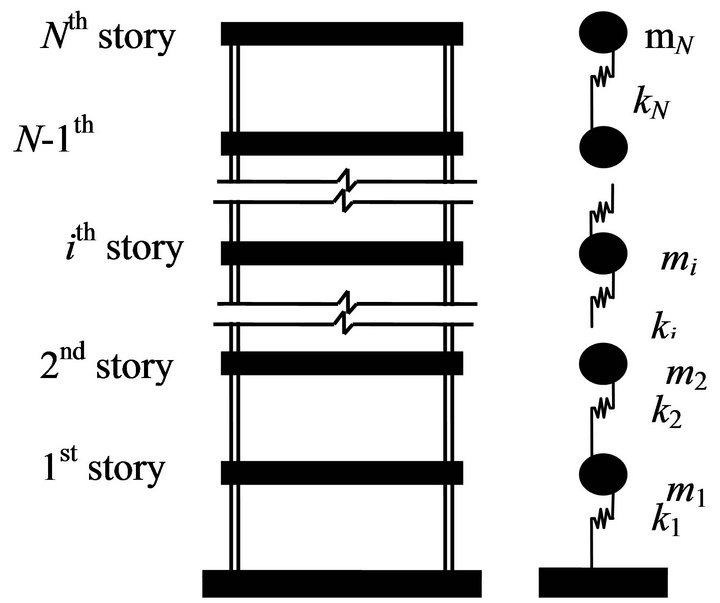
Figure 1. Simplified structural model with N-DOFs.
From Equation (5) above, it can be seen that the change,  , depends only on the location of damage (i) and the degree of freedom N.
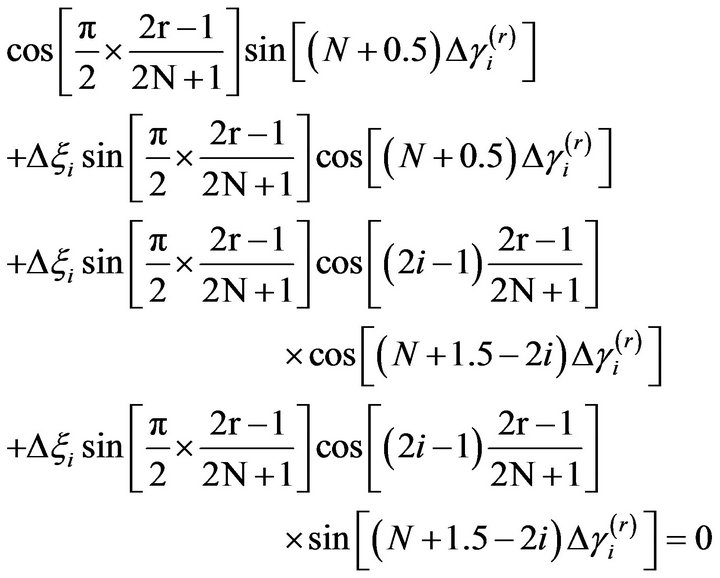
The change  in the rth natural circular frequency due to
  can be found by combining Equations (3)- (5):
 (6)
(6)
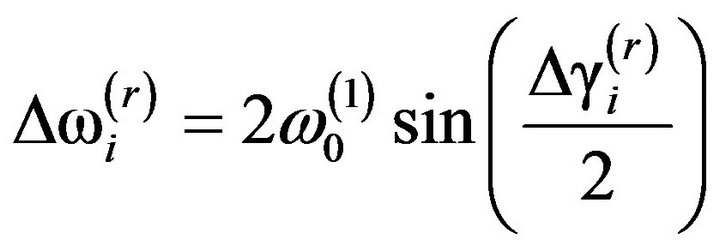
The change in the natural frequency can be calculated from Equations (1) and (6):
 (7)
(7)
which is the same as Equation (29b) in [17].
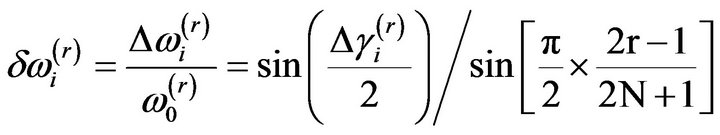
The above relation showed that the damage was related to the shifts in the natural frequencies. The ratio of the change in the rth and sth frequencies can be used as a pattern depending on the location of the damage:
 (8)
(8)
Equation (8) demonstrates the sensitivity of the change in ratio of the shift of a few natural frequencies to the location of the damage. This should be able to be used as a damage location index.
2.2. Construction of Feature Vectors for Support Vector Machine
The sensitivity analysis ideally involves all natural frequencies. However, in some cases, not all of the natural frequencies are available. Therefore, the errors due to incomplete mode parameters should be accounted.
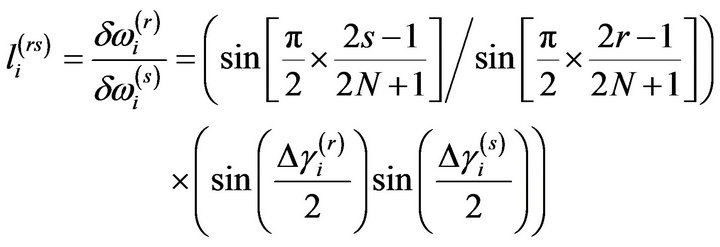
To solve this problem, we define new damage location indicators that have good pattern recognition ability with only the first three natural frequencies. By using the ratio in Equation (8), we defined two damage location indicators:
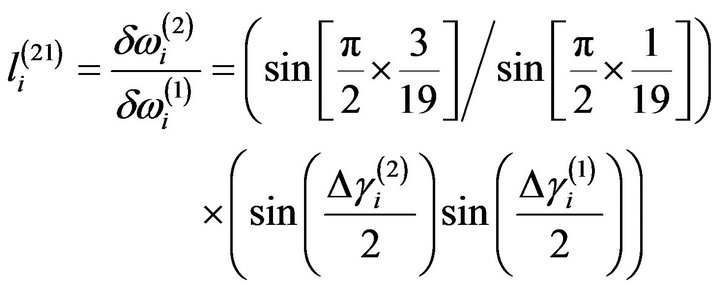 (9a)
(9a)
 (9b)
(9b)
The changes in  and
and  can be used as feature vectors. They may be able to be used as to identify the damage location by using a few lower modal frequencies.
2.3. Support Vector Machine
The Support Vector Machine (SVM) is a mechanical learning system that uses a hypothesis space of linear functions in a high dimensional feature space [18,19]. It has been used for structural damage detection because of its ability to form an accurate boundary from a small amount of training data.
The simplest model, Linear SVM (LSVM), works when the data are linearly separable in the original feature space. In most cases, nonlinear classification using the same procedure as in LSVM is possible as a result of introducing nonlinear functions called Kernel functions without having to be conscious of the actual mapping space. This extension to nonlinear feature spaces is called Nonlinear SVM (NSVM) (Figure 2).
3. Numerical Verification
To show the feasibility of the proposed method, N-story structures were modeled as one-dimensional lumped mass shear models, as shown in Figure 1. Structures with N = 5, 9 and 21 stories were analyzed. Three percent was chosen as the damping ratio for all modes. The data sampling frequency was 200 Hz.
A reduction in the story stiffness was regarded as damage to the structure. Training feature vectors were generated by assuming three levels of stiffness reduction, 10%, 20%, and 30%, for each story, and the corresponding feature vectors  were generated for each damage pattern. A feature vector consisting of zero elements was used to indicate the undamaged structure.
Assuming five levels of stiffness reduction, 8%, 16%,
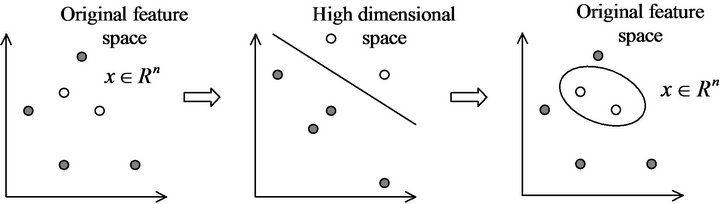
Figure 2. Non-linear SVM.
24%, 32% and 40% for each story, (5 × N) feature vectors were used to verify the proposed method. The first five data corresponded to 8%, 16%, 24%, 32% and 40% stiffness reductions in the first story. The second five data are for the stiffness reduction in the second, third, etc., sets of five data were for the stiffness reductions in the second, third story, and so on. The last data indicated the no damage case.
SVMi denotes a machine that distinguishes the pattern with damage in the ith story from the other patterns.
3.1. Five-story Shear Structures (N = 5)
We considered a five-story structure with the same mass and the same stiffness for all stories: mi = 1000 ton, ki = 2 × 10³ MN/m.
The undamaged natural frequencies of the structure were obtained as 2.03, 5.91, 9.32, 11.98 and 13.66 Hz for the 1st, 2nd, 3rd, 4th and 5th modes, respectively.
As mentioned above, a reduction in story stiffness was regarded as damage to the structure. Five damage cases (damage to the 1st, 2nd, 3rd, 4th and 5th stories) were studied.
Figure 3 shows the output of SVMi with the feature vectors being the change in the first three modal frequencies  of the previous method [12-14]. Here, we can see some miss-classifications in the outputs of SVM1 and SVM3.
Figure 4 shows the results when our new damage location indicators were used as the feature vectors. There were no miss-classifications in these results.
3.2. Nine-Story Shear Structure (N = 9)
The spring-mass system with nine degrees of freedom was used to demonstrate the sensitivity analysis. The stiffness of each story was assumed to be 1.3 × 10³ MN/m.
Mass of nine stories:
m1 = 1000 ton, m2 = 950 ton, m3 = 900 tonm4 = 850 ton, m5 = 800 ton, m6 = 750 tonm7 = 700 ton, m8 = 650 ton, and m9 = 600 ton.
The undamaged natural frequencies of the structure were obtained as 1.12, 3.16, 5.14, 6.99, 8.64, 10.03, 11.14, 12.07 and 13.22 Hz for the 1st, 2nd, 3rd, 4th··· and 9th modes, respectively.
Nine cases of damage (damage to the 1st, 2nd, 3rd, 4th··· and 9th stories) were studied. Figure 5 shows the change
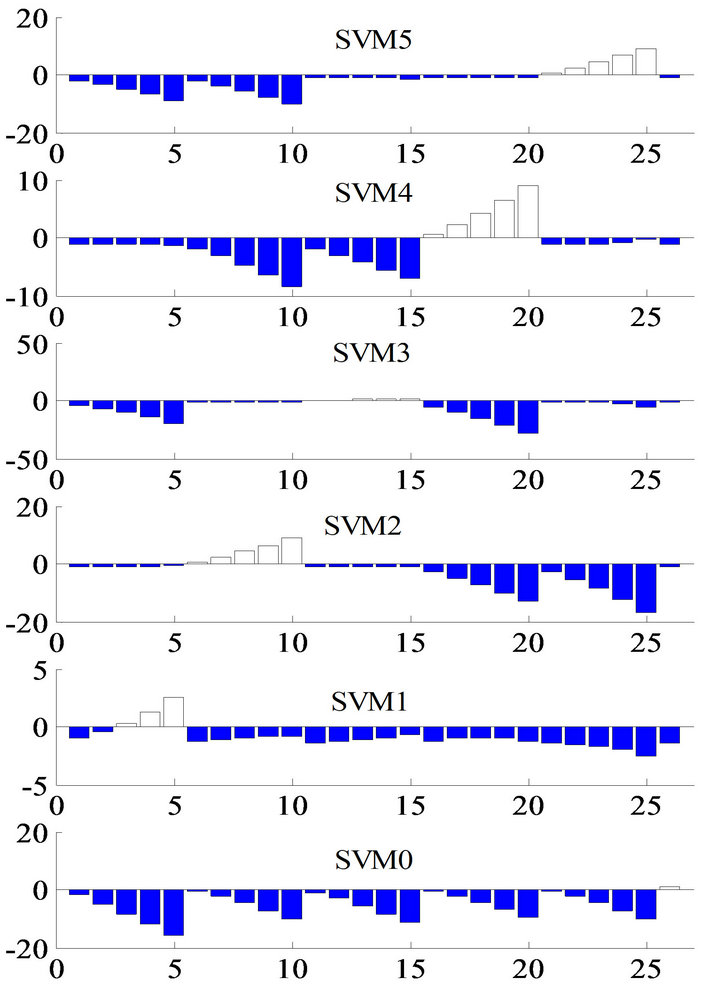
Figure 3. Outputs from SVM0 through 5 with change in first three natural frequencies of five-story shear structure.
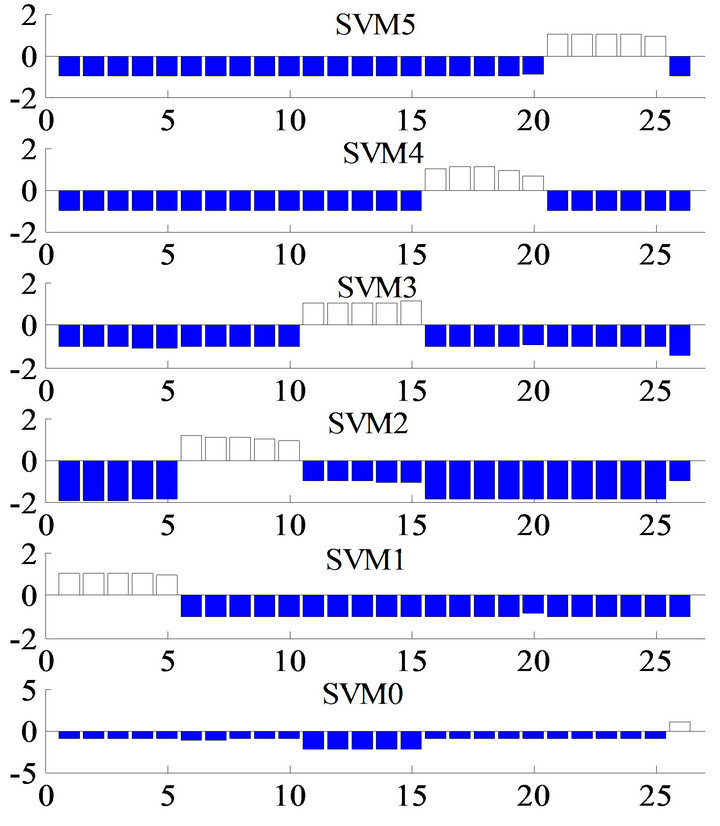
Figure 4. Outputs from SVM0 through 5 with two damage location indicators of five-story shear structure.
in the natural frequencies of nine modes when damage occurred in each story of the simulation. By focusing on the sensitivities of 1st, 2nd and 3rd modal frequencies; they could be feature vectors that would be reasonable patterns for SVM.
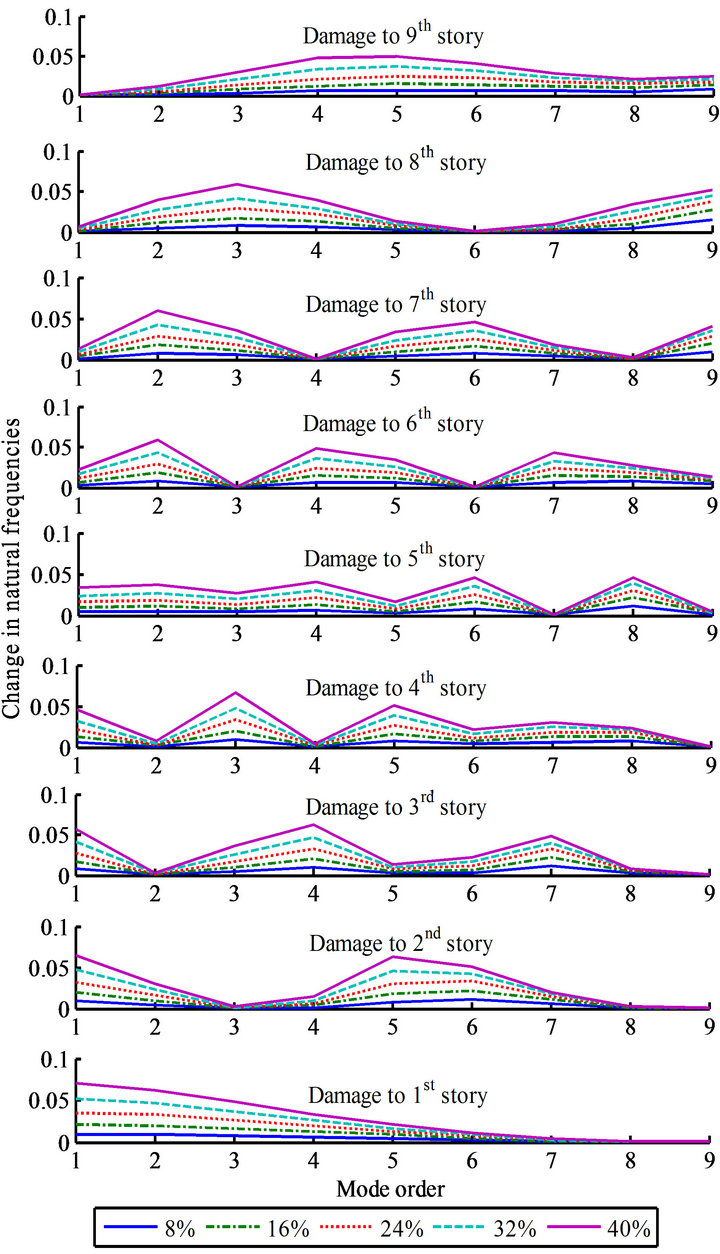
Figure 5. Change in natural frequencies when damage occurred.
Figure 6 shows the sensitivity of the first three natural frequencies of the nine-story shear structure to the location of damage. For each natural frequency, there were some locations where one of these frequencies is the most sensitive to the damage, while there are other locations at which the damage has little influence on the frequency.
From Figure 6, the influence of the damage location on the first natural frequency decreases with the height in story; this means the first natural frequency is the most sensitive to damage at the 1st story. In contrast, the second natural frequency is the most sensitive to damage at the 1st and 7th story. Similarly, there are three peaks at the 1st, 4th and 8th story in the third natural frequency.
Figure 7 shows distinctive patterns  depending on the location where the damage occurred.
Figure 8 shows the output of SVMi in which the feature vectors are the change in three first modal frequen
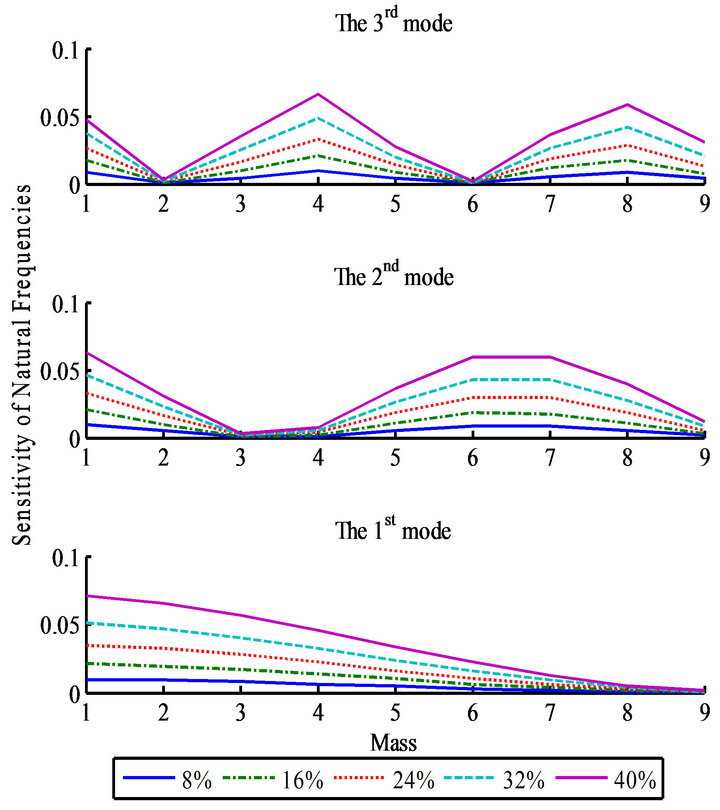
Figure 6. Sensitivity of natural frequencies when damage occurred in 9-story shear structures of different masses.
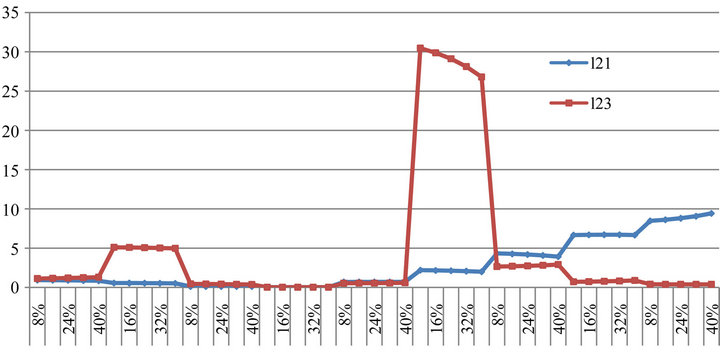
Figure 7. Change in two damage location indicators of ninestory simulation.
cies 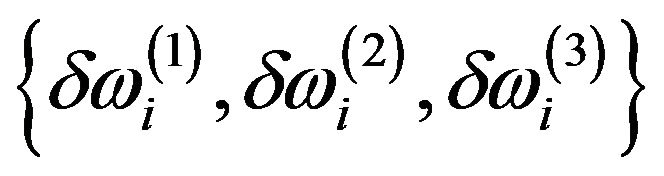 , as in the previous method [12-14]. It is clear that there are some miss-classifications in the outputs of SVM1, SVM2, SVM5, SVM6, and SVM8.
This nine-story shear structure was excited by Gaussian white noise, to simulate an input such as an earthquake, and 5% noise was added to the acceleration responses of the structure.
When the feature vectors with our new damage location indicators were used, there were no miss-classification (Figure 9 (no noise) and Figure 10 (5% noise)). These feature vectors could also detect the locations of a small amount of damage (8% stiffness reduction).
3.3. Twenty-One-Story Shear Structure (N = 21)
A twenty-one-story shear structure was used to verify that this method would work for tall buildings. The stiffness of each story was assumed to be 1.3 × 10³ MN/m.
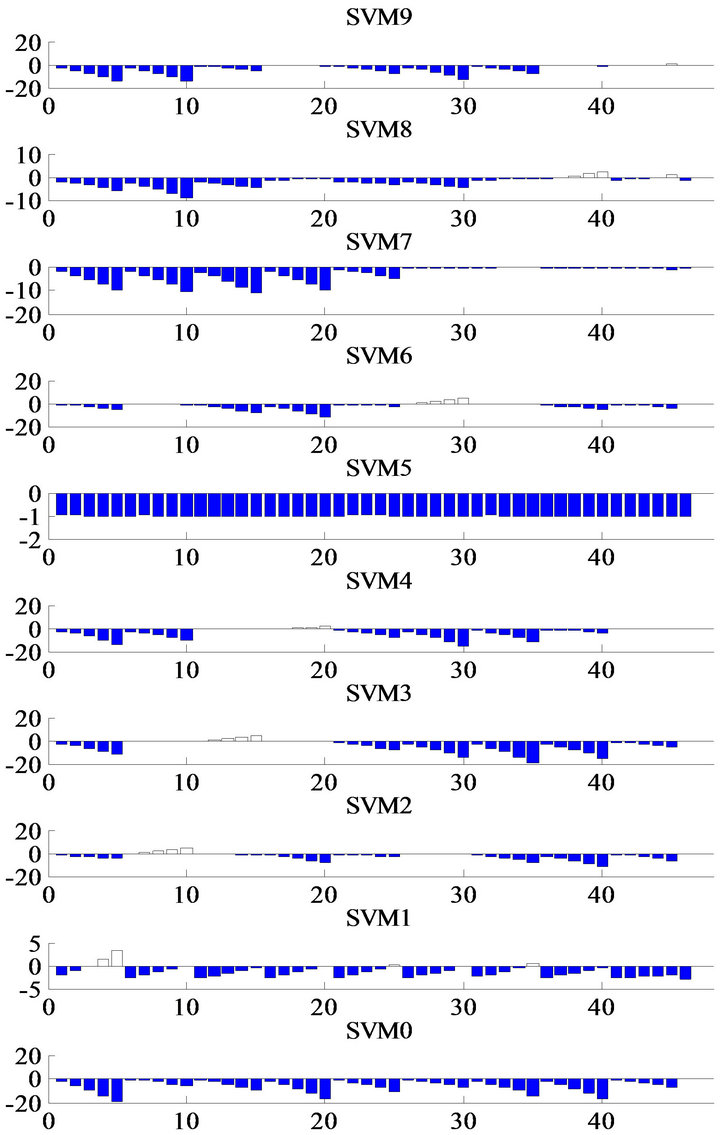
Figure 8. Outputs from SVM0 through 9 with the change in the first three natural frequencies of a nine-story shear structure.
The masses of story are listed in Table 1. The undam aged natural frequencies are shown in Table 2.
Figure 11 shows the sensitivity of the first three natural frequencies of the 21-story shear structure together with the locations of the damage. Figure 12 shows results of our method. These figures indicate that the method is applicable to high-rise buildings.
4. Experimental Verification
4.1. Experiments
A series of experiments was performed to verify the performance of our approach. We designed a five-story shear frame model (Figure 13 (left)).
The story mass was the mass of the aluminum floor slabs (2.43 kg for each floor).
The story stiffness was taken to be that of the bronze plate springs (0.0025 × 0.03 × 0.24 m3) used as the columns. Young’s modulus of bronze is 1 × 10¹¹ N/m2, so the interfloor stiffness was 1.3563 × 10⁴ N/m. The structure was initially healthy with all the original columns intact.
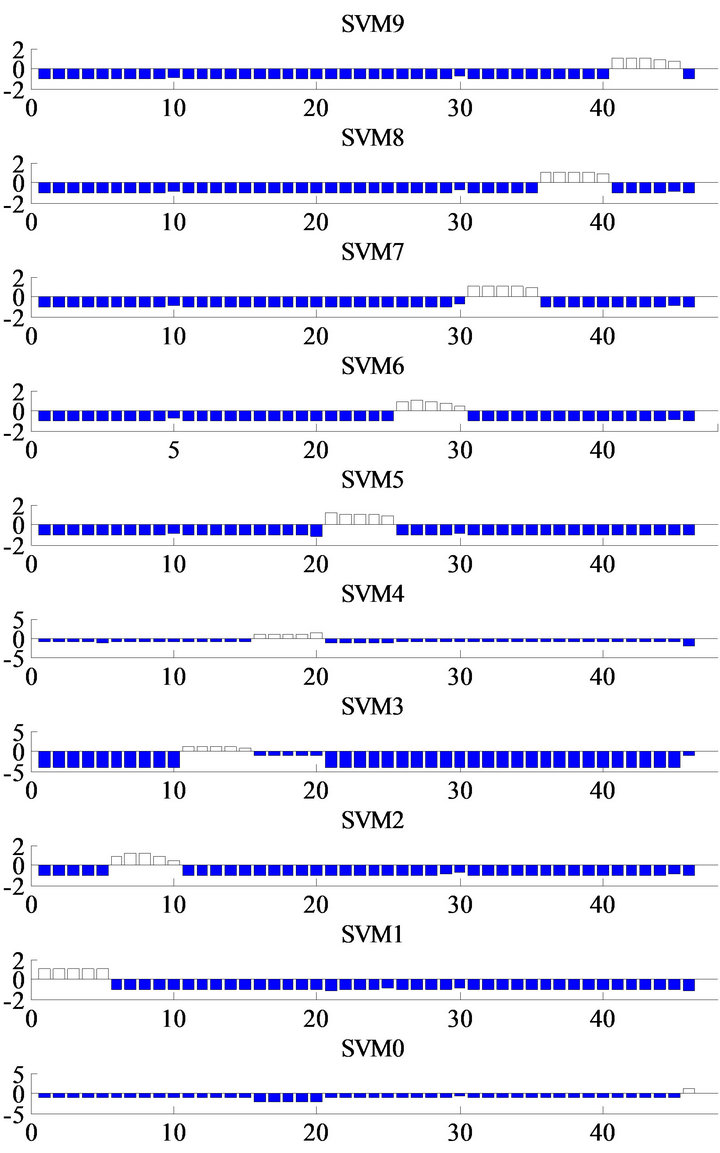
Figure 9. Outputs from SVM0 through 9 with two damage location indicators for a nine-story shear structure (no noise).
The damage was simulated in the experiment by replacing the original columns with weaker ones (0.003 × 0.006 × 0.24 m3; see Figure 13 (right)). Replacing two columns in each story reduced the story stiffness by 32.72%.
The basement of the structure was set on bearings so that the structure could experience ground motion. The force input to the structure was provided with an electrodynamic shaker. One acceleration sensor was installed in the basement to measure the ground motion.
Sensors installed on each floor plate were used to measure the acceleration responses of each floor. First, the structure was measured in the healthy state with all the original columns. The shaker provided the force input to the structure in order to obtain the acceleration data.
Then, two columns of one floor were replaced with weaker columns to simulate single-story damage cases on each story. The shaker provided the same excitation again, and the accelerometers measured the acceleration data of the damaged structure.
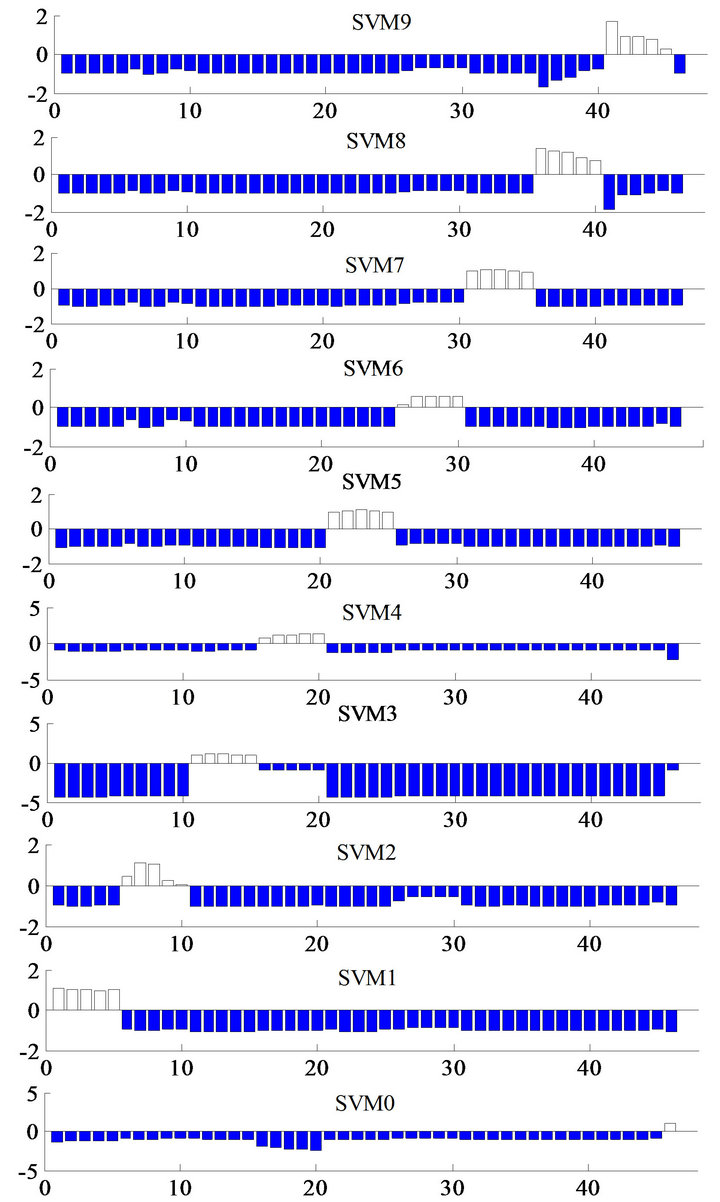
Figure 10. Outputs from SVM0 through 9 with two damage location indicators for a nine-story shear structure (5% noise).
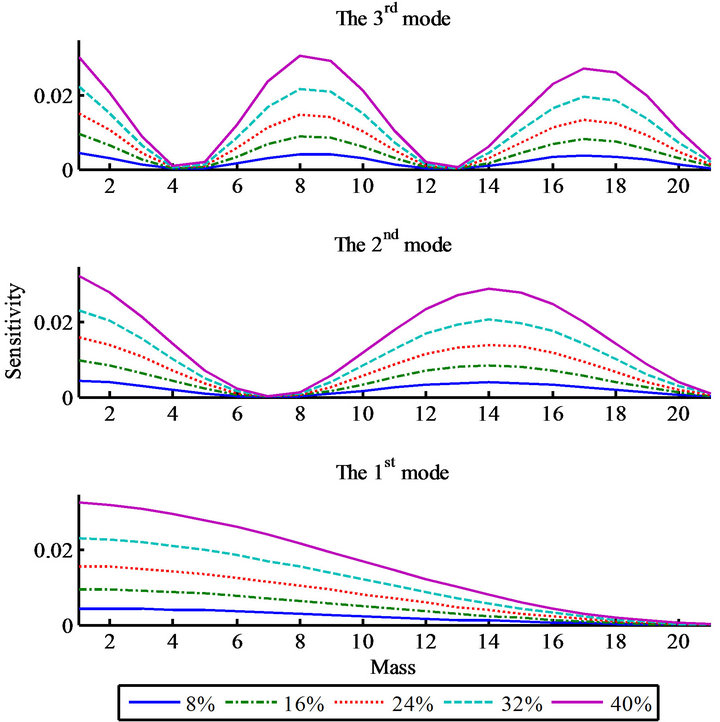
Figure 11. Sensitivity of the first three natural frequencies when damage occurred in 21-story shear structures with different masses.
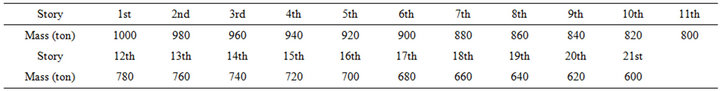
Table 1. Mass of twenty-one-story structure.
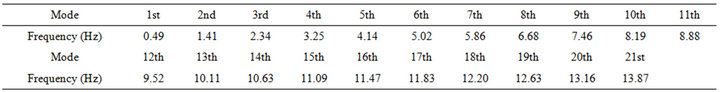
Table 2. Undamaged natural frequencies of twenty-one-story structure.
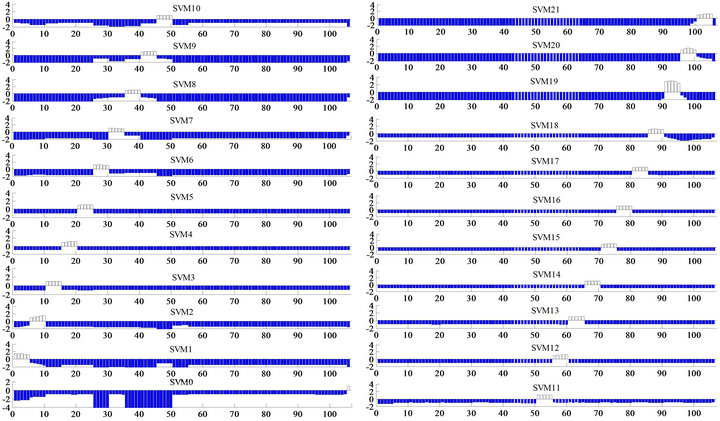
Figure 12. Outputs from SVM0 through 21 with two damage location indicators of twenty-one-story shear structure.
4.2. Verification Results
Although accelerators were installed on all stories, only the data from the top and bottom sensors were used to obtain the modal frequencies. The modal frequencies were calculated from the time histories of the vibration experiments by using the subspace identification method devised by Verhaegen and Dewilde [20].
The feature vectors were formed from damage location indicators that were made by feeding identified modal frequencies to SVM0 and SVMi (i = 1, 2,···, 5). These SVMs were constructed by training feature vectors explained in Part 3.1.
Figure 14 shows the results of the experimental verification. The data number corresponds to the damaged story; data number 6 indicates the undamaged case. This figure shows there were no miss-classifications. We may conclude that the proposed method is applicable to realistic problems.
5. Conclusion
A damage detection method using Support Vector Machine (SVM) and only the first three natural frequencies of translational modes was proposed. This method was able to determine the location of damage in any story of a shear building with only two vibration sensors, one on the ground detecting an input and the other on the roof, detecting an output to obtain modal frequencies. As we need only three modes, if the input lasts long and the
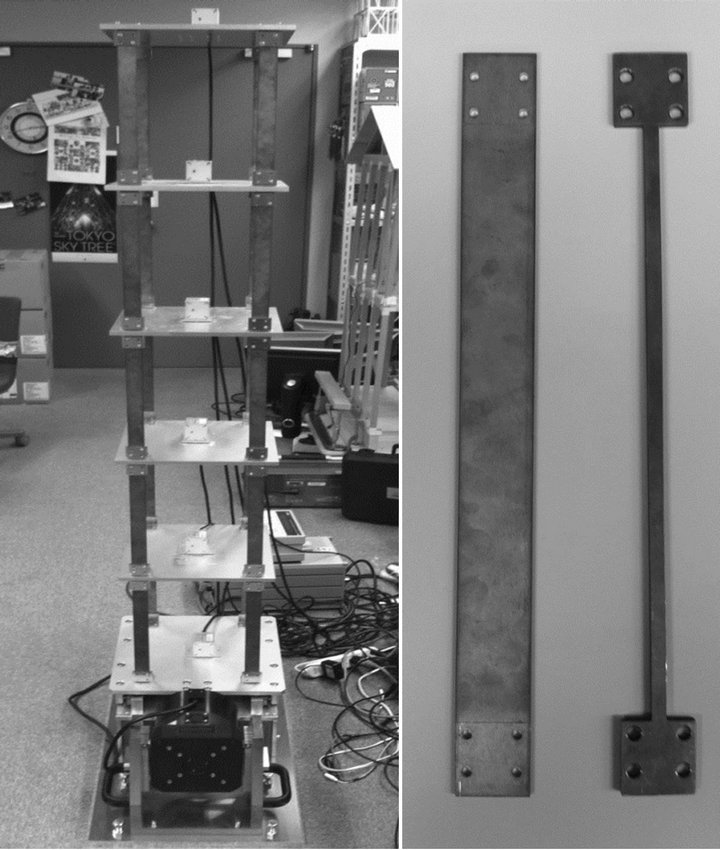
Figure 13. Experimental setup of a five-story steel model (left) with undamaged and “damaged” columns (right).
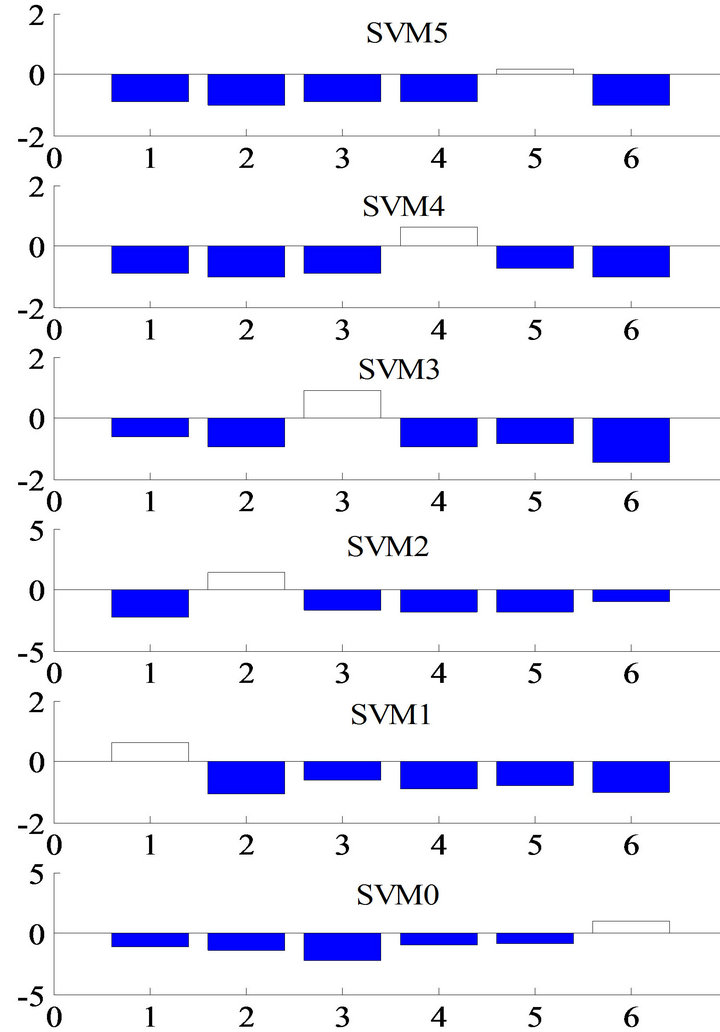
Figure 14. SVM outputs for experimental data.
spectrum is flat, we may identify those parameters using the output data. If that is the case, the proposed method needs only one sensor. The damage location indicators were formed in terms of the ratio of the change in the first three natural frequencies and used as new feature vectors for SVM. Simulations of five-story, nine-story and twenty-one-story shear structures and experiments on five-story steel model were used to test the performance of the proposed method.
6. Acknowledgements
This work was supported in part by a Grant-in-Aid No. 22310103 (PI: A. Mita) and Grant-in-Aid to the Global Center of Excellence Program for the “Center for Education and Research of Symbiotic, Safe and Secure System Design” from the Ministry of Education, Culture, Sport, Science and Technology of Japan.
REFERENCES
- A. Mita, “Structural Dynamic for Health Monitoring,” Sankeisha Co., Ltd, Nagoya, 2003.
- O. S. Salawu, “Detection of Structural Damage through Changes in Frequency: A Review,” Engineering Structures, Vol. 19, No. 9, 1997, pp. 718-723. doi:10.1016/S0141-0296(96)00149-6
- S. Doebling, et al., “Damage Identification and Health Monitoring of Structural and Mechanical Systems from Changes in Their Vibration Characteristics: A Literature Review,” Los Alamos National Laboratory, Los Alamos, 1998.
- N. Stubbs, T. H. Broome and R. Osegueda, “Non-Destructive Construction Error Detection in Large Space Structures,” AIAA Journal, Vol. 28, No. 1, 1990, pp. 146- 152. doi:10.2514/3.10365
- Z. Xing and A. Mita, “A Substructure Approach to Local Damage Detection of Shear Structure,” Structural Control and Health Monitoring, Vol. 19, No. 2, 2011, pp. 309-318. doi:10.1002/stc.439
- J. Sidhu and D. J. Ewins, “Correlation of Finite and Model Test Studies of a Practical Structure,” Proceedings of the 2nd International Modal Analysis Conference, Society for Experimental Mechanics, USA, 1984, pp. 756- 762.
- H. P. Zhu and Y. L. Xu, “Damage Detection of MonoCoupled Periodic Structures Based on Sensitivity Analysis of Modal Parameter,” Journal of Sound and Vibration, Vol. 285, No. 1-2, 2005, pp. 365-390. doi:10.1016/j.jsv.2004.08.012
- A. Messina, E. J. Williams and T. Contursi, “Structural Damage Detection by a Sensitivity and Statistical-Based Method,” Journal of Sound and Vibration, Vol. 216, No. 5, 1998, pp. 791-808. doi:10.1006/jsvi.1998.1728
- B. Samanta, K. B. Al-Balushi and S. A. Al-Araimi, “Artificial Neural Networks and Support Vector Machines with Genetic Algorithm for Bearing Fault Detection,” Engineering Applications of Artificial Intelligence, Vol. 16, No. 7-8, 2003, pp. 657-665. doi:10.1016/j.engappai.2003.09.006
- D. Meyer, F. Leisch and K. Hornik, “The Support Vector Machine under Test,” Neurocomputing, Vol. 55, No. 1-2, 2003, pp. 169-186. doi:10.1016/S0925-2312(03)00431-4
- A. Mita and H. Hagiwara, “Quantitative Damage Diagnosis of Shear Structures Using Support Vector Machine,” KSCE Journal of Civil Engineering, Vol. 7, No. 6, 2003, pp. 683-689. doi:10.1007/BF02829138
- M. Shimada and A. Mita, “Damage Assessment of Bending Structures Using Support Vector Machine,” Smart Structures and Material 2005: Sensors and Smart Structures Technologies for Civil, Mechanical and Aerospace, San Diego, 2005, pp. 923-930.
- M. Shimada, A. Mita and M. Q. Feng, “Damage Assessment of Structures Using Support Vector Machines under Various Boundary Conditions,” Smart Structures and Material 2006: Sensors and Smart Structures Technologies for Civil, Mechanical and Aerospace Systems, San Diego, 2006.
- R. Taniguchi and A. Mita, “Support Vector Machine Based Active Damage Detection Method,” Proceedings of the 4th International Workshop on Structural Health Monitoring, Stanford University, Stanford, 2003, pp. 749- 756.
- A. Mita and A. Fujimoto, “Active Active Detection of Loosened Bolts Using Ultrasonic Waves and Support Vector Machines,” Proceeding of the 5th International Workshop on Structural Health Monitoring, Stanford University, Stanford, 2005, pp. 1017-1024.
- J. E. Luco, H. L. Wong and A. Mita, “Active Control of the Seismic Response of Structures by Combined Use of Base Isolation and Absorbing Boundaries,” Earthquake Engineering and Structural Dynamics, Vol. 21, 1992, pp. 525-541. doi:10.1002/eqe.4290210606
- H. Zhu and M. Wu, “The Characteristic Receptance Method for Damage Detection in Large Mono-Coupled Periodic Structures,” Journal of Sound and Vibration, Vol. 251, No. 2, 2002, pp. 241-259. doi:10.1006/jsvi.2001.3988
- V. N. Vapnik, “The Nature of Statistical Learning Theory,” Springer, Berlin, 1995. doi:10.1007/978-1-4757-2440-0
- N. Christianini and J. Shawe-Taylor, “Support Vector Machines and Other Kernel-Based Learning Methods,” Cambridge University Press, Cambridge, 2000.
- M. Verhaegen and P. Dewilde, “Subspace Model Identification Part 1: The Output-Error State-Space Model Identification Class of Algorithms,” International Journal of Control, Vol. 56, No. 5, 1992, pp. 1187-1210. doi:10.1080/00207179208934363
NOTES
* Corresponding author