Open Journal of Civil Engineering
Vol. 2 No. 2 (2012) , Article ID: 20131 , 6 pages DOI:10.4236/ojce.2012.22013
Urban Growth Prediction Modelling Using Fractals and Theory of Chaos
Laboratory of Soils and Agricultural Chemistry, Agricultural University of Athens, Athens, Greece
Email: trdimitrios@gmail.com
Received March 1, 2012; revised April 5, 2012; accepted April 19, 2012
Keywords: Urban Growth Prediction; Fractals; Chaos Theory; Sierpinski Carpet; Pogonia
ABSTRACT
Urban growth prediction has acquired an important consideration in urban sustainability. An effective approach of urban prediction can be a valuable tool in urban decision making and planning. A large urban development has been occurred during last decade in the touristic village of Pogonia Etoloakarnanias, Greece, where an urban growth of 57.5% has been recorded from 2003 to 2011. The prediction of new urban settlements was achieved using fractals and theory of chaos. More specifically, it was found that the urban growth is taken place within a Sierpinski carpet. Several shapes of Sierpinski carpets were tested in order to find the most appropriate, which produced an accuracy percentage of 70.6% for training set and 81.8% for validation set. This prediction method can be effectively applied in urban growth modelling, once cities are fractals and urban complexity can be successfully described through a Sierpinski tessellation.
1. Introduction
Fractals are dynamic objects, where their geometry depends on an evolutionary process. An important characteristic of fractals is the complexity of spatial objects which it can be described by self-similarity and scaledependence [1]. Science is at the edge between reality and mind [2]. Although the complexity which exists in nature, science must adopt some simplifications (Occam’s razor plays an important role for selecting the simplest explanation) in order to achieve a better representation of natural phenomena. Instead of retrieving complexity with simplicity, multiplicity may be an alternative aspect of handling real world. This means that an intermediate approach is followed where an occasion is divided in many simple parts, where a solution close to reality is obtained (complexity: difficult to understand, simplicity: easy to understand, multiplicity: closer to reality).
Fractal geometry, developed by Mandelbrot [3], is a widely used mathematical development in the 20th century [4]. The mathematical objects in fractal geometry can take intermediate dimensions (e.g. 1.65) unlike Euclidean geometry with integer values. The idea of fractal can be easily understood if we consider an object which appears the same in any scale, e.g. clouds or costlines. Urban areas (villages and cities) can be considered as complex dynamic systems, where their spatial pattern is determined by land use dynamics within the self-organized urban system. Fractal theory deals with the non-linear complexity of urban spatial structural form [5,6]. The urban complexity refers to the non-linear relationships between different components of the urban structure, where order and chaos are the two sides of the same coin, which are alternated within the self-organized urban system. Selforganization in urban systems refers to the ability of the system to re-organize its spatial urban components with an endogenous force. In a self-organized system, the local non-linear interactions of the system components lead to a specific global structure. Self-organization should be seen as the adaptive response of a system to external conditions, rather than an isolated network of individuals where only interrelationships are considered [7]. In selforganization, the interactions between constituent elements (low level rules) are sufficient to create high overall change [8,9]. The urban system behaves unexpectedly when it is fragmented and partially examined. This behaviour lies on the fact that the parts produced are components of a self-organized system and they must be treated as a whole system and not as autonomous parts [10,11].
[12] applied fractal dimension in order to measure the degree of irregularity of land uses which describe urban morphology. [13,14] analyzed the urban spatiotemporal evolution using relationships between urban area and population size, which have been proved to conform to the law of allometric growth [2]. In general, allometric growth indicates that the rate of the relative growth of an organ is a constant fraction of the relative growth of the total organism [15]. [6] used a Minkowski dilation in order to define the morphological boundaries of urban agglomeration, following by a distance threshold which corresponds to the break point of the existence of spatial discontinuity of urban structures and stops the dilation process. Analysis of landscape metrics, which express the fractal geometry of objects, has been used to describe urban land use dynamics and to support the analysis of urban growth [16,17]. [18] used the landscape metrics: contagion intex and fractal dimension, in order to detect urban land use changes and analyse urban growth.
Fractal structures are produced by iterations of the same principle in a given pattern of points, lines or surfaces by subtracting parts at a fixed quantity. Self similarity at different scales (tend to infinity) is the main characteristic of these repetitions. The Sierpinski carpet, a generalization of the Cantor set in two dimensional space, is a fractal construction developed by Sierpinski in 1916. The Sierpinski carpet is going to be used in this research in order to find areas, which are more suitable for urban development, once urban development follows a fractal shape.
Urban growth in the touristic village of Pogonia Etoloakarnanias, western Greece, is examined in this research paper. A large percentage of urban growth has been occurred the last 8 years (2003-2011). More specifically, the house settlements increased 57.5% during this period due to touristic development [19]. A stochastic method of considering the importance of neighbourhood interactions between urban structures by using the network or distances between them was applied in order to model urban growth [19]. Because, as [19] has remarked, the application of deterministic variables, which influence urban growth, has not produced satisfactory results in urban modelling comparing with stochastic methods, fractal approach is going to be used in this current research in order to predict the candidate areas for urban development.
The objective of this paper is to divide the study area using fractal methods (Sierpinski tessellation) in order to predict future urban growth. The areas which remain after Sierpinski carpet abstraction iterations have the potential to be urbanized, following their fractal distributional principle.
2. Study Area and Methodology
2.1. Study Area
The touristic village of Pogonia, Etoloakarnanias, in western Greece is the study area (Figure 1). It is specified by Xmin: 224,994 m, Xmax: 226,221 m and Ymin: 4,297,944 m, Ymax: 4,299,157 m (Greek Grid). Two urban land use maps produced for the years 2003 and 2011 were used for studying urban growth. 50 more urban settlements were built during this period, making a total number of 192 urban settlements today.
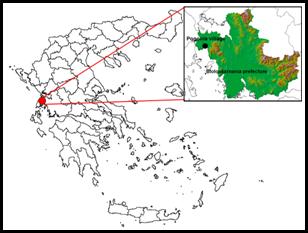
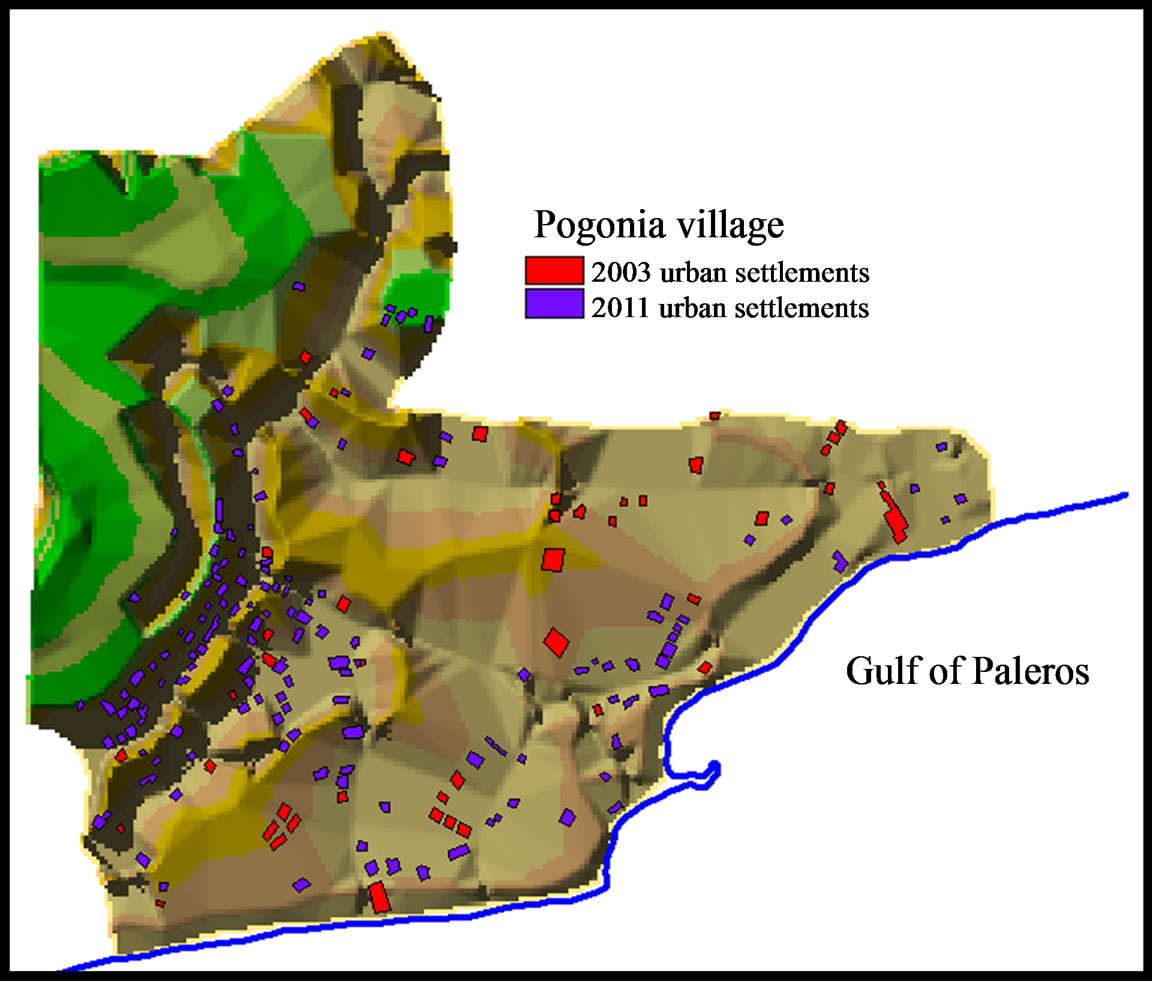
Figure 1. Study area (Pogonia village).
This rapid expansion of urbanization in this small village (57.5% area increase) is very interesting not only for scientific purposes, but also for local community. Therefore, local authorities must take into account this rapid urban trend, trying to keep sustainability of natural resources and local traditions along with hospitality of touristic development opportunity [19].
2.2. Fractal Geometry
Euclidean geometry is largely descriptive and is difficult to represent the urban growth explicitly [2]. It works with objects in integer dimensions, e.g. points: zero dimension (0D), lines: one dimension (1D), surfaces: two dimensions (2D) and space: three dimensions (3D). However many objects in nature can be described by dimensions between these sharp values of Euclidean geometry. For example, a straight line in Euclidean geometry takes a dimension of 1, while a fractal curve can take dimension between 1 and 2 depending on how much space it covers as it curves and spins. If a fractal curve tends to fill a plane, then the fractal dimension goes to two. Moreover, a fractal landscape with rough hills would approach the third dimension.
2.3. Sierpinski Carpet
To build the Sierpinski carpet, we start with a square (iteration 1). We continue dividing each square into nine equal squares, abstracting the middle one. This is the generator of the construction. In Figure 2, four iterations of the Sierpinski carpet are presented, where the squares remained are: 1, 8, 64 and 512 respectively.
Let Nn be the number of remained boxes (Nn = 8n), Ln the length of a side of a blank box (Ln = (1/3)n) and An the area of remained boxes after nth iteration (An = 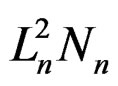 = (8/9)n). The total area when the iterations go to infinity is zero according to the Equation (1):
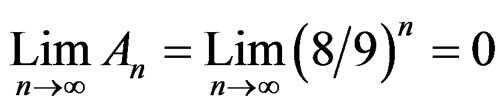 (1)
(1)
The fractal dimension of Sierpinski carpet is calculated as follows [2]. Because in the fractal shape there is 8 identical figures which each of them need to be magnified 3 times in order to get the entire image, the fractal dimension is log8/log3, i.e. approximately 1.89.
A similar geometric object can also be constructing by adding squares using a generator code. In Figure 3, three iterations are presented, where a more complicated shape is produced by adding cross-squared parts.
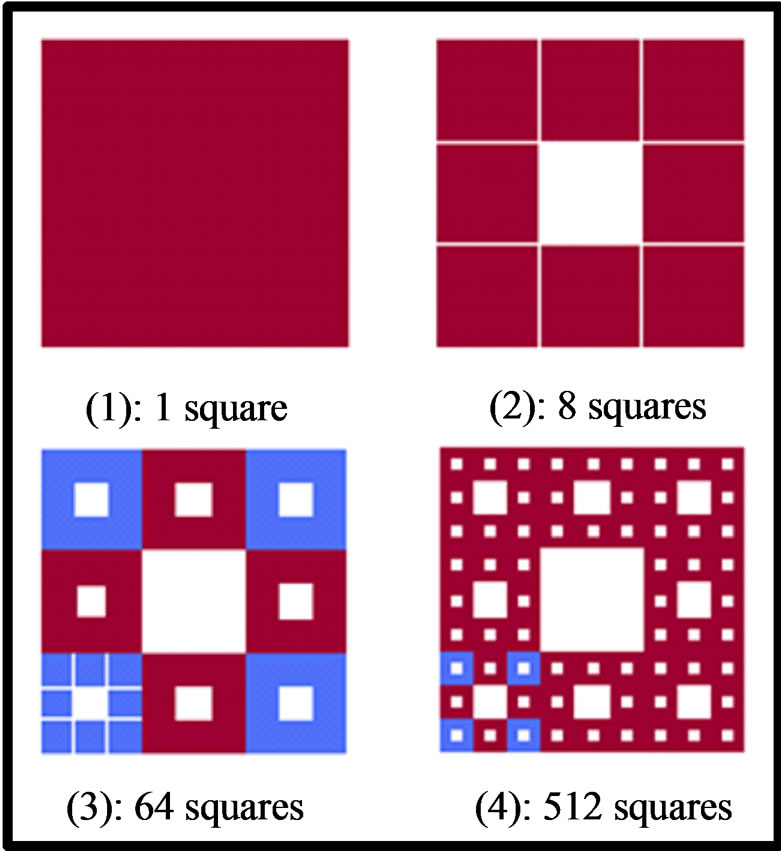
Figure 2. Sierpinski carpet construction (1).
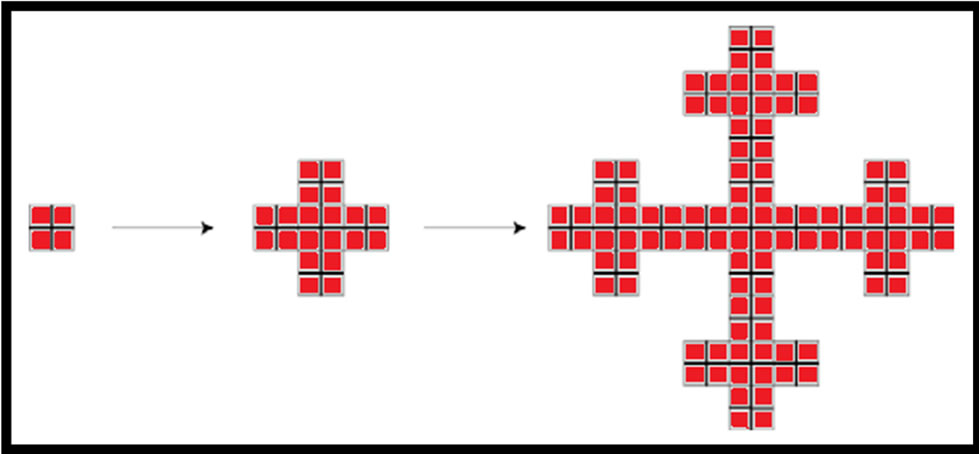
Figure 3. Sierpinski carpet construction (2).
Urbanization process can be easily understood using the example in Figure 3. Let us assume that a town at iteration 0 having a square-like shape. At the next iteration, districts are added to the town along its four sides. The same process is continuing in the next generations, creating a city-shaped structure [20].
The current research is going to be based to this Sierpinski carpet tessellation of space. It is assumed that the urban growth is taken place within the red-shaded rectangles of Figure 2, adopting a fractal distributional structure.
2.4. Model Development
The idea of model development is based in the concept that the urban growth is taken place within the areas produced by Sierpinski carpet tessellation of study area. Therefore, a Sierpinski carpet is produced for many iterations. The centre of the rectangle in iteration 1 is selected according to an empirical method. This method estimates the centroid of the study area according to the density of urban settlements in 2003. Thus, the average X-coordinate and Y-coordinate of the study area centroid is calculated taking into account all the X and Y coordinates of the centroids of urban settlements. This point is the start point for building the Sierpinski carpet.
For producing the Sierpinski carpet, several rectangles with different shapes instead of squares are tested in order to find the most appropriate, which produces the best accuracy for the developed areas (urban settlements) in training set of 2011. More specifically, after tessellation, the Sierpinski carpet is overlaid with the land use map of 2011 (validation set) in order to estimate the accuracy percentage of the prediction. The urban settlements are drawn as points, which represent the centroid of each building.
In Figure 4 the design of model development, which contains four steps, is presented. In the first step, the centroid of study area is calculated using buildings of 2003. Sierpinski carpets of different size are drawn using the centroid of study area as starting point of the first rectangle. In step 3, the buildings of 2011 are presented in relation with the starting point of Sierpinski tessellation.
Finally, an overlay is taken place between the buildings of 2011 and the Sierpinski carpet in order to calculate the percentage accuracy of the urban growth predicttion. As it has been already mentioned, the buildings of 2011 are divided in two sets: training set and validation set. 80% of the total number of points-buildings of 2011 is considered as training set, while the remaining 20% as validation set.
3. Results and Discussion
After calculating the centroid of study area, a number of Sierpinski carpets are produced using as centre of the first rectangle this centroid of study area. The accuracy of the urban growth prediction is calculated by overlaying the Sierpinski carpet and the land use map of 2011 and measuring the number of points (urban settlements) which are situated within the remaining area of Sierpinski carpet after each iteration.
The construction of Sierpinski carpet does not seem to follow a specific rule. That is, the dimensions of the rectangles cannot be predefined and therefore their suitability is tested with the accuracy after the land use map of 2011 (training set) is overlaid. Random shapes of rectangles were tested in order to find the most appropriate. The best accuracy percentage of urban growth is achieved using a Sierpinski carpet with dimensions of the first rectangle 700 × 900 m (1st iteration). The middle rectangle of 233.3 × 300 m is abstracting in 2nd iteration, while the missing rectangle of 3rd and 4th iterations are 77.8 × 100 m and 25.9 × 33.3 m respectively and so on (Figure 5).

Figure 4. Design of model development.
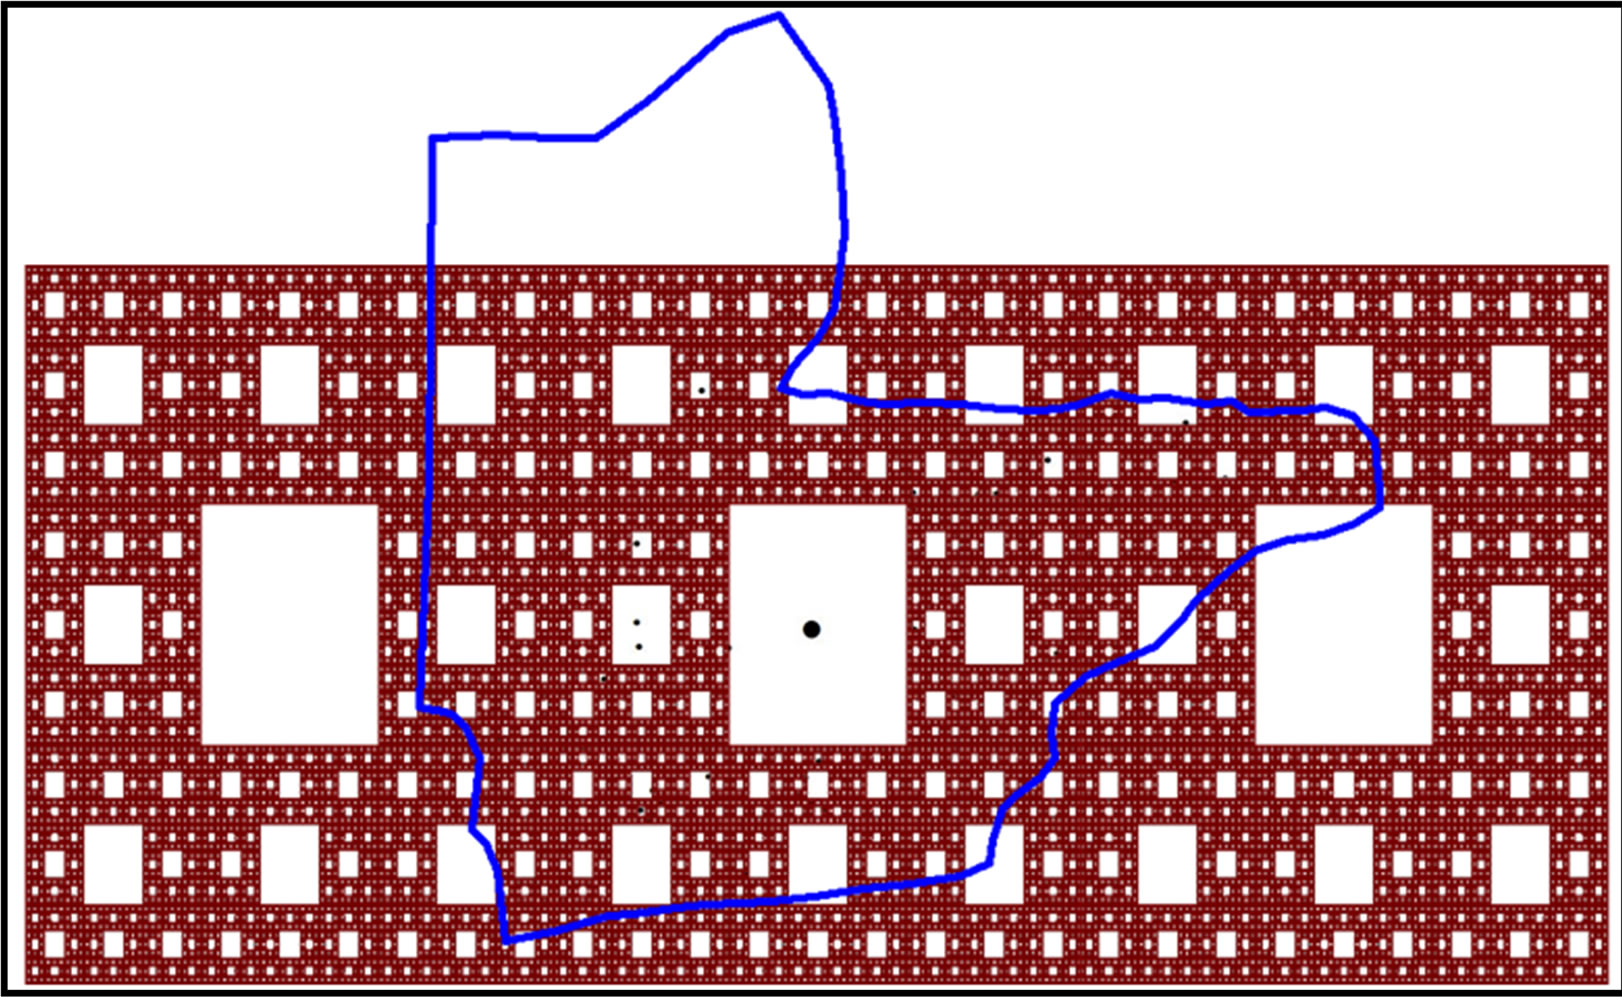
Figure 5. Results of urban growth prediction in 2011.
The accuracy of the urban growth prediction in 2011 for both sets (training and validation sets) is calculated from the points-buildings which are fallen within the shaded area of Sierpinski carpet. The results are graphically presented in Figure 6.
Increasing iterations, the accuracy reaches their lower value rapidly. As Figure 6 presents, from 5th iteration and beyond, all the points-buildings from both training and validation sets are completely situated with Sierpinski carpet (the accuracy remains the same). The accuracy after 5th iteration is 70.6% for training set and 81.8% for validation set, which is considered quite satisfactory.
Therefore, it can be concluded that the majority of buildings (considered as points) are situated in a fractal space which its area tends to zero after infinite division (infinite iterations). This can be explained by fractal dimension of the Sierpinski carpet. Because its fractal dimension is 1.89, the shape is neither a plane (11% divergence from being a plane) nor a line (89% divergence from being a line). The two limits, zero and infinity belongs to plane (iteration 1) and line (infinite iterations) respectively. Therefore, in infinite iterations, the area is disappeared (line).
Sharp values of Euclidean topological dimensions (D = 1, 2, 3) are not found in nature. Urbanization like any natural phenomenon follows a fractal structure in its development.
4. Conclusions
An urban growth model was developed in this current research paper using fractals and theory of chaos. Once urban areas are fractals and urbanization follows a fractal shape development, urban growth was considered that takes place within a fractal space of Sierpinski carpet.
After testing different shapes of Sierpinski carpets, it was found that the majority of buildings were situated within Sierpinski carpet. More specifically, after 5th iteration of Sierpinski carpet tessellation, the accuracy reaches its final value for both training and validation sets. Because of the satisfactory value of urban growth prediction, this paper proposes an alternative approach of urban growth modelling and generally land use change modelling based on the fractal urban structure.
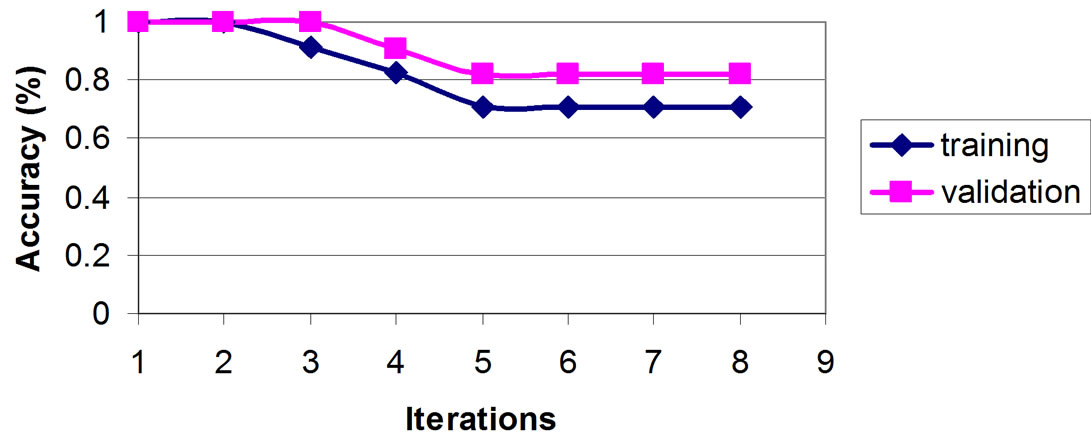
Figure 6. Accuracy percentage in different iterations in training and validation sets.
All objects in nature are better explained using its fractal shape. Therefore, adopting methods of chaos theory could give a more representative way of thinking spatiotemporally. Because fractals have not been widely examined in land use modelling, there is enough room for future research based on this scientific field.
5. Acknowledgements
I am grateful to Said Farah for his tremendous support which helped me to collect the topographic data.
REFERENCES
- J. I. Barredo, M. Kasanko, N. McCormick and C. Lavalle, “Modelling Dynamic Spatial Processes: Simulation of Urban Future Scenarios through Cellular Automata,” Landscape and Urban Planning, Vol. 64, No. 3, 2003, pp. 145-160. doi:10.1016/S0169-2046(02)00218-9
- M. Batty and P. A. Longley, “Fractal Cities: A Geometry of Form and Function,” Academic Press, London, 1994.
- B. B. Mandelbrot, “The Fractal Geometry of Nature,” W. H. Freeman and Company, New York, 1983.
- B. T. Milne, “The Utility of Fractal Geometry in Landscape Design,” Landscape and Urban Planning, Vol. 21, No. 1-2, 1991, pp. 81-90. doi:10.1016/0169-2046(91)90034-J
- I. Thomas, P. Frankhauser and C. Biernacki, “The Morphology of Built-Up Landscapes in Wallonia (Belgium): A Classification Using Fractal Indices,” Landscape and Urban Planning, Vol. 84, No. 2, 2008, pp. 99-115. doi:10.1016/j.landurbplan.2007.07.002
- C. Tannier, I. Thomas, G. Vuidel and P. Frankhauser, “A Fractal Approach to Identifying Urban Boundaries,” Geographical Analysis, Vol. 43, No. 2, 2011, pp. 211-227. doi:10.1111/j.1538-4632.2011.00814.x
- P. M. Allen, “Cities and Regions as Self-Organizing Systems: Models of Complexity,” Gordon and Breach, New York, 1997.
- M. Batty, “New Ways of Looking at Cities,” Nature, Vol. 377, No. 6550, 1995, p. 574. doi:10.1038/377574a0
- F. Wu, “An Experiment on the Generic Polycentricity of Urban Growth in a Cellular Automatic City,” Environment and Planning B: Planning and Design, Vol. 25, No. 5, 1998, pp. 731-752. doi:10.1068/b250731
- S. Berling-Wolff and J. Wu, “Modeling Urban Landscape Dynamics: A Case Study in Phoenix, USA,” Urban Ecosystems, Vol. 7, No. 3, 2004, pp. 215-240. doi:10.1023/B:UECO.0000044037.23965.45
- L. Poelmans and V. A. Rompaey, “Complexity and Performance of Urban Expansion Models,” Computers, Environment and Urban Systems, Vol. 34, No. 1, 2010, pp. 17-27. doi:10.1016/j.compenvurbsys.2009.06.001
- M. Batty and P. A. Longley, “The Morphology of Urban Land Use,” Environment and Planning B: Planning and Design, Vol. 15, No. 4, 1988, pp. 461-488. doi:10.1068/b150461
- Y. Chen and S. Jiang, “An Analytical Process of the Spatio-Temporal Evolution of Urban Systems Based on Allometric and Fractal Ideas,” Chaos, Solitions & Fractals, Vol. 39, No. 1, 2009, pp. 49-64. doi:10.1016/j.chaos.2007.01.130
- Y. Chen and J. Lin, “Modeling the Self-Affine Structure and Optimization Conditions of City Systems Using the Idea from Fractals,” Chaos, Solitions & Fractals, Vol. 41, No. 2, 2009, pp. 615-629. doi:10.1016/j.chaos.2008.02.035
- M. J. Bechmann, “City Hierarchies and Distribution of City Sizes,” Economic Development and Cultural Change, Vol. 6, No. 3, 1958, pp. 243-248. doi:10.1086/449769
- M. Herold, H. Couclelis and K. C. Clarke, “The Role of Spatial Metrics in the Analysis and Modeling of Urban Land Use Change,” Computers, Environment and Urban Systems, Vol. 29, No. 4, 2005, pp. 369-399. doi:10.1016/j.compenvurbsys.2003.12.001
- K. C. Seto and M. Fragkias, “Quantifying Spatiotemporal Patterns of Urban Land Use Change in Four Cities of China with Time Series Landscape Metrics,” Landscape Ecology, Vol. 20, No. 7, 2005, pp. 871-888. doi:10.1007/s10980-005-5238-8
- M. Herold, J. Scepan and K. C. Clarke, “The Use of Remote Sensing and Landscape Metrics to Describe Structures and Changes in Urban Land Uses,” Environment and Planning A, Vol. 34, No. 8, 2002, pp. 1443-1458. doi:10.1068/a3496
- Self-Reference Is Omitted to Facilitate the Blind Review.
- P. Frankhauser, “Comparing the Morphology of Urban Patterns in Europe—A Fractal Approach,” In: A. Borsdorf and P. Zambri, Eds., European Cities—Insights and Outskirts, Report COST Action 10 Urban Civil Engineering, Structures, Brussels, Vol. 2, 2004, pp. 79-105.