Open Journal of Biophysics
Vol.07 No.03(2017), Article ID:77476,12 pages
10.4236/ojbiphy.2017.73011
Multispectral Imaging in Combination with Multivariate Analysis Discriminates Selenite Induced Cataractous Lenses from Healthy Lenses of Sprague-Dawley Rats
Peter Osei-Wusu Adueming1, Moses Jojo Eghan1, Benjamin Anderson1, Samuel Kyei2, Jerry Opoku-Ansah1, Charles L. Y. Amuah1, Samuel Sonko Sackey1, Paul Kingsley Buah-Bassuah1
1Laser and Fibre Optics Centre (LAFOC), Department of Physics, School of Physical Sciences, College of Agriculture and Natural Sciences, University of Cape Coast, Cape Coast, Ghana
2Department of Optometry, School of Allied Health Sciences, College of Health and Allied Sciences, University of Cape Coast, Cape Coast, Ghana

Copyright © 2017 by authors and Scientific Research Publishing Inc.
This work is licensed under the Creative Commons Attribution International License (CC BY 4.0).
http://creativecommons.org/licenses/by/4.0/


Received: May 18, 2017; Accepted: July 4, 2017; Published: July 7, 2017
ABSTRACT
Cataracts are the leading cause of blindness worldwide. Current methods for discriminating cataractous lenses from healthy lenses of Sprague-Dawley rats during preclinical studies are based on either histopathological or clinical assessments which are weakened by subjectivity. In this work, both cataractous and healthy lens tissues of Sprague-Dawley rats were studied using multispectral imaging technique in combination with multivariate analysis. Multispectral images were captured in transmission, reflection and scattering modes. In all, five spectral bands were found to be markers for discriminating cataractous lenses from healthy lenses; 470 nm and 625 nm discriminated in reflection mode whereas 435 nm, 590 nm and 700 nm discriminated in transmission mode. With Fisher’s Linear discriminant analysis, the midpoints for classifying cataractous from healthy lenses were found to be 14.718 × 10⁻¹⁴ and 3.2374 × 10⁻¹⁴ for the two spectra bands in the reflection mode and the three spectral bands in the transmission mode respectively. Images in scattering mode did not show significant discrimination. These spectral bands in reflection and transmission modes may offer potential diagnostic markers for discriminating cataractous lenses from healthy lenses thereby promising multispectral imaging applications for characterizing cataractous and healthy lenses.
Keywords:
Multispectral Imaging, Cataractous Lenses, Principal Component Analysis, Fisher’s Linear Discriminant Analysis

1. Introduction
Cataracts are the leading cause of visual impairment worldwide, accounting for more than 50% of blindness in developing countries [1] . Clinically, cataracts result in significant decrease of vision due to irreversible increase in absorption or scattering of light by the lens. [2] [3] . Most cataracts are age-related, though they have also been associated with diseases such as Uveitis, diabetes and congenital factors, and excessive exposure to ultraviolet radiation from the sun especially among tropical dwellers [4] . The global trend of aging populations presupposes that, the prevalence of cataracts would increase [5] .
Over the years, histopathological evaluation of stained tissue biopsies and autopsies by pathologist has been the golden standard for discriminating cataractous lens from healthy lens in preclinical studies [6] [7] [8] . The method relies on manual investigation of the tissue biopsies by pathologist which is beset with subjectivity [7] [8] . The process is laborious, time consuming and expensive. Considering such limitations, optical and spectroscopic modalities are more rigorous and objective than traditional pathologist interpretation as they provide a quantitative rather than qualitative assessment [9] [10] . Other microscopic techniques which have also been used to discriminate cataractous lens from healthy ones include Atomic Force microscopy (AFM), Transmission electron Microscopy (TEM) Scanning Electron Microscopy (SEM) [11] and Field Emission Scanning Electron Microscopy (FE-SEM) [12] . All these microscopic techniques produce single images on a sample. However multispectral imaging (MSI) provides multiple images on a sample from different excitation light sources and better information than these single imaging techniques.
Multispectral imaging is a technique which has been used in various applications to extract detailed information about an image [13] . The term refers to imaging systems that use a number of non-overlapping discrete spectral bands to highlight certain features within the field of view so that spatial as well as spectral information emanating from microscopic samples can be extracted within the optical region [14] [15] [16] . MSI is an emerging technology that integrates conventional imaging as well as spectroscopy to obtain both spatial and spectral information from a study area. It works on the principle that the recorded spectral is over all the spatial locations of the study area. MSI together with techniques such as fluorescence microscopy, point-scanning laser confocal microscopy and photoacoustic microscopy imaging [17] [18] [19] [20] [21] have been used to optically identify tissue irregularities [22] [23] [24] [25] . Examples are the identification of precise spectral band(s) for discrimination of infected red blood cells (iRBCs) from uninfected red blood cells (uRBCs) [26] and development of rapid multispectral endoscopic imaging system to map mucosa blood supply to the lungs [27] . MSI has also been used in a variety of applications including dentistry, dermatology, and histopathology [28] . To the best of our knowledge no studies have been done so far in applying MSI technique in cataract research. In this work cataractous lenses have been discriminated from healthy lenses of Sprague-Dawley rats using MSI in combination with multivariate analysis techniques. The purpose of this study was to apply a new method to study, analyse and discriminate cataractous and non-cataractous lens images of rats. This would be beneficial in veterinary ophthalmology and other ophthalmic applications.
2. Materials and Methods
2.1. Animals and Husbandry
Ten-day-old Sprague-Dawley rat pups of either sex with mean weight of 24.29 g were used for this research work. The pups together with their mothers were housed in polyacrylic cages (34 cm × 47 cm × 18 cm) with soft wood shavings as bedding, under ambient laboratory conditions (temperature 28˚C ± 2˚C, relative humidity 60% - 70%, and a normal light?dark cycle at the husbandry of the School of Biological Sciences, University of Cape Coast. The mothers were fed on a normal commercial pellet diet (Agricare Ltd, Kumasi, Ghana) and had access to water ad libitum.
2.2. Selenite Induction of Cataract in Pups and Tissue Preparation
The ten-day old pup rats were put into 2 groups consisting of 45 pup rats per group. One group (Group A) was kept as control while the other group (Group B) was injected subcutaneously daily with 15 mol kg−1 sodium selenite in normal saline on the 11th and 12th day respectively. The two groups (A and B) were monitored till the 30th day. On the 31st day, the crystalline lens of Group B were assessed for cataract development using a Marco II-B Slit Lamp (Marco-Lombart Instrument, Japan) after the pupils’ of the pups had been dilated with 1% tropicamide ophthalmic solution (Akorn Inc., lake Forest, USA). The rats with developed cataract, from early to fully developed, were sacrificed by ether inhalation, followed by intracardiac injection of pentobarbital. After enucleation, the lenses of the rats (Group A and Group B) were extracted and kept in different containers with formalin at room temperature. Forty four percent (44%) of Group A were selected to match up the number of Group B lenses for tissue preparation. The lenses were fixed in 10% phosphate-buffered paraformaldehyde, and embedded in paraffin. Sections of 3-μm thickness were made and stained with hematoxylin and eosin [29] and fixed on glass slides for microscopic image acquisition.
2.3. Image Acquisition and Data Processing
The imaging system used was a Multispectral Light Emitting Diodes Imaging Microscope system (MSLEDIM) at Laser and Fibre Optics Centre (LAFOC), Department of Physics, University of Cape Coast, Cape Coast, as implemented in Opoku-Ansah et al. and Brydegaard et al. [26] [30] . A MATrix LABoratory (Matlab) (R2014a Matlab 7.10.0, Mathworks Inc., USA) Graphical User interphase (GUI) program was used to control the LEDs, imager control and for image acquisition.
In acquiring the multispectral images of the of the Group A lens tissues, the 590 nm spectral band was used to adjust the camera settings with imaging parameters (i.e. the gain and the exposure time) for optimization. This spectral band was used as a standard due to the camera’s sensitivity. Grayscale images of each lens were captured in three modes (transmission, reflection and scattering) at all the 13 spectral bands and then saved as tagged image file format (TIFF). Thus, a total of 39 images were obtained for each lens. The image acquisition process was repeated for the Group B lens tissues. Pixel intensities of the images were extracted using Matlab codes for further analysis. A flow chart of the Matlab codes developed for pixel intensity extraction from the images, principal component and Fisher’s linear discriminant analysis is shown in Figure 1.
2.3.1. Principal Component Analysis
Principal Component Analysis (PCA) was applied in analysing the multispectral data using Matlab algorithm. The image intensity data, Z of m (4999) observations and n (5) variables was centered, Zc, such that the elements of the matrix of dimension m × n are around the sample mean of zero. The Zc was then converted into nonsingular covariant matrix, L, defined as
 (1)
(1)
where  denotes the matrix transpose of
 . The matrix, L was further transformed into a diagonal matrix K, using the relation
 (2)
(2)
where  contain the eigenvectors of L which indicates the contribution of each principal components (PCs) and
  is the transpose of
 . The associated eigenvalues of
  were plotted according to their size to obtain a scree plot which gave three PCs (PC1, PC2 and PC3) contributing a total of 99.6% of variability in the intensity data.
2.3.2. Fisher Linear Discriminant Analysis (FLDA)
Based on the three PCs (PC1, PC2 and PC3), the groups (Group A and Group B) were classified using the linear discriminant function
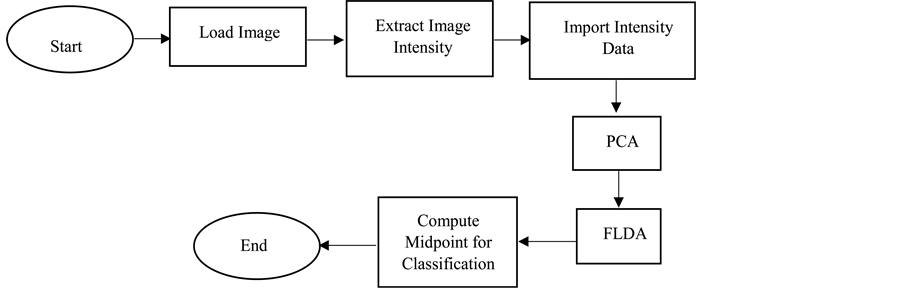
Figure 1. Flow chat for processing images of Group A and Group B lenses as well as performing principal component analysis (PCA) and Fisher’s linear discriminant analysis (FLDA).
 (3)
(3)
where  is the discriminant vector,
  and
and  are the average values of PC1, PC2 and PC3 from the two groups, Sc is the common covariance matrix of the two groups and PCx is the average PC values of the new lens to be classified.
A new observation PCxo is allocated to Group A, if
 (4)
(4)
where
 (5)
(5)
is the midpoint between two group averages, else PCxo is allocated to Group B if
 (6)
(6)
3. Results and Discussion
The images shown in Figure 2 are grayscale images of a Group A (left image) and Group B (right image) lens tissues captured at 590 nm spectra band in the transmission mode. The images have the same dimensions but different grayscales. Group A images show no evidence of disruption of the fibre cells that aid in more transmission and less reflection of the light and this contributes to the lens’ transparency. The spots found in the both images are artifacts.
Since the discrimination between the two (2) groups, in transmission, reflection and scattering modes, cannot be easily assessed by observation of the grayscale images, their averaged pixel intensities in each mode were extracted and plotted are shown in Figure 3. The averaged reflected pixel intensity values from Group A and Group B lenses are shown in Figure 3(a). The figure shows that Group A lenses are much higher at three (3) specific spectral bands 470 nm, 525 nm and 625 nm than that of Group B lenses. Also, these three (3) spectra bands are higher (>150 a.u) in both the Group A and Group B lenses compared to the other spectral bands. This is an indication that the lenses do reflects light intensities but much higher from 470 nm, 525 nm and 625 nm. This can be attributed to the smooth, clear and glassy nature of the Group A compared to the rough


Figure 2. Grayscale images of a Group (A) lens (left image) and a Group (B) lens (right image) captured in transmission mode using the MSLEDIM system at 590 nm spectral band.
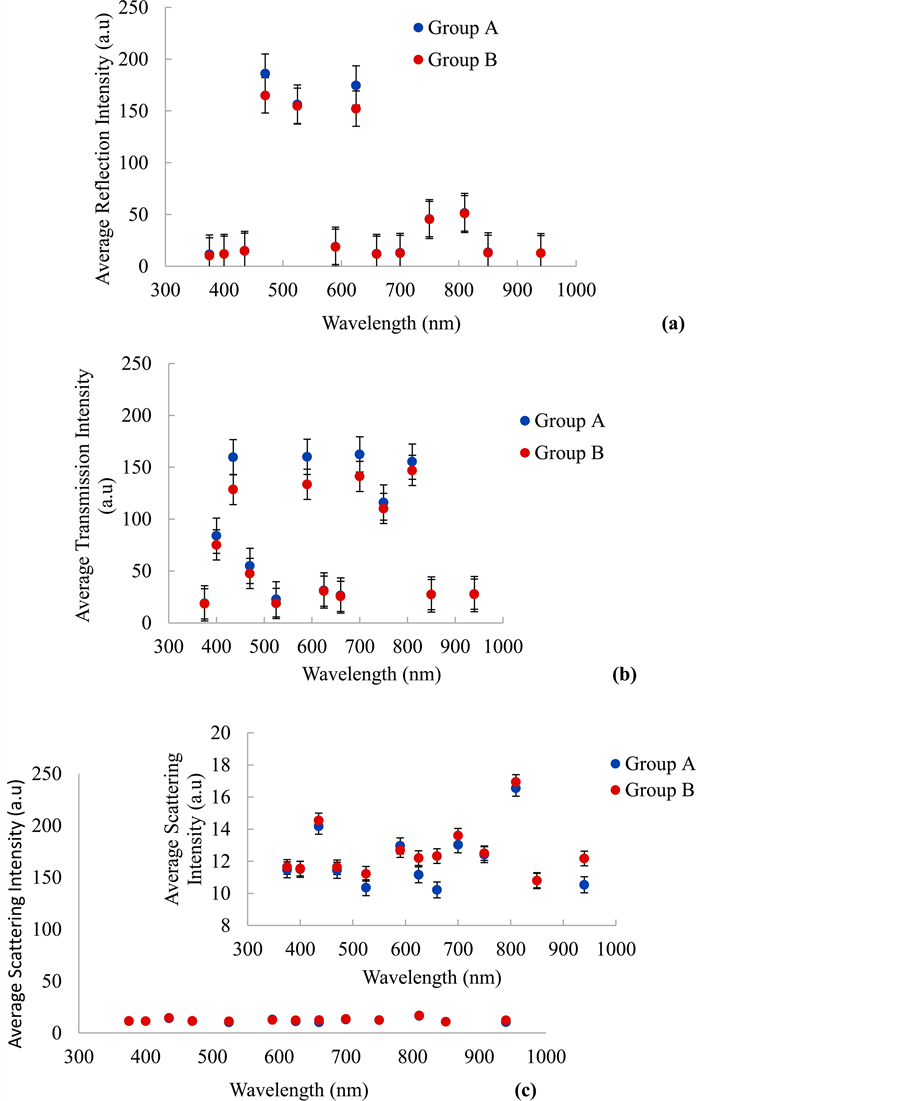
Figure 3. The average grayscale pixel intensities extracted from the images of Group A and B lenses in (a) reflection, (b) transmission and (c) scattering mode.
and wrinkled nature of the Group B lenses. The average reflected intensities from 470 nm and 625 nm also show differences between the Group A and Group B lenses. All the other spectral bands could not show significant differences between the Group A and Group B lenses. This is an indication that both 470 nm and 625 nm can be used as markers to discriminate Group A from Group B lenses using averaged reflected pixel intensity values.
The averaged transmitted pixel intensity values from the Group A and Group B lenses are shown in Figure 3(b). In the figure, pixel intensities of the transmitted light from Group A lenses depicts higher values compared to that of Group B. This can be attributed to the transparent nature of the Group A lenses. The transparency of the lens depends on its avascularity, paucity of organelles, narrow inter-fibre spaces and the regular organization of its cells and proteins [31] . At the cellular level, there is limited light-scattering by cellular organelles, which are relatively sparse in the central epithelium and displaced to the equator in the fibres, away from the light path. Within the fibre cells, the crystallins exist with a short-range order less than the wavelength of light, similar to that of glass. This is due to the small size of the protein molecules, less than 10 nm in diameter, and their close packing at high concentration [32] .
The average transmitted intensities from five (5) spectral bands, 435 nm, 590 nm, 700 nm, 750 nm and 810 nm are observed to be higher (>100 a.u) in both the Group A and Group B lenses compared to the other spectral bands which includes 375 nm, 400 nm, 470 nm, 525 nm, 625 nm, 660 nm, 850 nm and 940 nm. This indicates that the lenses can transmit enough light in all these spectral bands but much higher from 435 nm, 590 nm, 700 nm, 750 nm and 810 nm. The lower opacification of Group B lenses can be attributed to massive insolubilization of the soluble protein in the lens, which results in light scattering by the lens [33] [34] . On the other hand, Group B lenses are characterized by increased absorption and scattering of light resulting in decreased in transmission of light to the retina [35] . The average transmitted pixel intensities from 435 nm, 590 nm and 700 nm also showed substantial differences between Group A and Group B lenses. Average pixel intensity difference of 10 a.u was used as a criterion. This is an indication that these (3) spectral bands can be used to discriminate Group B from Group A lenses using averaged transmitted pixel intensity values.
The averaged scattered pixel intensity values from all the thirteen (13) spectral bands, as shown in Figure 3(c), were low (<20 a.u) in both Group A and Group B lenses. The intensity values ranges from 11 a.u to 17 a.u. These observations may be attributed to the poor scattering properties of the lenses. This shows the lenses of both groups exhibit similar characteristics when it comes to light scattering and it is independent of the spectral band. From the intensity values, shown in the insert in Figure 3(c), the differences between the two groups is insignificant for one to use scattering as a means for discriminating Group A from Group B lenses. Transmittance (T) and Reflectance (R) by Group A and Group B lenses were found to be wavelength depended. From theory R + T =1 and since the scattering effect is small as compared to Transmittance and Reflectance from the lenses, we can establish in this work that T =1 − (R * ρ) where ρ is a constant.
Scatter plots of the first three (3) PCs (PC1, PC2 AND PC3) of both Group A and Group B lenses in transmission and reflection mode are shown in Figure 4(a) and Figure 4(b) respectively. The three (3) PCs in the transmission mode were obtained from spectral bands of 435 nm. 590 nm and 700 nm, with eigen-
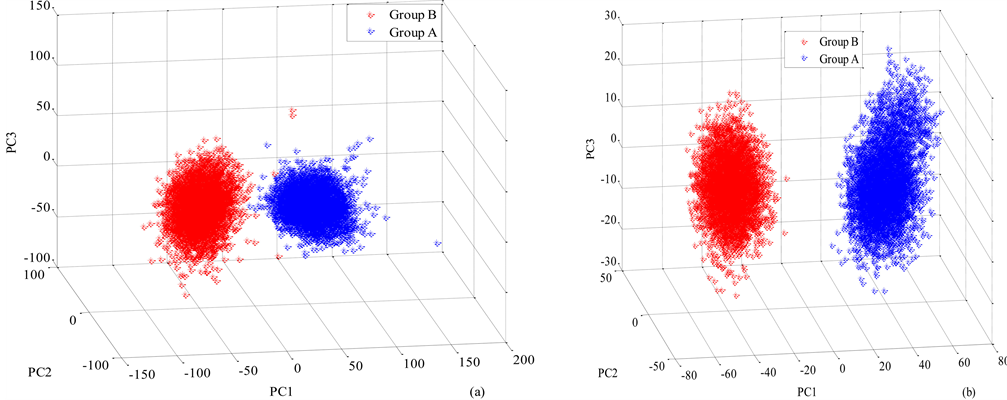
Figure 4. Scatter plot of the first three principal components of Group A and Group B lenses for (a) three transmission spectral bands (470 nm and 625 nm) (b) two reflection spectral bands (470 nm and 625 nm).
values describing 99.6 % of the variability dataset. The first eigenvalue, the one describing the largest amount of variability on the dataset, 77.91%, describes the overall offset of the transmitted intensity data from the lenses. The second, 9.54% of the dataset’s variability was described by the second eigenvalue whiles the third, 7.08% of the dataset’s variability was describe by the third eigenvalue.
In the case of reflection, the PCs were obtained from 470 nm and 625 nm spectral bands with eigenvalues describing 99.5% of the variability of the dataset. As in the previous case, the first eigenvalue represented the overall reflection intensities from the lenses and described 85.07% of the dataset’s variability. The second, 5.56% of the dataset’s variability was described by the second eigenvalue whiles the third, 3.0% of the dataset’s variability was describe by the third eigenvalue. Transmission and reflection for the three and two spectral bands showed discrete classification between Group A and Group B lenses as shown in Figure 4(a) and Figure 4(b). Scatter plots (not shown) of the first three PCs in the scattering mode could not discriminate between Group A and Group B lenses. This is attributed to the low pixel intensity values obtained from both Group A and Group B lenses.
Using trained transmission data from 435 nm, 590 nm and 700 nm, the allocation rule obtained from the Fisher’s linear discriminant function with equal cost and equal priors for the sample data of the Group A and Group B lenses and for maximum separation of the two stained sectioned lenses is given as
 (7)
(7)
with a midpoints m = 3.2374 × 10⁻¹⁴, where r1, r2 and r3 representing PC1, PC2 and PC3 respectively with K1, K2 and K3 being the coefficient. In this case K1, K2 and K3 were found to be 0.99, −0.08 and −0.10 respectively. Thus, if Po ≥ m, then the lens is Group A (healthy), else it is Group B (cataractous). This can be seen in Figure 5(a) that shows lens data in the coordinates of the first two Fisher’s discriminants in the transmission mode. The blue and red data represents the
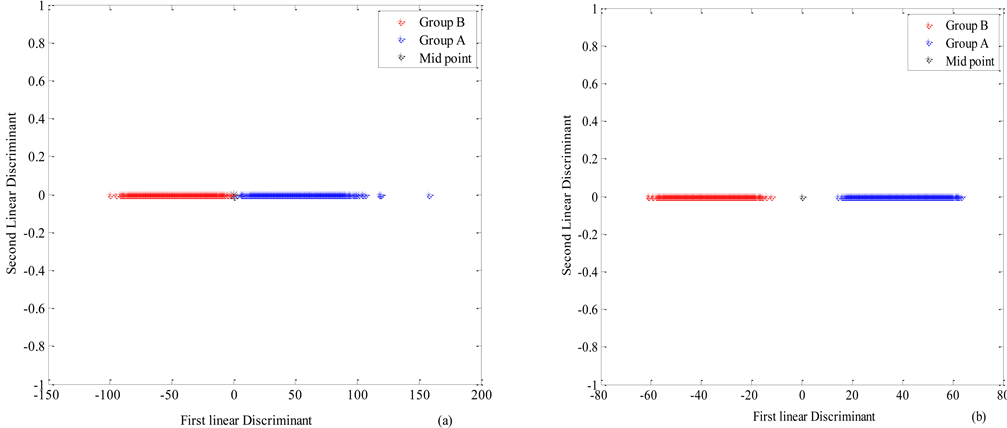
Figure 5. Group A and Group B lens data plotted in the coordinates of the first two Fisher’s discriminants (a) three transmission spectral bands (435 nm 590 nm and 700 nm) (b) two reflection spectral bands (470 nm and 625 nm). The black star represents the classification mid-point (m).

Table 1. Mid points values for discriminating Group A from Group B lenses in transmission and reflection mode.
Group A and B lenses respectively. The black star in the middle is the classification midpoint between the Group A and Group B lenses. Evaluation of the Fishers’ linear discriminant function with ten (10) transmitted data showed 90% success of the discrimination function using the PCs of the Group A and the Group B lenses.
The lens data from the reflection mode in the coordinates of the first two Fisher’s discriminants is shown in Figure 5(b). The allocation rule obtained using the reflectance intensities from 470 nm and 625 nm and for maximum separation of the two lenses is given by
 (8)
(8)
The values for L1, L2 and L3, which are the coefficients were found to be 0.97, −0.12 and −0.19 respectively. The midpoints values for discriminating Group A from Group B lenses in both transmission and reflection mode is shown in Table 1. Evaluation of the Fishers’ linear discriminant function with eight (8) reflection data showed 87% success of the discrimination function using the PCs of the Group A lenses and the Group B ones.
4. Conclusion
Using extracted average pixel intensities from grayscale multispectral images of healthy lenses (Group A) and cataractous lenses (Group B) from rat, five (5) spectral bands were found to be markers for discriminating Group A from Group B: 470 nm and 625 nm discriminated in reflection mode whereas 435 nm, 590 nm and 700 nm discriminated in transmission mode. MSI technique has confirmed that Group A lenses transmit and reflect more light than Group B lenses. Upon further analysis with principal component and Fisher Linear discriminant, three (3) PCs confirm these five (5) spectral bands as markers for discriminating Group A from Group B lenses in the scatter plot. The Fisher’s linear discriminant analysis showed 87% and 90% success of the discrimination function for the two reflection spectral bands and for the three transmission spectral bands respectively. The midpoint for classifying Group A from Group B lenses for the two reflection spectral bands was found to be 14.718 × 10⁻¹⁴ whereas that from the three transmission spectral bands were found to be 3.2374 × 10⁻¹⁴. The five spectral bands in reflection and transmission modes offer potential diagnostic tools for discriminating cataractous lenses of Sprague-Dawley rats from healthy lenses for ophthalmic applications. MSI technique in combination with multivariate analysis has therefore been used to discriminate healthy (Group A) of Sprague-Dawley rats from cataractous lenses (Group B). MSI has more advantages in terms of rapidity, rigidity, objectivity and the ability to provide more information on a single sample. Any trained personnel would be able to implement this technique together with the analysis in this field especially in veterinary Ophthalmology.
Acknowledgements
The authors wish to express our appreciation to International Programme for Physical Sciences (IPPS), International Sciences Programme (ISP), Uppsala University, Sweden) for funding and donation of microscopes. We wish to express our appreciation to the Office of External Activities (OEA) and Associate Scheme of Abdus Salam ICTP, Trieste, Italy for our stay in Italy and not forgetting Mr. Daniel Portakey of Korle-Bu teaching hospital for assisting in sectioning of the lens tissues.
Cite this paper
Adueming, P.O.-W., Eghan, M.J., Anderson, B., Kyei, S., Opoku-Ansah, J., Amuah, C.L.Y., Sackey, S.S. and Buah-Bassuah, P.K. (2017) Multispectral Imaging in Combination with Multivariate Analysis Discriminates Selenite Induced Cataractous Lenses from Healthy Len- ses of Sprague-Dawley Rats. Open Journal of Biophysics, 7, 145-156. https://doi.org/10.4236/ojbiphy.2017.73011
References
- 1. Xu, Y., Gao, X., Lin, S., Wong, D.W.K., Liu, J., Xu, D., Cheng, C., Cheung, C.Y. and Wong, T.Y. (2013) Automatic Grading of Nuclear Cataracts from Slit-Lamp Lens Images Using Group Sparsity Regression. International Conference on Medical Image Computing and Computer Assisted Intervention (MICCAI), 16, 468-475.
https://doi.org/10.1007/978-3-642-40763-5_58 - 2. Kappelhof, J.P., Vrensen, G.F.J.M., de Jong, P.T.V.M., Pameyer, J.H. and Willekens, B.L.J.C. (1986) An Ultrastructural Study of Elschnig’s Pearls in the Speudophakic Eyes. American Journal of Ophthalmology, 101, 56.
https://doi.org/10.1016/0002-9394(86)90465-4 - 3. Brown, N.P., Harris, M.L., Shunshin, G.A., Vrensen, G.F.J.M., Willekens, B. and Bron, A.J. (1993) Is Cortical Spoke Cataract due to Lens Fibre Breaks? The Relationship between Fibre Folds, Fibre Breaks, Water Clefts and Spoke Cataracts. Eye, 7, 672-679.
https://doi.org/10.1038/eye.1993.154 - 4. Harding, J.J. (1980) Principle and Techniques of Electron Microscopy. Academic Press, London, 303-305.
- 5. IAPB Report—State of the World Sight 2010.
http://www.petteri-teikari.com/pdf/Teikari_Multispectral_Imaging.pdf - 6. Wang, Z., Tangella K., Balla, A. and Popescua, G. (2011) Tissue Refractive Index as Marker of Disease. Journal of Biomedical Optics, 16, 116017.
https://doi.org/10.1117/1.3656732 - 7. Kyei, S., Kuffuor, G.A., Ramkissoon, P., Afari, L. and Asiamah, E.A. (2015) The Claim of Anti-Cataract Potential of Heliotropium Indicum: A Myth or Reality? Ophthalmology and Therapy, 4, 115-128.
https://doi.org/10.1007/s40123-015-0042-2 - 8. Okano, T., Uga, S., Ishikawa, S. and Shumiya, S. (1993) Histopathological Study of Hereditary Cataractous Lenses in the SCR Strain Rat. Experimental Eye Research, 57, 567-576.
https://doi.org/10.1006/exer.1993.1161 - 9. Alfano, R., Tata, D., Cordero, J., Tomashefsky, P., Longo, F. and Alfano, M. (1984) Laser Induced Fluorescence Spectroscopy from Native Cancerous and Normal Tissue. IEEE, 20, 1507-1511.
- 10. Feride, S., Toyran, N., Nese, K. and Belma, T. (2000) Fourier Transform Infrared Study of the Effect of Diabetes on Rats Liver and Heart Tissues in the C-H region. Talanta, 52, 55-59.
- 11. Antunes, A., Gozzo, F.V., Borella, M.I., Nakamura, M., Safatle, A.M.V., Barros, P.S. M. and Toma, H.E. (2007) Atomic Force Imaging of Ocular Tissues: Morphological Study of Healthy and Cataract Lenses. In: Méndez-Vilas, A. and Díaz, J., Eds., Modern Research and Educational Topics in Microscopy, 29-36.
- 12. Jongelbloed, W.L., Van der Want, J.J.L., Worst, J.G.F. and Kalicharan, D. (1998) Stereoscopic Images of Human Cataractous Lens Fibres Obtained with Field Emission Scanning Electron Microscopy. Scanning Microscopy, 12, 653-665.
- 13. Higham, A.D., Wilkinson, B. and Kahn, D.A. (1975) Multispectral Scanning Systems and Their Potential Application to Earth-Resources Surveys: Basic Physics and Sensing Technology. ESA Scientific and Technical Review, 1, 85-118.
- 14. Coffey, V.C. (2012) Multispectral Imaging Moves into the Mainstream. Optics and Photonics News, 23, 18-24.
https://doi.org/10.1364/OPN.23.4.000018 - 15. Hu, Y., Wu, Q., Liu, S., Wei, L., Chen, X., Yan, Z. and Ding, Y. (2005) Study of Rice Pollen Grains by Multispectral Imaging Microscopy. Microscopy Research and Technique, 68, 335-346.
https://doi.org/10.1002/jemt.20256 - 16. Teikari, P. (2008) Multispectral Imaging. Course Project for AS-75.2128 Imaging and Display Technology. Helsinki University of Technology, Finland.
https://www.iapb.org/resources/iapb-report-state-world-sight-2010 - 17. Rice, B.W., Cable, M.D. and Nelson, M.B. (2001) In Vivo Imaging of Light-Emitting Probes. Journal of Biomedical Optics, 6, 432-440.
https://doi.org/10.1117/1.1413210 - 18. Graves, E.E., Ripoll, J., Weissleder, R. and Ntziachristos, V. (2003) A Submillimeter Resolution Fluorescence Molecular Imaging System for Small Animal Imaging. Medical Physics, 30, 901-911.
https://doi.org/10.1118/1.1568977 - 19. Levenson, R.M. and Mansfield, J.R. (2006) Multispectral Imaging in Biology and Medicine: Slices of Life. Cytometry Part A, 69A, 748-758.
https://doi.org/10.1002/cyto.a.20319 - 20. Zhang, H.F., Maslov, K. and Wang, L.V. (2007) In Vivo Imaging of Subcutaneous Structures Using Functional Photoacoustic Microscopy. Nature Protocols, 2, 797-804.
https://doi.org/10.1038/nprot.2007.108 - 21. Zhang, Y., Hong, H. and Cai, W. (2011) Photoacoustic Imaging. Cold Spring Harbor Protocols, 2011, 1015-1025.
https://doi.org/10.1101/pdb.top065508 - 22. Hiraoka, Y., Shimi, T. and Haraguchi, T. (2002) Multispectral Imaging Fluorescence Microscopy for Living Cells. Cell Structure and Function, 27, 367-374.
https://doi.org/10.1247/csf.27.367 - 23. Zhou, L. and El-Deiry, W.S. (2009) Multispectral Fluorescence Imaging. The Journal of Nuclear Medicine, 50, 1563-1566.
https://doi.org/10.2967/jnumed.109.063925 - 24. Sangare, M., Agneroh, T.A., Bagui, O.K., Traore, I., Ba, A. and Zoueu, J.T. (2015) Classification of African Mosaic Virus Infected Cassava Leaves by the Use of Multi-Spectral Imaging. Optics and Photonics Journal, 5, 261-272.
https://doi.org/10.4236/opj.2015.58025 - 25. Hu, C., Meng, Q., Mu, J., Pang, Q. and Zhao, J. (2013) Multispectral Imaging for Authenticity Identification and Quality Evaluation of Flos carthami. Optics and Photonics Journal, 3, 229-232.
https://doi.org/10.4236/opj.2013.33037 - 26. Opoku-Ansah, J., Eghan, M.J., Anderson, B. and Boampong, J.N. (2013) Wavelength Markers for Malaria (Plasmodium falciparum) Infected and Uninfected Red Blood Cells for Ring and Trophozoite Stages. Applied Physics Research, 6, 47.
- 27. Fawzy, Y., Lam, S. and Zeng, H. (2015) Rapid Multispectral Endoscopic Imaging System for Near Real-Time Mapping of the Mucosa Blood Supply in the Lung. Biomedical Optics Express, 6, 2980-2990.
https://doi.org/10.1364/boe.6.002980 - 28. Levenson, R.M., Fornari, A. and Loda, M. (2008) Multispectral Imaging and Pathology: Seeing and Doing More. Expert Opinion on Medical Diagnostics, 2, 1067-1081.
https://doi.org/10.1517/17530059.2.9.1067 - 29. Maloof, A.J., Pandey, S.K., Neilson, G. and Milverton, E. (2005) Selective Death of Lens Epithelial Cells Using Demineralized Water and Triton X-100 with Perfect Capsule Sealed Capsule Irrigation: A Histological Study in Rabbit Eyes. Archives of Ophthalmology, 123, 1378-1384.
https://doi.org/10.1001/archopht.123.10.1378 - 30. Brydegaard, M., Merdasa, A., Jayaweera, H., Ålebring, J. and Svanberg, S. (2011) Versatile Multispectral Microscope Based on Light Emitting Diodes. Review of Scientific Instruments, 82, 1231061-12310613.
https://doi.org/10.1063/1.3660810 - 31. Bassnett, S., Shi, Y. and Vrensen, G.F.J.M. (2011) Biological Glass: Structural Determinants of Eye Lens Transparency. Philosophical Transactions of the Royal Society B, 366, 1250-1264.
https://doi.org/10.1098/rstb.2010.0302 - 32. Michael, R. and Bron, A.J. (2011) The Ageing Lens and Cataract: A Model of Normal and Pathological Ageing. Philosophical Transactions of the Royal Society B, 366, 1278-1292.
https://doi.org/10.1098/rstb.2010.0300 - 33. Cenedella, R.J. and Fleshner, C.R. (1992) Selective Association of Crystallins with Lens “Native” Membrane during Dynamic Cataractogenesis. Current Eye Research, 11, 801-815.
https://doi.org/10.3109/02713689209000753 - 34. David, L.L., Dickey, B.M. and Shearer, T.R. (1987) Origin of Urea-Soluble Protein in the Selenite Cataract, the Role of β-Cristalline Proteolysis and Calpain II. Investigative Ophthalmology & Visual Science, 28, 1148-1156.
- 35. Kessel, L., Eskildsen, L., Lundeman, J.H., Ole Bjarlin Jensen, O.B. and Larsen, M. (2011) Optical Effects of Exposing Intact Human Lenses to Ultraviolet Radiation and Visible Light. BMC Ophthalmology, 11, 41.
https://doi.org/10.1186/1471-2415-11-41