Open Journal of Composite Materials
Vol.07 No.04(2017), Article ID:78358,23 pages
10.4236/ojcm.2017.74016
Investigation of the Flexural Properties and Failure Behavior of Unidirectional CF/Nylon 6 and CF/Epoxy Composites
Yan Ma1, Masahito Ueda2, Tomohiro Yokozeki3, Toshi Sugahara4, Yuqiu Yang5, Hiroyuki Hamada1
1Advanced Fibro-Science, Kyoto Institute of Technology, Kyoto, Japan
2Department of Mechanical Engineering, College of Science and Technology, Nihon University, Tokyo, Japan
3Department of Aeronautics and Astronautics, the University of Tokyo, Tokyo, Japan
4Maruhachi Corporation, Fukui, Japan
5Key Laboratory of Textile Science & Technology, Ministry of Education, College of Textiles, Donghua University, Shanghai, China

Copyright © 2017 by authors and Scientific Research Publishing Inc.
This work is licensed under the Creative Commons Attribution International License (CC BY 4.0).
http://creativecommons.org/licenses/by/4.0/


Received: June 14, 2017; Accepted: August 8, 2017; Published: August 11, 2017
ABSTRACT
In this work, flexural properties and failure behavior of unidirectional (UD) carbon fiber reinforced polyamide 6 (CF/Nylon 6) and epoxy resin (CF/ Epoxy) laminates were investigated through three-point bending test. The mechanical properties and failure behavior of 0 and 90 degree CF/Nylon 6 and CF/Epoxy laminates were discussed based on the fiber volume fraction, fiber distribution, void content, interfacial properties, transversal tensile strength and fracture toughness. The effects of fiber volume fraction, fiber distribution, void content and their hybrid effect on the flexural properties were investigated. Step-by-step observation and scanning electron microscope observation of laminates after flexural tests were employed to analyze the fracture process.
Keywords:
Polymer Matrix Composite, Flexural Properties, Failure Behavior, Unidirectional, Prepreg

1. Introduction
Till now, fiber reinforced plastics (FRPs) have given rise to a wide range of engineering applications of types of materials to various application fields including aerospace and aircraft structure, yachts as well as wind generator blades and other products on the account of their outstanding mechanical properties, lightweight and longer service life [1] - [8] . Lots of present traditional materials, metal for instance, were gradually substituted by some new replacements such as carbon fiber reinforced plastics (CFRPs) [6] [7] [8] . The properties of CFRPs are related to lots of factors such as properties of raw materials [9] [10] , fiber orientation [11] , manufacturing processes [12] and compatibility between fiber and resin [2] . Lots of methods to improve the mechanical properties of CFRPs such as reasonable structure optimization (hybrid reinforcements [13] [14] , layup [15] and so on), fiber treatment [16] , post-treatment [1] [5] , and micro- or nano-scale filler doping [17] [18] [19] have been carried out.
The sensitivity of the mechanical behavior of composites materials to the fiber/matrix interfacial bond strength has long been realized [2] [20] [21] . Good interfacial adhesion allows more effective stress transfer from the matrix to the reinforcement, enhancing the ultimate strength. One of the most efficient methods to ameliorate the capability of composites is to select a reasonable combination of reinforcement and matrix. Modification of the interface could affect fracture modes of unidirectional (UD) CFRPs, resulting in disparate mechanical properties [22] [23] . Longitudinal tensile failure of UD CFRPs having low interfacial bonding strength displays a splitting/broom fracture behavior, while those having a high interfacial bond display a step-like/brittle fracture behavior [2] .
Conventional laminate composites are sensitive to out-of-plane loading, as they are weaker in the through-the-thickness direction than in the plane of lamination. The flexure response of FRPs has been the subject of continued investigation [24] [25] [26] . Except the above mentioned factors, the presence of local inhomogeneities and defects, which are often difficult to characterize and model, also influence the flexural properties and failure in flexure. Lassila J and Vallittu P [27] investigated the influence of the position of fiber rich on the flexural properties of FRPs construction. Results indicate that specimens with fibers positioned on the compression side (≈250 MPa) showed higher flexural strength than specimens with fibers positioned on the tension side (500 - 600 MPa). Hagstrand PO [28] studied the void content on the flexural properties of beams manufactured by compression moulding multiple unidirectional commingled glass/polypropylene fiber tows. Voids were found to have a negative effect on the flexural modulus and strength, which both decreased by about 1.5% for each 1% of voids but a clear positive effect on the beam stiffness.
In this study, typical thermoplastic resin Nylon 6 and thermosetting epoxy resin were used as matrices to manufacture 0 and 90 degree UD CF/Nylon 6 (same to CF/PA6) and CF/Epoxy laminates for investigating their flexural properties and failure behavior through a great quantity of experimental tests. Fiber distribution, fiber volume fraction, and void content were measured by the optical observation method. The interfacial properties were evaluated by push-out test. The transversal tensile strength was evaluated by tensile tests of 90 degree unidirectional laminates. The fracture toughness of laminates was measured by compact tension tests. The effects of fiber volume fraction, void content, fiber distribution and their hybrid effects on mechanical properties were investigated. Step-by-step 3 point bending test, microscope observation and scanning electron microscope observation were carried out to investigate the failure behavior and fracture mechanism.
2. Experimental Methods
2.1. Materials
2.1.1. Manufacturing of Unidirectional Composites
Two kinds of UD CFRP laminates were manufactured by using same carbon fiber (T700SC 12K, Toray, Tokyo, Japan) but two different types of matrix systems. Two types of UD prepreg sheets were fabricated from carbon fiber films with Nylon 6 (MXD-PA, Mitsubishi Gas Chemical, Tokyo, Japan) film, and carbon fibers (T700SC 12K, Toray) with epoxy (MCP939, Maruhachi Corporation, Fukui, Japan) film, respectively. Table 1 shows the mechanical properties of the raw materials. CFRP laminates with a thickness of 2 mm were prepared by laminating 20 plies of thin prepreg sheets (single ply laminate ≈ 0.1 mm) with stacking sequences of [0]20 for both 0-degree and 90-degree 3-point bending tests. Molding conditions of CF/Nylon 6 laminates and CF/Epoxy laminates were 280˚C for 3.5 mins under a compression pressure of 4 kg/cm2 and 130°C for 50 minutes under a compression pressure of 25 kg/cm2, respectively. After molding, the testing specimens of both CF/Nylon 6 and CF/Epoxy laminates were cut into standard size of 70 × 13 × 2 and 25 × 150 × 2 (Width × Length × Thickness: mm) for longitudinal (0 degree)/transversal (90 degree) flexural tests and transverse tensile tests, respectively. Before mechanical testing, two side edges of the laminates were polished by SiC abrasive paper with grain size of 400 in order to eliminate the defects which formed in cutting process.
2.1.2. Sample Preparation for Microindentation Tests
Specimens with size of 2 mm × 25 mm were cut out from the UD composite laminates then embedded standing upright in a PMMA tube. The tube was filled with liquid epoxy resin for curing the pre-cut specimen. After that an epoxy resin cylinder including a CFRP composite laminate at the center with UD carbon fibers along the longitudinal direction, was prepared. A thin plate with thickness about 2 mm was cut off for getting a plane perpendicular to the fiber orientation. Next step is the grinding and polishing steps. In detail, SiC abrasive papers were employed to grind and polish the previous cut face side of the epoxy cylinder

Table 1. Mechanical properties of materials.
E: Tensile modulus; σ: Tensile strength; δ: Elongation; ρ: Density; *: Yield point; $: Break point.
from heavy-grade sandpaper to finer-grade sandpaper (using grain size from 400, 600, 800, 1200, 1500 to 2000). Then the aluminum powder with grain size from 1 mm, 0.1 mm to 0.05 mm was used for mirror polishing progressively. During the above procedure, the epoxy resin cylinder was clamped in a circle adapter holding the cylinder perpendicular to the polishing plane. After polishing the first one side, the final procedure in the specimen preparation process is to grind and polish the other face side of the cylinder in the same way as mentioned above, till a slice of specimen with a thickness of about 100 µm.
2.2. Experimental Procedures
2.2.1. Tensile Tests
More than 10 pieces of 90-degree specimens were cut for transversal tensile tests. The tensile tests were performed on a computer-controlled, screw-driven 100- kN capacity universal testing machine (55R4206, Instron, Kanagawa, Japan) at a rate of 1 mm/min based on the corresponding testing standard ASTM D3039 [29] .
2.2.2. 3-Point Bending Tests
More than 20 pieces of 0-degree and 90-degree specimens were prepared. The flexure tests were performed on a computer-controlled, screw-driven 5 kN capacity universal testing machine (55R4206, Instron) at a rate of 1 mm/min on the basis of testing standard ASTM D7264 [30] . The specimens were placed on two fixed supports with support span length of 64 mm.
2.2.3. Compact Tension Tests
Five pieces of laminates as shown in Figure 1 were prepared for compact tension tests. The compact tensile tests were performed on a computer-controlled, screw-driven 5 kN capacity universal testing machine (55R4206, Instron). The load was applied quasi-statically under displacement control with a crosshead speed of 0.5 mm/min according to corresponding testing standard ASTM D5045 [31] .
The fracture toughness, KIC as a function of the geometrical parameters and the maximum load (PQ) during the test could be calculated using Equations (1) and (2):
 (1)
(1)
 (2)
(2)
x is the ratio a0/W = 0.5, and a0 = 25 mm is the initial distance between the crack frond and the pins (Figure 1).
2.2.4. Single-Fiber Push-Out Tests
The IFSS of composite laminates was measured through single-fiber push-out tests, which were carried out by using a Berkovich Indenter with pyramid geo-

Figure 1. Geometrical specifications of the standard CT sample used in this study and details of the initial crack tip.
metry (Nano Indenter G200, Agilent Technologies, Oak Ridge, TN, USA), as shown in Figure 2. The load was applied quasi-statically under displacement control with a constant speed of 0.2 µm/s. The slice for single-fiber push-out tests is required to be thin as far as possible, for allowing debond over the whole surface/interface of the loaded carbon fiber and to push the fiber out from slice completely. The thin slices with thickness of 100 µm were put on the aluminum foil with holes as shown in Figure 2. The IFSS  could be calculated through Equation (3).
 (3)
(3)
where Fp is the peak load when interfacial debonding happens; rf is the fiber radius (for T700S carbon fiber: rf = 3.5 μm); and lf is the thickness of slice.
2.2.5. Evaluation of Fiber Volume Fraction
On the basis of UD characteristics, the fiber volume fractions (Vf) of UD laminates could be evaluated by using on a polished surface of the specimen cross- section in a same way as introduced in [2] [3] . The Vf of UD laminates could be measured according to the following steps: 1) Images of specimen cross sections were taken using an optical microscope (VHX-500F CCD camera, KEYENCE, Osaka, Japan, which has a resolution of 1600 × 1200 pixels) were preprocessed by using Adobe Photoshop version CS3 (Adobe Systems Corporation, San Jose, CA, USA) in a Windows 7 environment (Microsoft Corporation, Redmond, Washington, USA); 2) Functions in ImageJ software “Make Binary” and “Watershed” were used to get corresponding binary images from the original cross section photos, then the function of “Noise→Remove outlier” [2] was employed for obtaining images with clear boundary of carbon fiber; 3) “Analyze→Analyze Particles” function in ImageJ software was chosen to calculate the carbon fiber area ratio (∑Fibers cross section/cross section of CFRP), which is closely connected with the Vf because of their UD characteristics. On the other hand, the polished cross sections of laminates were examined to check the carbon fiber distribution of laminates and crack propagation in laminates during fracture process.
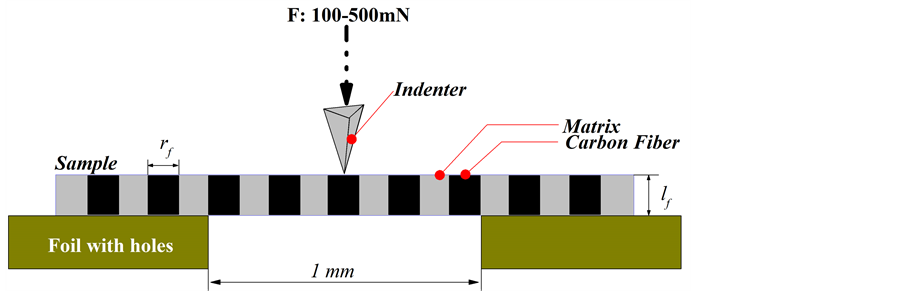
Figure 2. Illustration of single-fiber push-out tests layout.
2.2.6. Evaluation of Fiber Distribution
After flexural testing for each laminates, three thin slices (width × depth × thickness = 15 × 2 × 2 mm) were cut from the area near the major crack of the beam that failed in flexure and two heads of the beam. The cut planes were parallel to the cross section of the beam. The panorama images were also captured by the optical microscope (VHX-500F, KEYENCE) after polishing process. For each cross-section, about 150 images (500 × 500 pixels corresponding to an area of 150 × 150 μm2) were captured from the grid-limited regions of each cross section as illustrated in Figure 3(a). Then the numbers of carbon fibers in each unit area was counted respectively. In detail, in order to get more accurate data, every fiber in a laminate was marked as a corresponding black circle point by hand one by one through using Photoshop software as shown in Figure 3(a). Then the graph with hundreds of black circle points was extracted as shown in Figure 3(d). At last, the point number could be counted by ImageJ software automatically by using the similar method as introduced in Section 2.2.5.
Fiber distribution could be quantified by evaluating the deviation of carbon fiber numbers from the average carbon fiber numbers in a unit cross section [32] [33] . The whole cross sectional photo of each laminate was divided into n small unit areas. The number of carbon fibers in each unit area was counted in sequence. Finally, the coefficient of variation  and fiber distribution coefficient
  of each specimen were calculated by using Equation (4) and Equation (5), respectively [32] [33] .
 (4)
(4)
 (5)
(5)
where xi is the number of carbon fibers in the ith unit area,  is the average number of fibers in all unit areas, and n is the number of unit areas. A distribution coefficient of 1 indicates perfectly homogeneous fiber distribution where coefficients approaching 0 indicate inhomogeneous fiber dispersion. The fiber distribution coefficient calculated this method significantly depends on the selection of the size of the unit area. In this study, three types of unit area (150 ×

Figure 3. Illustration of evaluation of fiber distribution and void content of laminates. (a) Cross section of laminates; (b) Mark of each carbon fiber and void content area; (c) extracted void content area graph; (d) extracted carbon fibers graph.
50, 150 × 75 and 150 × 150 μm2) were employed as shown in Figure 3(d).
2.2.7. Evaluation of Void Content
According to the cross-section of unidirectional laminates as shown in Figure 3(a), the void content area in laminates could be marked and extracted by using Photoshop software as shown in Figure 3(b) and Figure 3(c), respectively. Then the void content ratio could be measured by using ImageJ software automatically by using the same method as described in Section 2.2.5.
2.2.8. Optical Observation and Scanning Electron Microscope Observation
Microscope observation camera and scanning electron microscopy (SEM) observations of fractured specimens were carried out using KEYENCE, VHX-500F microscope and CCD JEOL, JSM 5200 (Tokyo, Japan) scanning electron microscope, respectively. Before SEM observation, all selected samples were coated with an Au-Pd layer.
3. Results and Discussion
3.1. Fiber Distribution of UD Laminates
The cross section of UD CF/Nylon 6 and CF/Epoxy laminates are shown in Figure 4(a) and Figure 4(a') and in Figure 4(b) and Figure 4(b'), respectively. Evidently, carbon fibers in CF/Epoxy laminates distributed more uniform than carbon fibers in CF/Nylon 6 laminates. Carbon fiber layers in CF/Nylon 6 laminates exhibited a corrugated arrangement and “bundle”-like carbon fiber agglomeration was observed as shown in Figure 4. Especially, the internal bad carbon
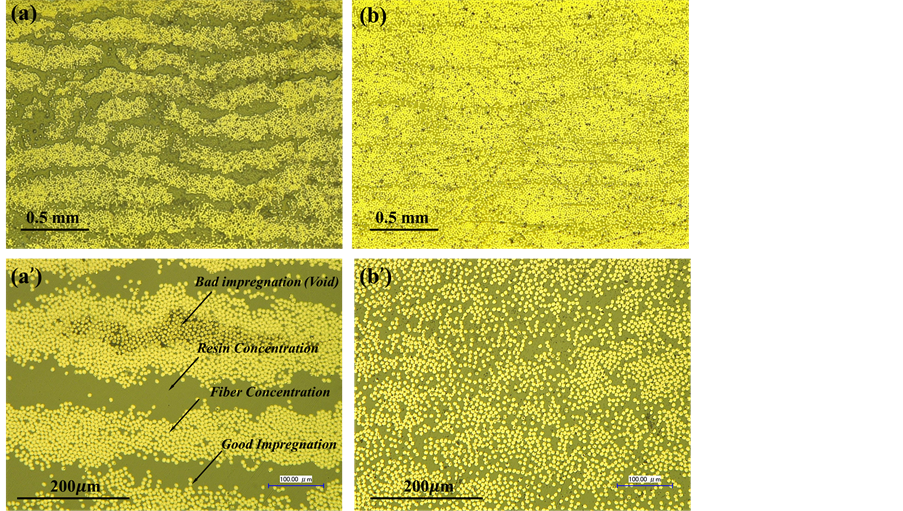
Figure 4. Cross section of CF/Nylon 6 laminates (a) (a') and CF/Epoxy laminates (b) (b') at low magnification (a) (b) and high magnification (a') (b').
fiber impregnation zones in CF/Nylon 6 laminates were observed as shown in Figure 4(a
3.2. Fiber Volume Fraction, Vf, of UD Laminates
Vf of UD CF/Nylon 6 and CF/Epoxy composites could be calculated based on their cross sectional ratio between carbon fibers and matrix by using the image analysis software (ImageJ software) owing to their UD characters as introduced in Section 2.2.3. As shown in Table 2, more than 40 pieces of specimens were examined and the results indicated that the Vf of UD CF/Nylon 6 and CF/Epoxy composites were about 37.5% and 41.9%, respectively.
3.3. Interfacial Shear Strength of UD Laminates
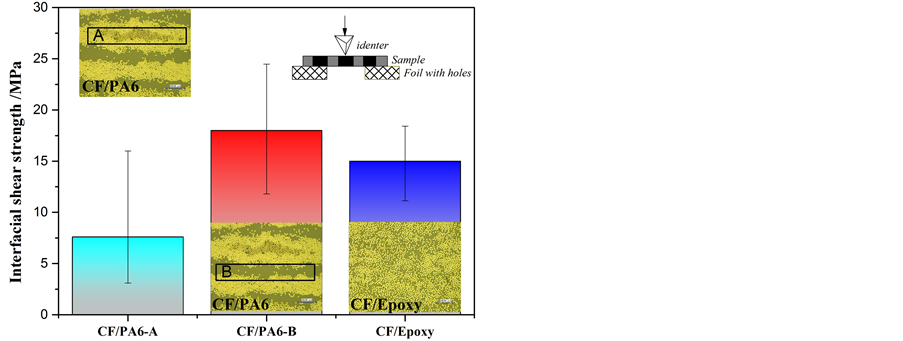
According to Equation (3), the IFSS of CF/Nylon 6 and CF/Epoxy composites could be approximated by the average shear strength. Two types of typical areas in CF/Nylon 6 laminates (as shown in Figure 4(a)) including a carbon fiber agglomeration zone (CF/Nylon 6-A: bad impregnation) and an ideal distribution area (CF/Nylon 6-B: ideal impregnation) were separated and the corresponding IFSSs were examined as reported in Figure 5. The IFSS results indicated that CF/Nylon 6 laminates with ideal fiber impregnation (CF/Nylon 6-B, average IFSS ≈ 18.0 MPa) exhibited over double IFSS than CF/Nylon 6 composites with bad carbon fiber impregnation (CF/Nylon 6-A, average IFSS ≈ 7.6 MPa). Mean
 (a)
(a)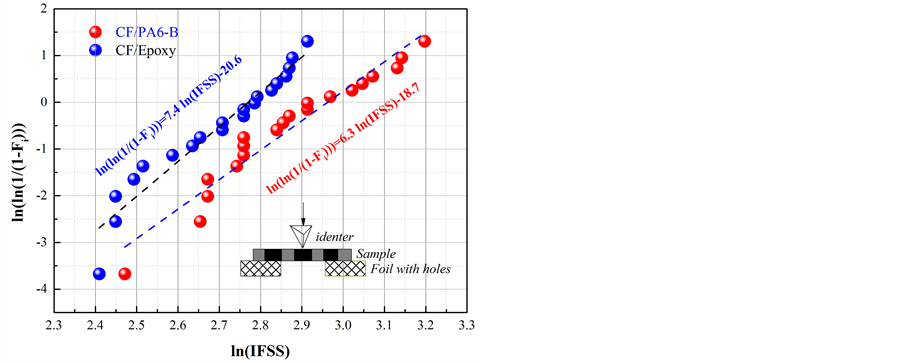 (b)
(b)
Figure 5. IFSS of CF/Nylon 6 and CF/Epoxy composites examined through single-fiber push-out tests (a) and Weibull plots of IFSS for CF/Nylon 6-B and CF/Epoxy composites (b).
Table 2. Mechanical properties of unidirectional laminates.
while, CF/Epoxy laminates exhibited middle IFSS (average IFSS ≈ 15 MPa). From optical observation as shown in Figure 4(a), it is known that the low IFSS zone was wider than the high IFSS zone in CF/Nylon 6 composites. The results indicated that IFSS in this research examined through the single fiber push-out method by using the Berkvich Indenter with pyramid geometry showed a relatively lower IFSS than that measured by other testing methods [34] [35] [36] [37] . Nevertheless, the adverse effects of poor infiltrating capability in CF/Nylon 6 composites on the IFSS were examined evidently in present study.
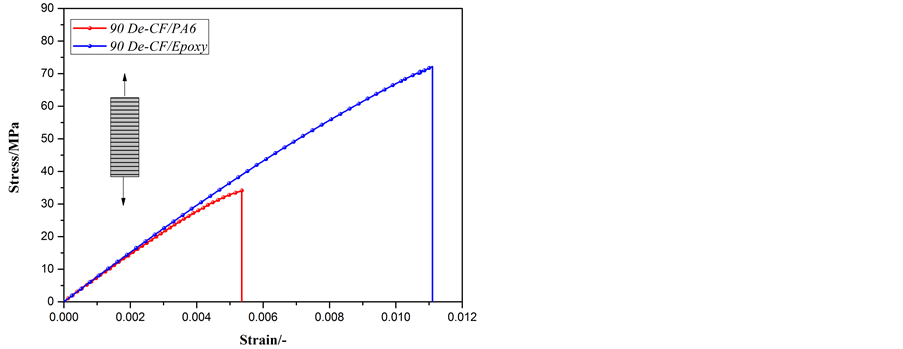
3.4. Transverse Tensile Mechanical Properties of UD laminates
Table 2 shows the tensile properties of 90 degree UD CF/Nylon 6 and CF/Epoxy composites. Typical stress-strain curves of 90 degree UD CF/Nylon 6 and CF/Epoxy laminates are shown in Figure 6(a). The tensile strengths of 90 degree UD CF/Epoxy composites ( ) were over double times than those of CF/Nylon 6 composites (
 ). As shown in Table 2, a perceptible scattering of 90 degree tensile strength could be obviously observed. Commonly, the corresponding statistical distribution of composite strengths follows Weibull distribution [38] , with the Weibull equation given as Equation (6):
 (a)
(a)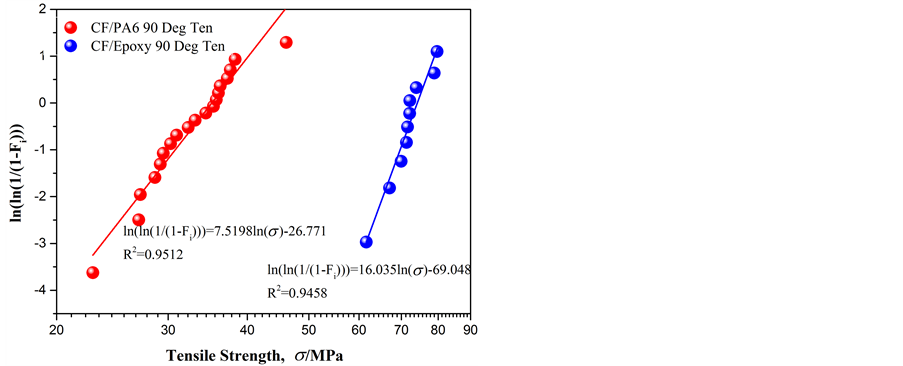 (b)
(b)
Figure 6. Typical stress-strain curves (a) and Weibull plot (b) of 90 degree UD CF/Nylon 6 and CF/Epoxy laminate under tensile loading.
 (6)
(6)
where PF is the cumulative probability of failure of a composite at applied tensile strength ,
,  is the Weibull modulus (Weibull shape parameter), and
  is a Weibull scale parameter (characteristic stress). Taking the logarithm of both sides of Equation (6), rearrangement of the two-parameter Weibull statistical distribution expression gives the following:
 (7)
(7)
be obtained by linear regression from a Weibull plot of Equation (7). The probability of failure Fi at the ith ranked specimen from a total of N specimens is obtained from the symmetric rank method as
 (8)
(8)
where i is rank of the each data point from lowest to highest strength.
Figure 6(b) shows the Weibull plots of transverse tensile strength for 90 degree UD CF/Nylon 6 and CF/Epoxy composites. The Weibull modulus,  , for 90 degree CF/Nylon 6 and CF/Epoxy composites were calculated to be 7.5 and 16.0, respectively. The variations in Weibull modulus,
  , can be ascribed to the nature and distribution of the defects which are present in the laminates. As is known to all, some flaws were created in composites during manufacturing processes and different subsequent heat treatments. The existence of the raw material variation and defects in UD laminates such as fiber misalignment, void and non-impregnation leads to scattering of tensile strength. So the Weibull modulus,
  , can be considered as a defect frequency distribution factor [38] . High values of Weibull modulus indicates that defects are evenly distributed throughout the composites. Low values of Weibull modulus indicates more defects that are less evenly distributed, causing a greater scatter in strength [39] . The result of IFSS and transverse strength of laminates indicate that the poor impregnation (high void content) of CF/Nylon 6 composites exhibited negative effects on their mechanical properties and corresponding stabilities.
3.5. Fracture Toughness of 90 Degree UD Laminates
The fracture toughness results of CF/Nylon 6 and CF/Epoxy laminates examined by compact tension tests are shown in Figure 7. Results indicate that CF/Nylon 6 laminates exhibited higher fracture toughness than CF/Epoxy laminates, which indicates the capability of UD CF/Nylon 6 composites containing a crack to resist fracture was better than CF/Epoxy composites [40] .
3.6. Flexural Mechanical Properties of UD Laminates
The flexural mechanical results of both 0 and 90 degree CFRPs are shown in Table 2. Typical deflection-load curves of 0 and 90 degree UD composites were shown in Figure 8(a) and Figure 8(b), respectively. Both 0 and 90 degree CF/Epoxy composites exhibited obvious higher flexural modulus and flexural strength than CF/Nylon 6 laminates as shown in Table 2. Especially, flexural
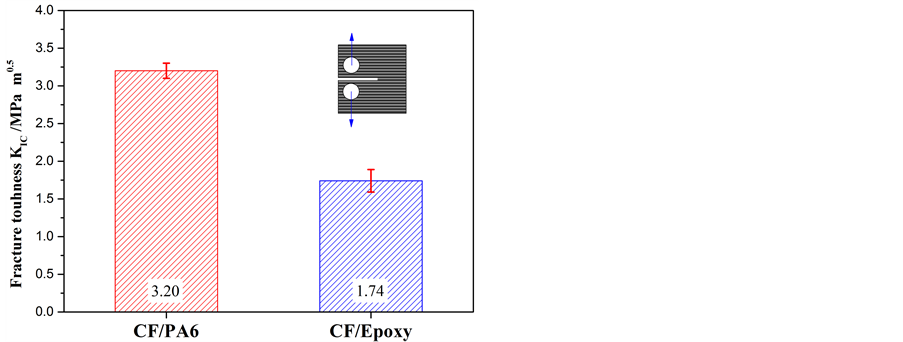
Figure 7. Fracture toughness of 90 degree CF/Nylon 6 and CF/Epoxy composites [40] .
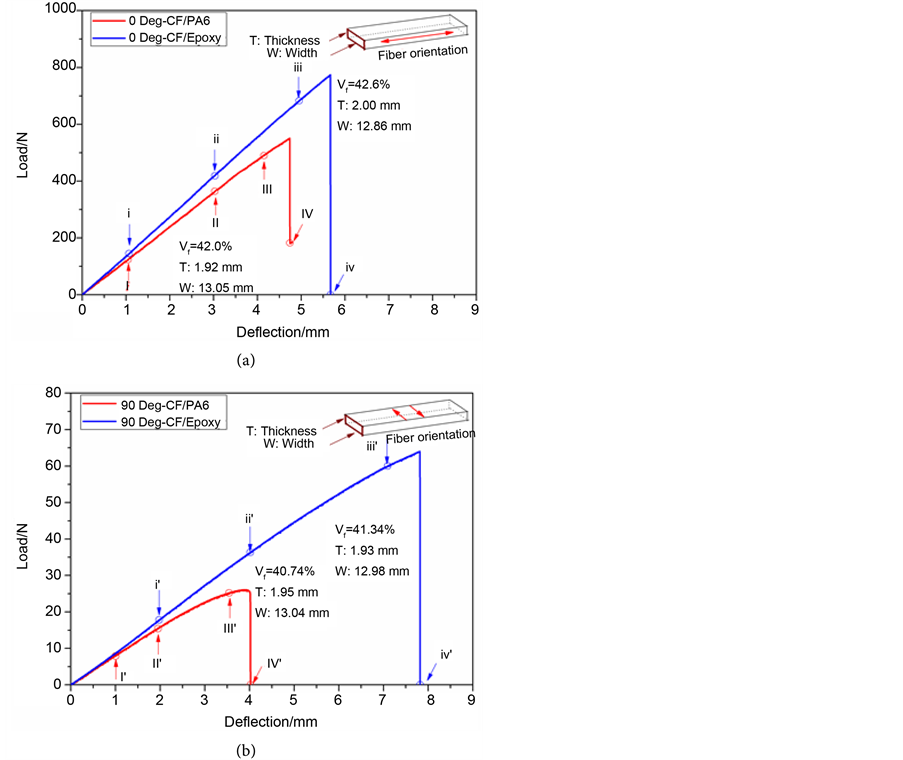
Figure 8. Typical deflection-load curves of 0 degree CFRP plates (a) and 90 degree CFRP plates (b) under flexure loading.
strength of 90 degree CF/Epoxy laminates (≈117.81 MPa) exhibited more thandouble times those of CF/Nylon 6 laminates (≈51.47 MPa), which showed the similar results to the transverse tensile mechanical properties.
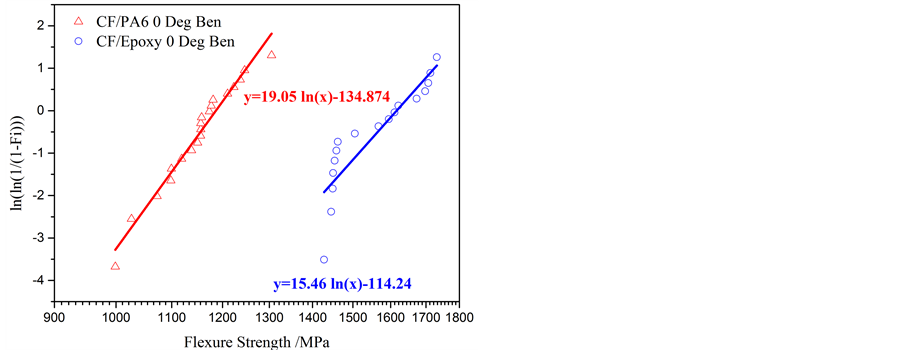
Results in Table 2 indicate that there is a scattering of bending strength. The statistical distribution of mechanical properties is usually described by means of the Weibull equation. The Weibull plots of 0 and 90 degree CF/Nylon 6 and CF/Epoxy composites are shown in Figure 9(a) and Figure 9(b), respectively. The Weibull modulus,  , for 0 degree CF/Nylon 6, 0 degree CF/Epoxy, 90 degree CF/Nylon 6 and 90 degree CF/Epoxy composites were examined to be 19.05, 15.46, 9.30 and 19.49, respectively. As above mentioned, high values of
  corresponds to the stable mechanical properties [39] {Naito, 2008 #35;Naito, 2008 #35} .
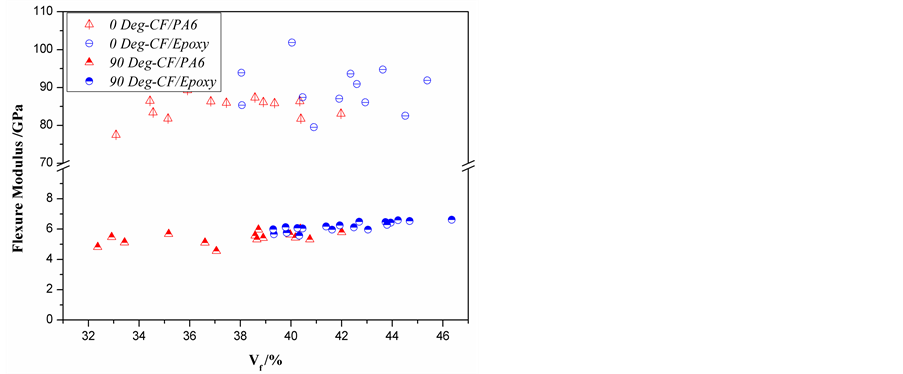
3.7. Effect of Vf on Flexural Mechanical Properties
The Vf of 0 and 90 degree CF/Nylon 6 and CF/Epoxy composites are about 37% - 38% (C.V. ≈ 7% - 8%) and 41% - 42% (C.V. ≈ 4% - 6%), respectively. The relationship between Vf & flexure modulus and Vf & flexure strength are shown in
 (a)
(a)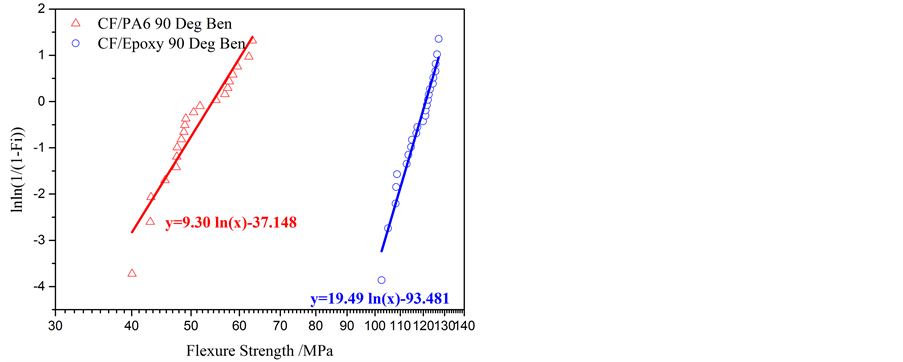 (b)
(b)
Figure 9. Weibull plots for both 0 (a) and 90 degree (b) CF/Nylon 6 and CF/Epoxy composites under flexural loading.
Figure 10(a) and Figure 10(b), respectively. It is clear that the higher Vf of same type specimens, the higher flexure modulus and strength. It is worth to note that 90 degree CF/Epoxy laminates clearly exhibited higher strength than 90 degree CF/Nylon 6 laminates even with similar Vf.
3.8. Effect of Void Content on Flexural Mechanical Properties
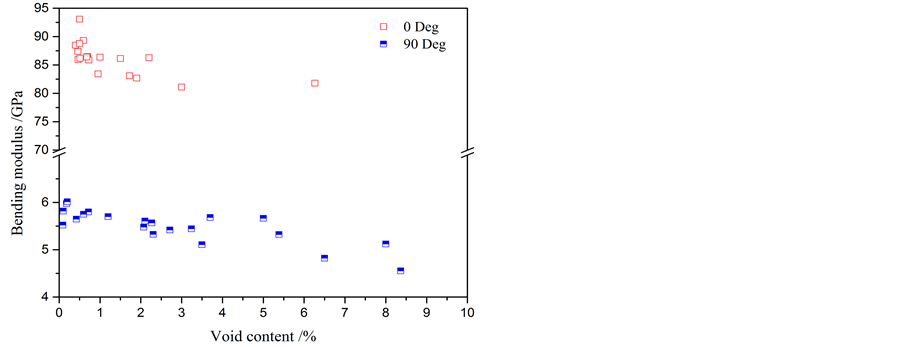
The relationships of void content versus flexure modulus and void content versus flexure strength of both 0 and 90 degree CF/Nylon 6 composites are shown in Figure 11(a) and Figure 11(b), respectively. Results indicate that the flexure modulus and flexural strength decrease with increasing void content of CF/Ny- lon 6 laminates. The flexure modulus and strength of 0 degree CF/Nylon 6 laminates decreased asymptotically with increasing void contents.
Figure 12 presents the flexure modulus and strength fraction results of CF/Nylon 6 laminates. As expected, the performance value decrease with the porosity of laminates. It can be seen in Figure 12 that the flexure strength of
 (a)
(a)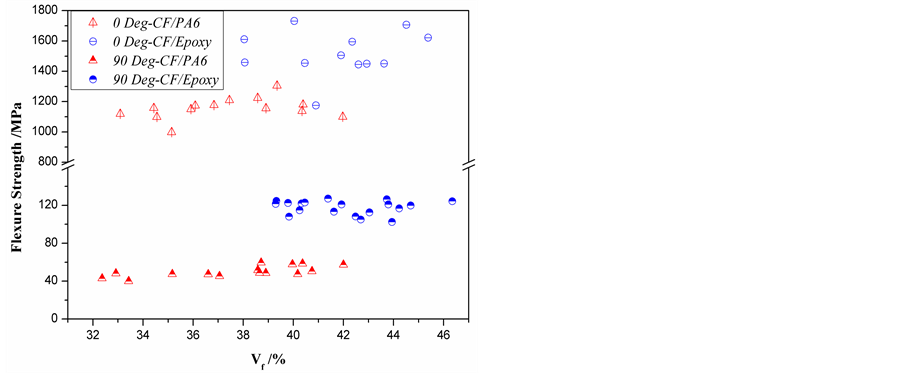 (b)
(b)
Figure 10. Relationship between Vf vs flexure modulus (a) and Vf vs flexure strength (b) of 0 and 90 degree CFRP composites.
 (a)
(a)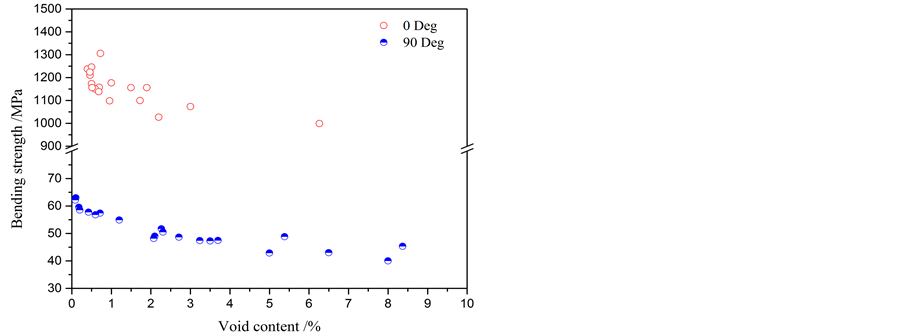 (b)
(b)
Figure 11. Relationship between void content vs flexure modulus (a) and void content vs flexure strength (b) of 0 and 90 degree CF/Nylon 6 composites.
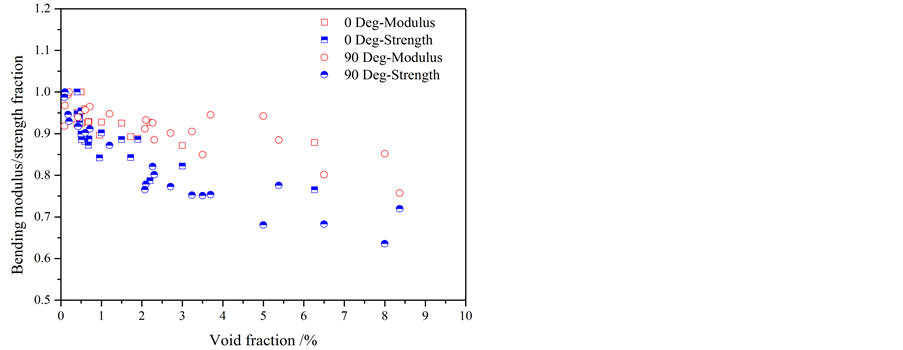
Figure 12. Flexure modulus & strength variation as function of void content of CF/Nylon 6 laminates.
both 0 and 90 degree UD CF/Nylon 6 laminates are more sensitive to the void content than flexure modulus.
3.9. Effect of Fiber Distribution on Flexural Mechanical Properties
The cross sections of10 pieces of CF/Nylon 6 laminates after flexure tests were used to evaluate the fiber distribution. For each pieces of CF/Nylon 6 laminate, three types of unit areas (150 × 50, 150 × 75 and 150 × 150 μm2) were separated respectively and in total more than 50,000 carbon fibers were counted. The Weibull plots of the carbon fiber number including above three types of unit area (150 × 50 μm2 in red, 150 × 75 μm2 in blue and 150 × 150 μm2 in black) are shown in Figure 13. Data of total 10 pieces of laminates (more than half million carbon fibers) were plotted together and fitted to linear relationship as shown in Figure 13. The Weibull parameters of unit area 150 × 50, 150 × 75 and 150 × 150 μm2 are 2.58, 3.14 and 4.42 respectively, which indicates that the bigger variation occurred when decreasing the unit size in the direction of thickness. The results indicate that the lay-up lead to the uniform fiber distribution in CF/Ny- lon 6 laminates, which could be corroborated by the observed cross section as shown in Figure 4(a). The relationship between fiber distribution coefficient and mechanical properties is shown in Figure 14. In total, both flexural modulus and flexural strength of CF/Nylon 6 laminates did not exhibited obvious positive effects or good relationship with fiber distribution coefficient.
3.10. Fracture Behavior
Step-by-step flexure method was employed to investigate the fracture behaviors of both CF/Nylon 6 and CF/Epoxy composites in present study. In detail, 0 degree flexure tests were stopped at deflection of 1 mm, 3 mm, 4.8 mm and ultimate deflection for 0 degree CF/Nylon 6 composites and 2 mm, 3 mm, 5 mm and ultimate deflection for 0 degree CF/Epoxy composites, as shown in Figure 8(a). Meanwhile, 90 degree flexure tests were stopped at deflection of 1 mm, 2 mm, 3.5 mm and ultimate deflection for 90 degree CF/Nylon 6 laminates and 2 mm, 4 mm, 7 mm and ultimate deflection for 90 degree CF/Epoxy laminates, as shown in Figure 8(b).

Figure 13. Weibull plots of the carbon fiber number in three types of unit area in 0 degree CF/Nylon 6 laminates.
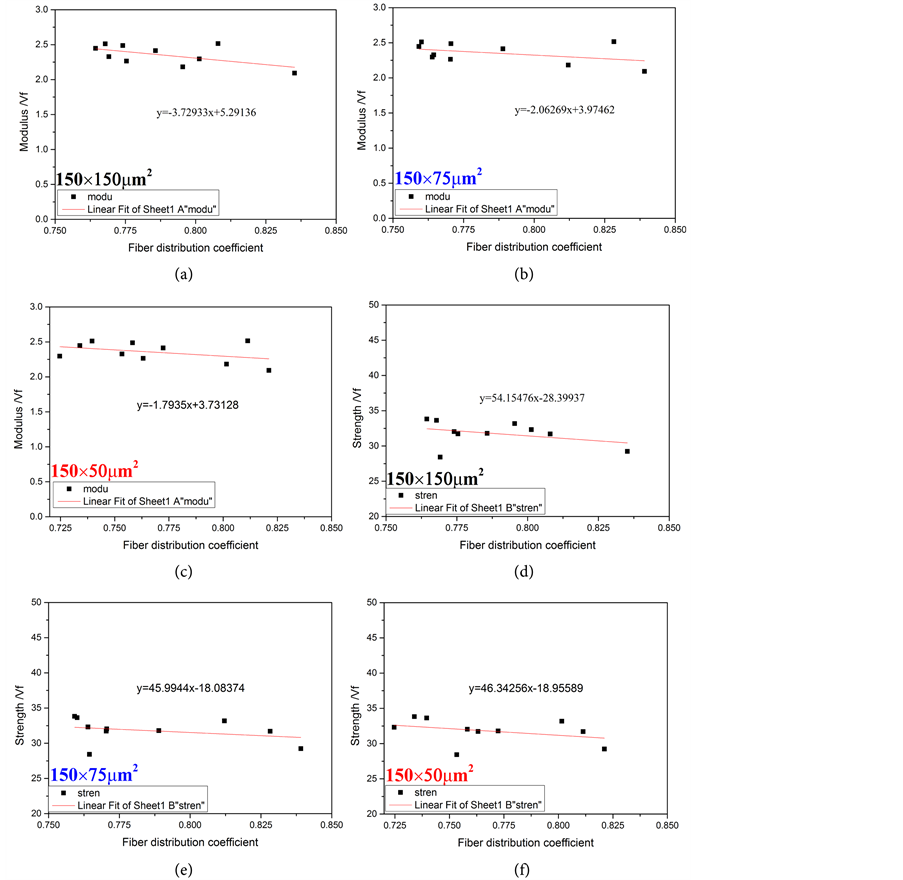
Figure 14. The effect of fiber distribution coefficient on mechanical properties of 0 degree CF/Nylon 6 laminates.
The corresponding polished cross-sections of CF/Nylon 6 and CF/Epoxy laminates are shown in Figure 15 and Figure 16, respectively. The microscope views along fiber direction of crack initiation and propagation in 0 and 90 degree CF/Nylon 6 laminates were shown in Figures 15(I)-(IV) and Figures 15(I')-(IV'), respectively. In Figure 15(I), some fiber concentration areas without enough resin impregnation could be observed in 0 degree CF/Nylon 6 laminate, which was bended with deflection of 1 mm (as shown in Figure 1(a)). With the increase of deflection, initial crack could be found in fiber concentration areas and then crack propagation also could be observed along fiber concentration areas in compression side of 0 degree CF/Nylon 6 laminates as shown in Figure 15(II) and Figure 15(III), respectively. Final fracture of 0 degree CF/ Nylon 6 laminates occurred in the compression side by the coalescence of lots of small cracks that form inside of fiber concentration areas, as shown in

Figure 15. Microscope view along fiber direction of crack initiation and propagation in 0 degree (I-III) and 90 degree (I’-III’) CF/Nylon 6 laminates.
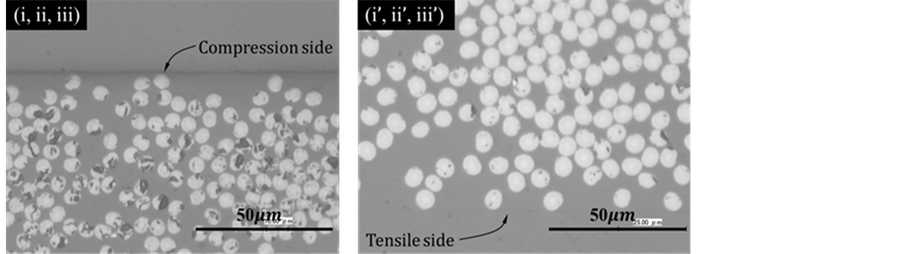
Figure 16. Microscope view along fiber direction of 0 degree (i-iii) and 90 degree (i’-iii’) CF/Epoxy laminates.
Figure 15(IV). Meanwhile, the fracture process of 90 degree CF/Nylon 6 laminates seems similar to 0 degree CF/Nylon 6 laminates. Cracks also initiated from fiber concentration areas without enough resin impregnation and propagated along fiber concentration areas then give rise to final failure as shown from Figure 16(I
The fracture behaviors of 0 and 90 degree CF/Nylon 6 and CF/Epoxy laminates were shown in Figure 17(IV), Figure 17(iv), Figure 17(IV') and Figure 17(iv'), respectively. It is obvious that the first fracture of 0 degree laminates initiated from upper surface (Compression side) while 90 degree laminates initiated from lower surface (Tension side). For both 0 and 90 degree CF/Epoxy laminates with, the specimens were separated into two parts while CF/Nylon 6 laminates not, which related to the fracture toughness difference.
3.11. SEM Observation
The flexure fractured surface of the 90 degree CF/Nylon 6 and CF/Epoxy composites were observed using SEM observation as shown in Figure 18(A) and Figure 18(B), respectively. It is obvious that some carbon fibers were pull-out from the fractured surface of 90 degree CF/Nylon 6 laminates. But for CF/Epoxy laminates, the morphology of fractured surface exhibited a glossy morphology, with lots of banding and resin covering most of carbon fibers on the fractured surfaces. On the other hand, the compression side and tensile side of CF/Nylon 6 laminates were shown in Figure 18(a) and Figure 18(d), respectively. Similarly, CF/Epoxy laminates were shown in Figure 18(c) and Figure 18(d), respectively.
Both Figure 18(A) and Figure 6(b) simply show that interfacial strength between CF and Nylon 6 resin is much lower than CF and Epoxy resin. Rough fracture surface of CF/Nylon 6 laminates and smooth surface of CFs indicated adhesive failure with de-bonding between CF and Nylon 6 resin. By contrast, fracture surface of CF/Epoxy laminate is relatively flat because cohesive is dominant. Fracture occurred within epoxy resin. Meanwhile, some epoxy resin on CFs also indicates the cohesive failure.
4. Conclusion
In this study, typical thermoplastic resin Nylon 6 and thermosetting epoxy resin were used as matrices to manufacture UD CF/Nylon 6 and CF/Epoxy laminates for investigating their mechanical flexure properties and failure behavior. The main results of this work were as follows:
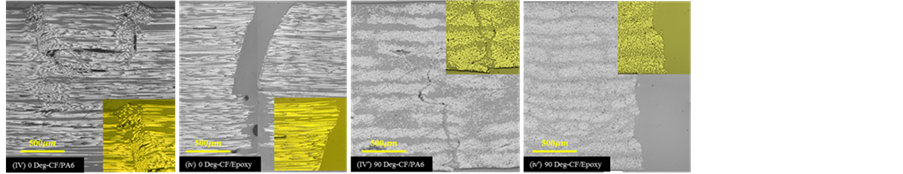
Figure 17. Final flexure fracture of 0 and 90 degree CFRP laminates. (IV) 0 degree CF/Nylon 6, (iv) 0 degree CF/Epoxy, (IV’) 90 degree CF/Nylon 6, (iv’) 90 degree CF/Epoxy.
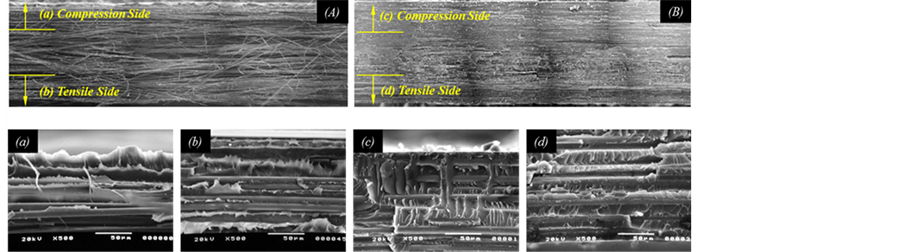
Figure 18. SEM observation of 90 degree CF/Nylon 6 (A) (a) (b) and CF/Epoxy (B) (c) (d) laminates.
1) CF/Nylon 6 laminates exhibited bad fiber distribution and higher void content while CF/Epoxy laminates with similar fiber volume fraction showed uniform fiber distribution and less void content owing to the difference of infiltration capability between two resin systems.
2) Bad fiber distribution in CF/Nylon 6 laminates lead to more void content existed in fiber concentration areas, which has negative effects on their interfacial properties and finally affects the mechanical properties. Especially, 90 degree CF/Epoxy laminates with uniform fiber distribution (less void content, stable interfacial properties) exhibited more than double tensile and flexure strength comparing to CF/Nylon 6 laminates with similar fiber volume fraction.
3) The statistic fiber distribution condition of CF/Nylon 6 laminates were investigated based on a large number of carbon fibers (>half million) and results showed that fiber numbers in each unit area of laminates exhibited fitting Weibull distribution.
4) The positive effects of higher fiber volume fraction and less void content on the flexural mechanical properties were approved in this study. Meanwhile, their hybrid effects on flexural mechanical properties were investigated.
5) The step-by-step optical observation and scanning electron microscope observation were carried out and confirmed that the fiber distribution and interfacial properties affected the failure process of UD laminates in a large extent. Cracks in 0 and 90 degree CF/Nylon 6 laminates initiated from fiber concentration areas without enough resin impregnation then propagated along fiber concentration areas up to final fracture.
The fracture characteristics of UD CF/Nylon 6 composites with ductile matrix included both matrix plasticity and fiber/matrix interfacial failure (belong to adhesive failure mode) while CF/Epoxy composites with brittle matrix showed a glossy appearance with most of matrix failure in fractured surface (belong to Cohesive failure model).
Cite this paper
Ma, Y., Ueda, M., Yokozeki, T., Sugahara, T., Yang, Y.Q. and Hamada, H. (2017) Investigation of the Flexural Properties and Failure Behavior of Unidirectional CF/Nylon 6 and CF/Epoxy Composites. Open Journal of Composite Materials, 7, 227-249. https://doi.org/10.4236/ojcm.2017.74016
References
- 1. Ma, Y., Sugahara, T., Yang, Y. and Hamada, H. (2015) A Study on the Energy Absorption Properties of Carbon/Aramid Fiber Filament Winding Composite Tube. Composite Structures, 123, 301-311.
- 2. Ma, Y., Ueda, M., Yokozeki, T., Sugahara, T., Yang, Y. and Hamada, H. (2017) A Comparative Study of the Mechanical Properties and Failure Behavior of Carbon Fiber/Epoxy and Carbon Fiber/Polyamide 6 Unidirectional Composites. Composite Structures, 160, 89-99.
- 3. Ma, Y., Yang, Y., Sugahara, T. and Hamada, H. (2016) A Study on the Failure Behavior and Mechanical Properties of Unidirectional Fiber Reinforced Thermosetting and Thermoplastic Composites. Composites Part B: Engineering, 99, 162-172.
- 4. Ma, Y., Zhang, Y., Sugahara, T., Jin, S., Yang, Y. and Hamada, H. (2016) Off-Axis Tensile Fatigue Assessment Based on Residual Strength for the Unidirectional 45 Carbon Fiber-Reinforced Composite at Room Temperature. Composites Part A: Applied Science and Manufacturing, 90, 711-723.
- 5. Xu, J., Ma, Y., Zhang, Q., Sugahara, T., Yang, Y. and Hamada, H. (2016) Crashworthiness of Carbon Fiber Hybrid Composite Tubes Molded by Filament Winding. Composite Structures, 139, 130-140.
- 6. Lau, K.T., Zhou, L.M., Tse, P.C. and Yuan, L.B. (2002) Applications of Composites, Optical Fibre Sensors and Smart Composites for Concrete Rehabilitation: An Overview. Applied Composite Materials, 9, 221-247.
https://doi.org/10.1023/A:1016051903029 - 7. Ning, H., Vaidya, U., Janowski, G.M. and Husman, G. (2007) Design, Manufacture and Analysis of a Thermoplastic Composite Frame Structure for Mass Transit. Composite Structures, 80, 105-116.
- 8. Sampaio, R.M. and Sales, C.L. (2012) On the Effect of Geometrical Designs and Failure Modes in Composite Axial Crushing: A Literature Review. Composite Structures, 94, 803-812.
- 9. Melro, A.R., Camanho, P.P. and Pinho, S.T. (2012) Influence of Geometrical Parameters on the Elastic Response of Unidirectional Composite Materials. Composite Structures, 94, 3223-3231.
- 10. Lu, L., Lim, C.Y.H. and Yeong, W.M. (2004) Effect of Reinforcements on Strength of Mg 9% Al Composites. Composite Structures, 66, 41-45.
- 11. Brahim, S.B. and Cheikh, R.B. (2007) Influence of Fibre Orientation and Volume Fraction on the Tensile Properties of Unidirectional Alfa-Polyester Composite. Composites Science and Technology, 67, 140-147.
- 12. Fitzer, E., Huttner, W. and Manoch, T.M. (1980) Influence of Process Parameters on the Mechanical Properties of Carbon/Carbon-Composites with Pitch as Matrix Precursor. Carbon, 18, 291-295.
- 13. Subagia, I.D.G.A., Kim, Y., Tijing, L.D., Kim, C.S. and Shon, H.K. (2014) Effect of Stacking Sequence on the Flexural Properties of Hybrid Composites Reinforced with Carbon and Basalt Fibers. Composites Part B: Engineering, 58, 251-258.
- 14. Yan, R., Wang, R., Lou, CW. and Lin, J.H. (2015) Low-Velocity Impact and Static Behaviors of High-Resilience Thermal-Bonding Inter/Intra-Ply Hybrid Composites. Composites Part B: Engineering, 69, 58-68.
- 15. Yokozeki, T., Aoki, T., Ogasawara, T. and Ishikawa, T. (2005) Effects of Layup Angle and Ply Thickness on Matrix Crack Interaction in Contiguous Plies of Composite Laminates. Composites Part A: Applied Science and Manufacturing, 36, 1229-1235.
- 16. Manikandan, V., Jappes, J.T.W., Kumar, S.M.S. and Amuthakkannan, P. (2012) Investigation of the Effect of Surface Modifications on the Mechanical Properties of Basalt Fibre Reinforced Polymer Composites. Composites Part B: Engineering, 43, 812-818.
- 17. Subramaniyan, A.K. and Sun, C.T. (2007) Toughening Polymeric Composites Using Nanoclay: Crack Tip Scale Effects on Fracture Toughness. Composites Part A: Applied Science and Manufacturing, 38, 34-43.
- 18. Xu, Y. and Hoa, S.V. (2008) Mechanical Properties of Carbon Fiber Reinforced Epoxy/Clay Nanocomposites. Composites Science and Technology, 68, 854-861.
- 19. Wetzel, B., Haupert, F. and Ming, Q.Z. (2003) Epoxy Nanocomposites with High Mechanical and Tribological Performance. Composites Science and Technology, 63, 2055-2067.
- 20. El-Abbassi, F.E, Assarar, M., Ayad, R. and Lamdouar, N. (2015) Effect of Alkali Treatment on Alfa Fibre as Reinforcement for Polypropylene Based Eco-Composites: Mechanical Behaviour and Water Ageing. Composite Structures, 133, 451-457.
- 21. Fiore, V., Bella, G.D. and Valenza, A. (2015) The Effect of Alkaline Treatment on Mechanical Properties of Kenaf Fibers and Their Epoxy Composites. Composites Part B: Engineering, 68, 14-21.
- 22. Boccardi, S., Meola, C., Carlomagno, G.M., Sorrentino, L., Simeoli, G. and Russo, P. (2016) Effects of Interface Strength Gradation on Impact Damage Mechanisms in Polypropylene/Woven Glass Fabric Composites. Composites Part B: Engineering, 90, 179-187.
- 23. Lu, T., Liu, S., Jiang, M., Xu, X., Wang, Y., Wang, Z., Guo, J., Hui, D. and Zhou, Z. (2014) Effects of Modifications of Bamboo Cellulose Fibers on the Improved Mechanical Properties of Cellulose Reinforced Poly (lacticacid) Composites. Composites Part B: Engineering, 62, 191-197.
- 24. Potluri, P., Manan, A., Francke, M. and Day, R.J. (2006) Flexural and Torsional Behaviour of Biaxial and Triaxial Braided Composite Structures. Composite Structures, 75, 377-386.
- 25. Huang, Z.M. (2004) Ultimate Strength of a Composite Cylinder Subjected to Three-Point Bending: Correlation of Beam Theory with Experiment. Composite Structures, 63, 439-445.
- 26. Upadhyay, A.K. and Shukla, K.K. (2012) Large Deformation Flexural Behavior of Laminated Composite Skew Plates: An Analytical Approach. Composite Structures, 94, 3722-3735.
- 27. Lassila, L.V. and Vallittu, P.K. (2004) The Effect of Fiber Position and Polymerization Condition on the Flexural Properties of Fiber-Reinforced Composite. Journal of Contemporary Dental Practice, 5, 14-26.
- 28. Hagstrand, P.O., Bonjour, F. and Manson, J.A.E. (2005) The Influence of Void Content on the Structural Flexural Performance of Unidirectional Glass Fibre Reinforced Polypropylene Composites. Composites Part A: Applied Science and Manufacturing, 36, 705-714.
- 29. ASTM D3039 (2014) Standard Test Method for Tensile Properties of Polymer Matrix Composite Materials. American Society of Testing Materials, West Conshohocken.
- 30. ASTM D7264/D7264M-15 (2015) Standard Test Method for Flexural Properties of Polymer Matrix Composite Materials. American Society of Testing Materials, West Conshohocken.
- 31. ASTM D5045-14 (2014) Standard Test Methods for Plane-Strain Fracture Toughness and Strain Energy Release Rate of Plastic Materials. American Society of Testing Materials, West Conshohocken.
- 32. Torigoe, S.I., Horikoshi, T., Ogawa, A., Saito, T. and Hamada, T. (2003) Study on Evaluation Method for PVA Fiber Distribution in Engineered Cementitious Composite. Journal of Advanced Concrete Technology, 1, 265-268.
https://doi.org/10.3151/jact.1.265 - 33. Zhou, J., Qian, S., Ye, G., Copuroglu, O., Breugel, K.V. and Li, V.C. (2012) Improved Fiber Distribution and Mechanical Properties of Engineered Cementitious Composites by Adjusting the Mixing Sequence. Cement and Concrete Composites, 34, 342-348.
- 34. Taketa, I. (2011) Analysis of Failure Mechanisms and Hybrid Effects in Carbon Fibre Reinforced Thermo-Plastic Composites. PhD Thesis, Katholieke Universiteit Leuven, Belgium.
- 35. Liu, W., Zhang, S., Li, B., Yang, F., Jiao, W., Hao, L. and Wang, R.G. (2014) Improvement in Interfacial Shear Strength and Fracture Toughness for Carbon Fiber Reinforced Epoxy Composite by Fiber Sizing. Polymer Composites, 35, 482-488.
https://doi.org/10.1002/pc.22685 - 36. Zhu, M., Li, M., Wu, Q., Gu, Y., Li, Y. and Zhang, Z. (2014) Effect of Processing Temperature on the Micro- and Macro-Interfacial Properties of Carbon Fiber/Epoxy Composites. Composite Interfaces, 21, 443-453.
https://doi.org/10.1080/15685543.2014.877270 - 37. Sharma, M., Gao, S., Mader, E., Sharma, H., Wei, L.Y. and Bijwe, J. (2014) Carbon Fiber Surfaces and Composite Interphases. Composites Science and Technology, 102, 35-50.
- 38. Weibull, W.A. (1951) Statistical Distribution Function of Wide Applicability. Journal of Applied Mechanics, 103, 293-297.
- 39. Naito, K., Tanaka, Y., Yang, J.M. and Kagawa, Y. (2008) Tensile Properties of Ultrahigh Strength PAN-Based, Ultrahigh Modulus Pitch-Based and High Ductility Pitch-Based Carbon Fibers. Carbon, 46, 189-195.
- 40. Ma, J. and Yan, Y. (2013) Quasi-Static and Dynamic Experiment Investigations on the Crashworthiness Response of Composite Tubes. Polymer Composites, 34, 1099-1109.
https://doi.org/10.1002/pc.22518