Open Journal of Composite Materials
Vol.4 No.1(2014), Article ID:41985,14 pages DOI:10.4236/ojcm.2014.41006
Automatic Damage Detection and Monitoring of a Stitch Laminate System Using a Fiber Bragg Grating Strain Sensor
![]()
1Department of Aerospace Engineering, Tokyo Metropolitan University, Tokyo, Japan; 2Composite Technology Centre, Japan Aerospace Exploration Agency, Tokyo, Japan.
Email: *trilaksono-agus@sd.tmu.ac.jp
Copyright © 2014 Agus Trilaksono et al. This is an open access article distributed under the Creative Commons Attribution License, which permits unrestricted use, distribution, and reproduction in any medium, provided the original work is properly cited. In accordance of the Creative Commons Attribution License all Copyrights © 2014 are reserved for SCIRP and the owner of the intellectual property Agus Trilaksono et al. All Copyright © 2014 are guarded by law and by SCIRP as a guardian.
Received October 8th, 2013; revised November 8h, 2013; accepted November 15th, 2013
KEYWORDS
Carbon Fiber; Stitch Laminate; Damage Tolerance; Structural Health Monitoring
ABSTRACT
There are numerous aspects and questions related to the use of composite materials for primary structures in aircraft where the structural integrity is the most important factor. This is especially true if the main concerns are that the material should have good reliability and durability for the primary structural application. Composite laminates are highly sensitive to out-of-plane failure due to their low inter laminar fracture toughness. An alternate method to increase the damage resistance is through three-dimensional fibrous reinforcement such as through-the-thickness stitching with a single fiber as the thread. Recent studies have shown that the stitching of standard laminates can enhance damage tolerance to levels obtainable with toughened resin systems. However, for next-generation aircraft, material improvement alone is not enough to assure or increase the safety and reliability of the structure. Continuous damage monitoring during operation will become an important issue in aircraft safety. Embed ding fiber Bragg grating (FBG) technology into the composite structure as strain sensors could potentially solve the above problem because the FBG can be used to detect and characterize the damage before it reaches a critical stage. The model used to represent this problem is a 6 × 6 Vectran stitched carbon/ epoxy laminate under tension loading, and the real-time monitoring using the FBG strain sensors is combined with acoustic emissions that were conducted during the test. A numerical laminate theory using a rebar element and first-ply failure criterion is performed to determine the preferred area on the specimen for the placement of the FBG before manufacturing and testing. Experiments are presented to determine the damage growth that was quantified with an ultrasonic (water immersion) c-scan. In this research, the FBG successfully detected and characterized the damage in the carbon/epoxy stitch laminate caused in tension loading cases. The FBG is enhanced with acoustic emission data and can quantitatively predict the damage growth.
1. Introduction
The use of composite materials in the aerospace industry has increased in the past three decades due to their strength-to-weight benefit. Composite airframes in commercial transport were progressing such that it was expected to have wings made entirely of composites before 2000, all-composite fuselages after the year 2000, and entire airframes made from composites around 2010. Unfortunately, the progression in the usage of composites did not meet these expectations due to failure complexities that created difficulties in the certificate phase, even though the trend in transport aircraft size and flight range has been steadily increasing; for example, the Airbus commercial plane as shown in Figure 1.
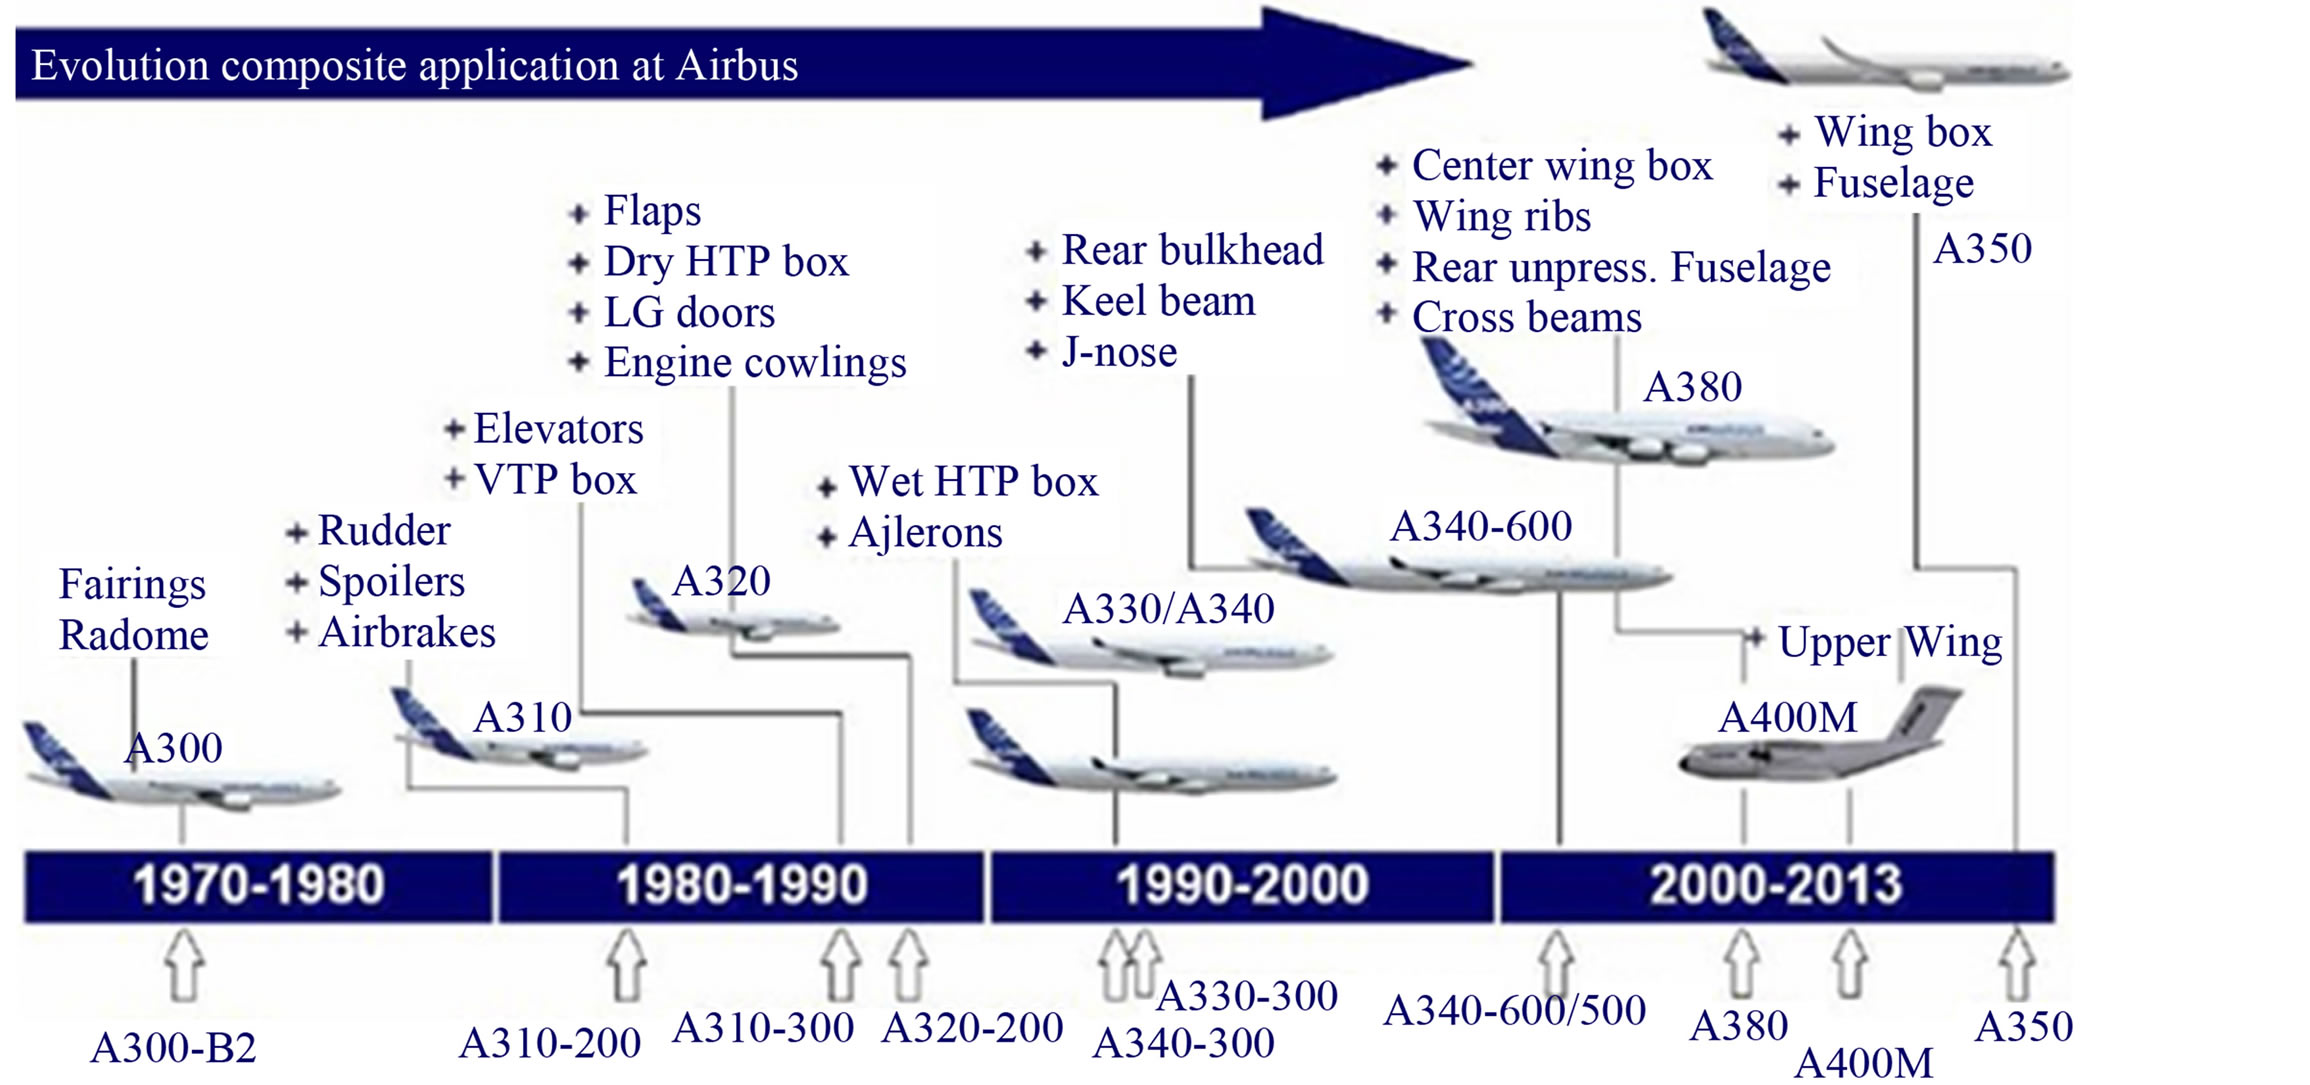
Figure 1. Composite application in commercial transport aircraft.
Failure in composites is not only influenced by the type of loading but also by the fiber properties, the resin properties, the stacking sequence of the plies, the residual stresses, and environmental degradation. Failure is initiated at the local level in an individual ply or at the interface between plies, but ultimate failure in multi-directional laminates may not occur until the failure has propagated to several plies. However, the stresses in each ply depend on the modulus of the ply and vary discontinuously through the thickness of the laminate. Thus, describing the failure of the laminate as a mean stress averaged through the thickness of the laminate is therefore only accurate for a particular lay-up. The prediction of failure in multi-directional laminates usually requires the determination of strains and stresses for each ply in the material axes for the ply. Ultimate failure is then predicted by monitoring the progression of failure through the laminate. Different types of failure need to be assessed when evaluating the strength of a laminate, including matrix cracking, splitting, and first ply failure [1-4].
The prediction of through-thickness failure has proved to be more difficult. This transverse failure occurs in the matrix and is a failure of the resin in either shear or tension. It depends on the total state of stress or strain in the matrix, including the stresses introduced by the manufacturing of the component [5-8]. It is important to improve the safety and reliability of composite materials with complex failure mechanisms. One improvement method is to embed FBG strain sensors during the manufacturing process that can be used to monitor the damage caused to the composite during operation. Another improvement method is to increase damage resistance with three-dimensional fibrous reinforcement such as the through-thickness stitching with a single fiber as threads illustrated in Figure 2.
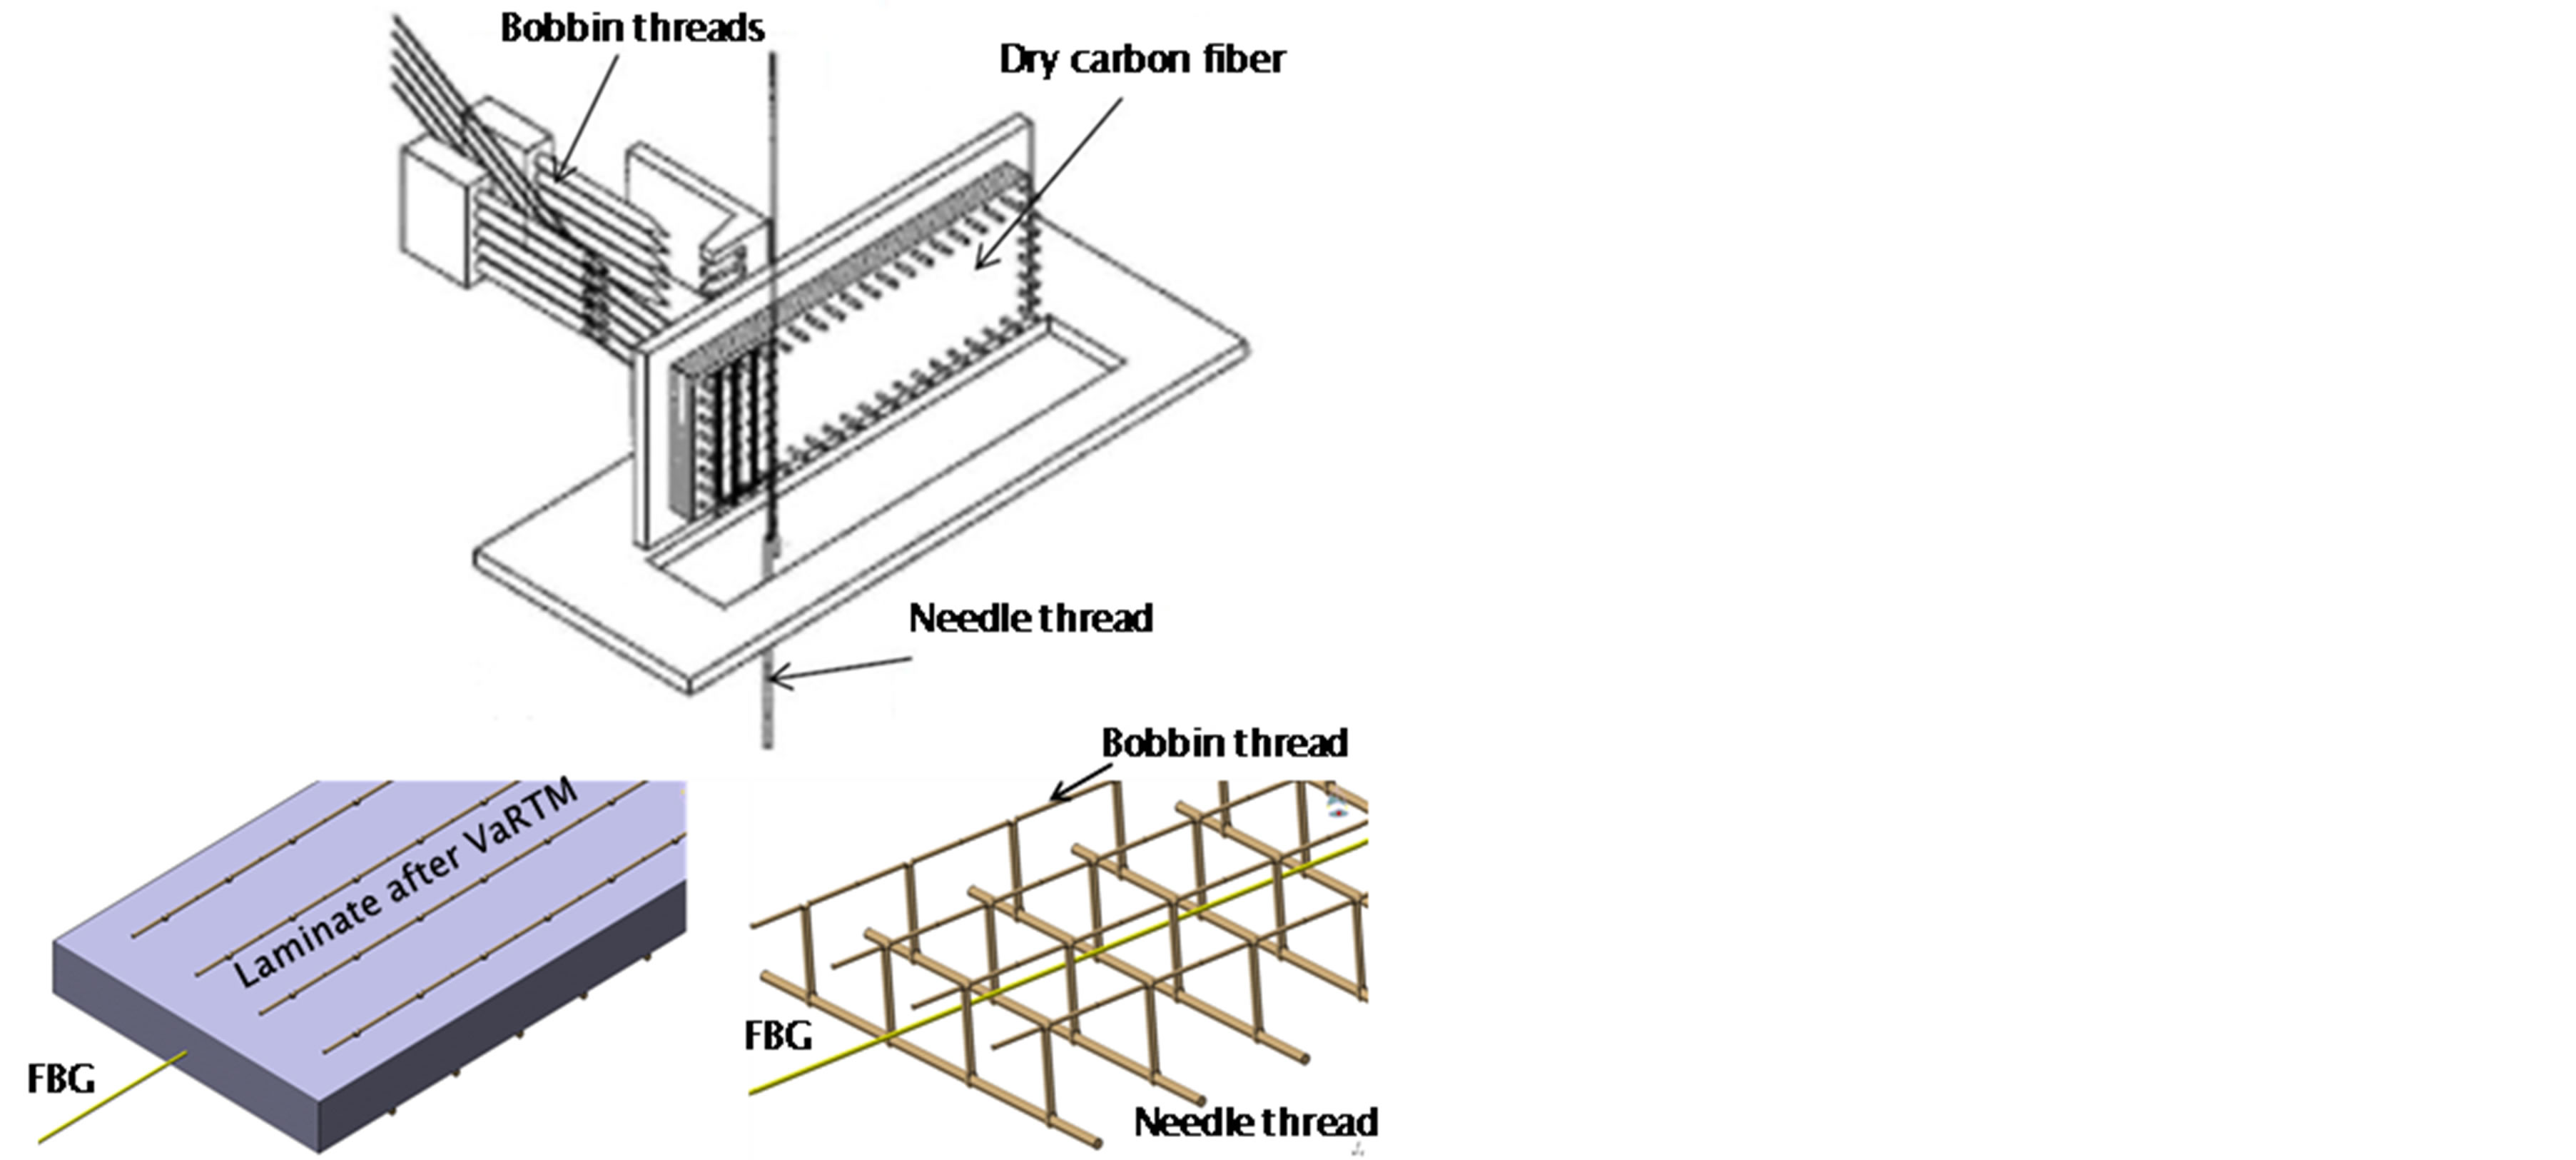
Figure 2. Stitched laminate sequential processes by Toyota, Inc.
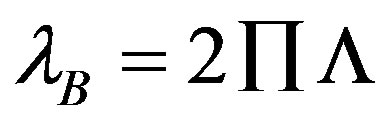
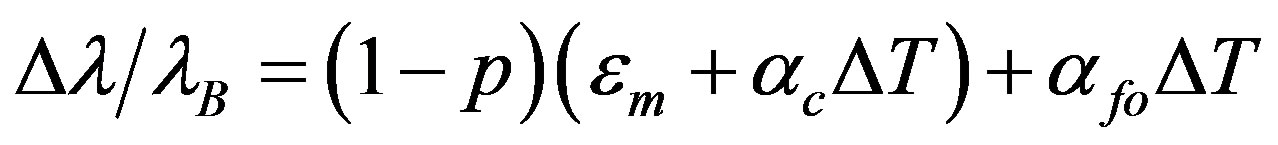
The main concept of the fiber Bragg grating (FBG) implementation in a composite structure is to mimichuman neural networks. The Bragg wavelength (λB), which is reflected, is defined by the Fresnel reflection according to the following relationships (illustrated in Figure 3) [9, 10]:
 (1)
(1)
 (2)
(2)
where P is the effective refractive index of the grating in the fiber core and  is the grating period. Additionally,
 = wavelength shift
 = base wavelength at test start p = photoelastic coefficient (p = 0.22)
 = mechanical strain
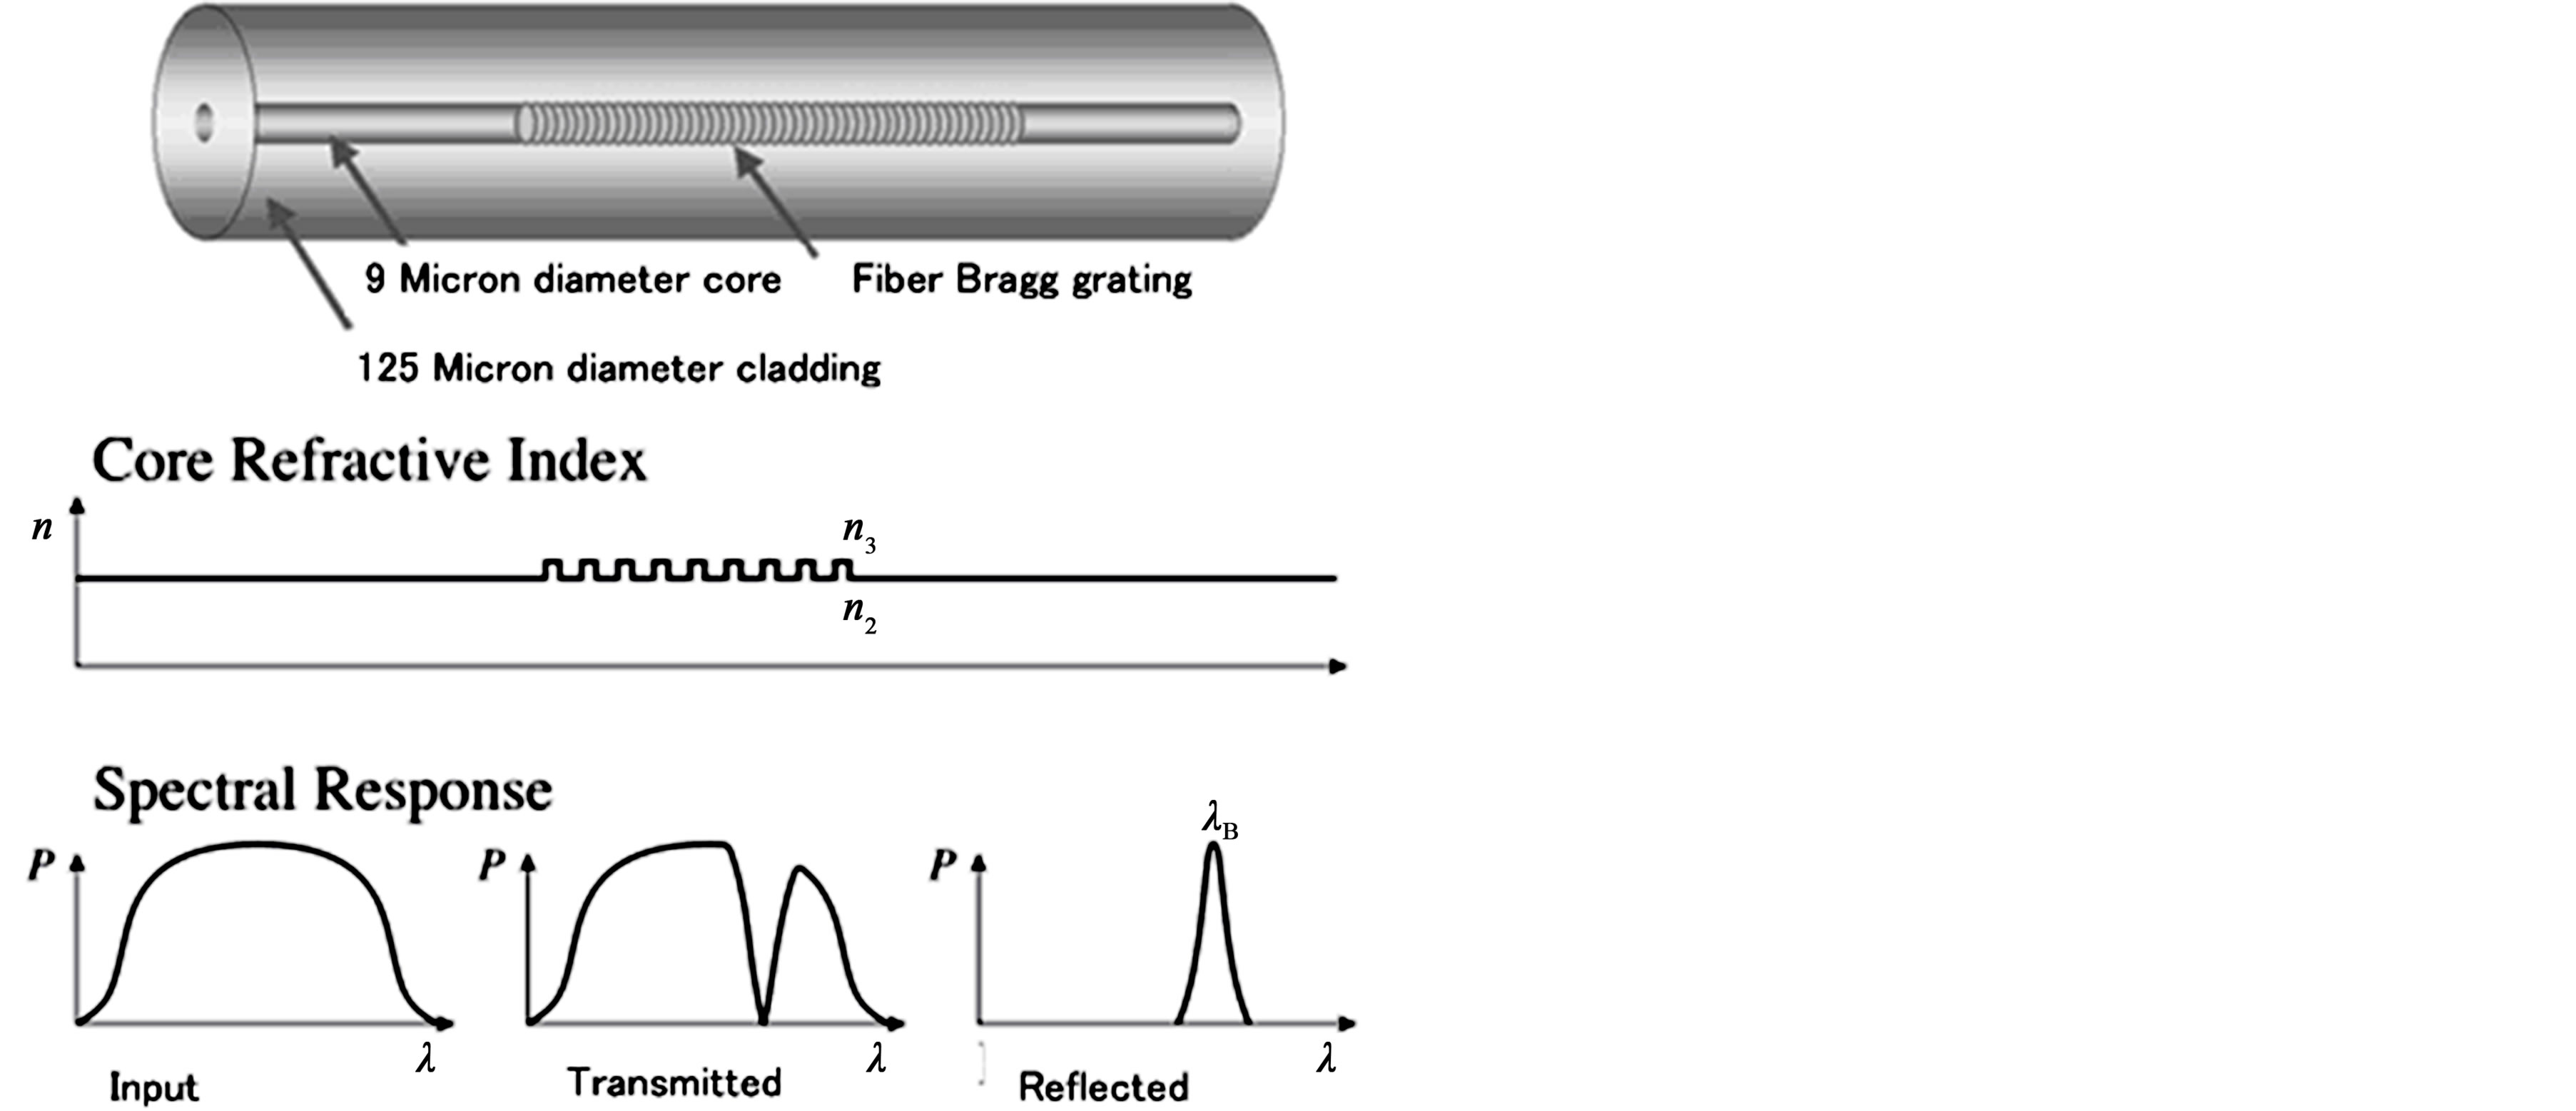
Figure 3. Fiber Bragg grating optics and illustration of the theory.
ΔT = temperature change in K
 = coefficient of thermal expansion of the composite
 = coefficient of thermal expansion of the fiber optic The main purpose of the present research is to use an FBG strain sensor to automatically detect damage in a stitched laminate “system” and then to quantify the damage with a non-destructive inspection. The specimen models are manufactured with the vacuum-assisted resin transfer moulding technique using fully stitched unidirectional carbon preforms. The primary focus of this report is to summarize the qualitative empirical investigations of selectively stitched 6 × 6 Vectran HT panels using a numerical analysis scenario of the FBG placement. The results of a tensile static test on the selectively stitched panels are compared with the damage quantification and growth as measured using a non-destructive test, specifically, an ultrasound c-scan. The paper is organized as follows: Section 2 discusses the general material design concepts; Section 3 introduces the methodology of the numerical approach; Section 4 presents the empirical approach in the static case; Section 5 presents the non destructive inspection, and Section 6 presents the conclusions.
2. General Material Design Concepts
One of the outstanding features of composite structures is their ability to be tailored, through cross-plying, to match individual loading or stiffness requirements. Therefore, it follows that many types of different cross-plied laminates are likely to be encountered in different applications. Each of these laminates is unique in its properties and characteristics and, hence, must be distinctly identified whenever it is to be associated with specific quantitative or numerical data. A laminate ply and orientation code has been defined very well in laminate theory. After the selection of the fiber/matrix material, the design process concentrates on the lamination rationale: for a particular cross-section of the structure, how many plies are required and what are their angular orientations and what is the stacking sequence? Some have proposed that a standard quasi-isotropic (0/±45/90) laminate be used in the majority of structures, but this approach diminishes the primary advantage of advanced composites: their highly specific directional properties. There exists no universal lamination geometry that effectively satisfies the variety of loading requirements. The lamination geometry must be determined based on the stress state (i.e., magnitude, direction, and combined biaxial and shear) and the strength and/or stiffness requirements to realize the potential structural efficiency of composites. The stiffness requirements may be based on laminate buckling (flexural), static structural deformation (in plane), or aeroelastic restraints, e.g., flutter. The degrees-of-freedom of both the material properties and the design restraints should be sufficient such that a systematic approach to determine the lamination geometry is possible.
In this research, the quasi-isotropic lay-up was selected because the FBG will be used to detect damage in a material system, and the FBG is expected to detect and quantify the total damage in the laminate with varying layer orientations. The FBG is also expected to fail adjacent to the location of the total laminate failure to obtain the spectrum behavioral relationship between the FBG reading and the mechanical behave or. The FBG placement is described in detail in Chapter 3.
Material and Specimen Preparation
The specimens were made using 20-ply quasi-isotropic [45/90/-45/02/45/902/-45/0] unidirectional carbon fiber T800SC-24K (Toray Industries) and stitched along the through-thickness direction with a stitch pitch (distance between two adjacent stitches in the same row) and stitch space (spacing between two adjacent stitch rows) of 6 mm. The laminate had the following mechanical properties:  = 1721 MPa,
  = 1000 MPa,
  = 105 MPa,
  = 132.66 GPa,
  = 12.06 GPa,
  = 3.72 GPa, and
  = 0.36. The stitch material had the following mechanical properties:
  = 72 Gpa and
  = 0.3.
The type of stitch used in this study is the modified lock stitch, made by Toyota, Inc., which avoids disruption to the laminate from any interior looping processes between the bobbin and needle threads; it is also easier to observe the interlock region between the needle and bobbin thread at the face of the laminate with this particular stitch. The fabrication of dry preforms involves the layup and selective stitching of fabric layers with Vectran HT threads by Kuraray Inc. A 400-denier Vectran HT thread was selected for the stitching and for the bobbin. The selective stitching processwas done on a Toyota, Inc. machine with a working platform capable of handling up to 30- × 30- × 2-cm preforms. Bleeder plies were placed atthe center where two vacuum ports were to be located. A rectangular steel framecovered with a porous ply was inserted to keep the vacuum ports and the bleeder plies apart to avoid resin flow into the vacuum ports. Air weave breathers were used to cover the topside, and the entire as sembly was vacuum bagged with the edges sealed with a sealant tape. After attaching two vacuum lines, a leak test was performed, as shown in Figure 4. After the stitching process, the resin transfer molding technique, at a curing temperature of 180˚C, was used to consolidate the composite. The resin used in this case is RTM6 made by Hexcel.
An FBG was embedded in the interface between ply no.8 and ply no.9. This area was chosen because it will become almost closed in the case of total failure. The FBG had a grating span of 15 mm and was made using Fujikura Optical Fiber with Ø 125 mm.
3. Finite Element Modelling
3.1. Methodology
A finite element model of a stitch laminate was developed using the finite element code of ABAQUS. To determine the mechanical behavior accurately, including the interface load transfer between the stitch and the host/laminate, three-dimensional modelling was required, where the pair contact between the stitch to laminate was modelledrebar material. Finite element analyses of nonconventional laminate such as with additional throughthe-thickness stitching with a single fiber as the thread requires adequate methods to characterize the highly anisotropic behavior induced by cords in normal direction orientation embedded in a host material, laminate as shown in Figure 5. A typical example of this class of structures is usually used in automobile tires analysis. Currently most numerical analyses of cord-reinforced composite materials are based on theories and techniques originally developed for laminated fibrous composites, with several arbitrarily oriented cords/threads and the host

Figure 4. VaRTM sketch.
Figure 5. 3D modelling of cord-reinforced composites using rebar-elements.
material being represented within one single finite element on the basis of an anisotropic constitutive law. An alternative computational approach on the basis of socalled rebar elements which previously has been successfully applied in computational mechanics of reinforced concrete structures in the context of the infinitesimal theory, see, e.g., Mang and Meschke (1991), turned out to be remarkably effective in finite strain analyses of cord-reinforced rubber composite material, e.g., Helnwein et al. (1993). This technique completely circumvents the drawbacks associated with “averaging formulations” without significant additional computational efforts. In particular, it provides a mechanically proper description of the different constituents in the framework of large strain theories.
For the element modelling, the laminate was modelled using an 8-node quadrilateral in-plane continuum shell with hourglass control and multiple elements in the thickness direction, which improves the performance of the elements in bending. The stitching thread was modelled using 8-node linear bricks with hourglass control, which produced a more accurate representation of the curved surface. Symmetry was assumed along the length of the specimen model and the model thus was reduced to a half model to reduce the computational time. The analyses were performed with a tensile load applied to one end of the joint, which was free to move in the longi- tudinal (x) direction only (uyuz = 0). The opposite end of the joint had clamped boundary conditions (uxuyuz = 0).
3.2. Rebar-Elements; in General
Rebar elements [11,12] may be characterized as “overlay” elements that represent one or more cord layers with arbitrary orientation in conjunction with corresponding elements representing the matrix material as shown in Figure 6. The matrix element and the “overlay” element share the same nodal points. Therefore, no additional degrees of freedom are introduced. A recent paper by Helnwein et al. (1993) demonstrated, that this well known methodology which has been employed successfully in computational mechanics of reinforced concrete structures is well suited for the analysis of reinforced composite materials when extended to the large strain regime. This approach possesses a number of desirable features when compared to standard models based on techniques developed for laminated fibrous materials:
ü The different components-several unidirectional laminae and the matrix material-are represented completely separately. As far as the cord layers are concerned, formulations of the Neo-Hookean type with different material parameters for different layers within one element may be applied. Consideration of micro buckling or of plastification of the cords does not constitute any additional difficulties.
ü Several cord layers may be represented within one single element without inducing any additional discretization error. This makes the use of rebar elements particularly efficient in large scale 3D analyses.
ü Experimentally obtained material parameters of the individual components may be used directly as input parameters for the analyses.
ü The (true) stress state is obtained separately in the different plies and in the matrix material, respectively.
The geometry of the rebar layers is defined in the context of 3D isoparametric elements, characterized by the map
Where  , XA are the interpolated and the nodal coordinates in the reference configuration, respectively,
  are the shape functions, and
  are the natural coordinates in the isoparametric domain and N is the number of nodal points in the element. Figure 6(a) contains the geometry of the cord layer in the host element, Figure 6(b) illustrates the corresponding configuration in the isoparametric mapping. The numbers 1, 2, 3, 4 denote the integration points in one layer. The spatial position and direction of the rebar fibres is defined for each layer in the isoparametric domain at η integration points by the values
  and Tn.
Which are input by means of a subroutine  denotes the distance of the rebar fiber from the middle surface of the element at each integration point n. The spatial position of a rebar layer within the element is then defined by the shape functions Nr,R as;
In the present context, the geometry of a rebar layer is approximated by a bilinear form defined in the isoparametric parent element, with the natural coordinates of the
 (a)
(a)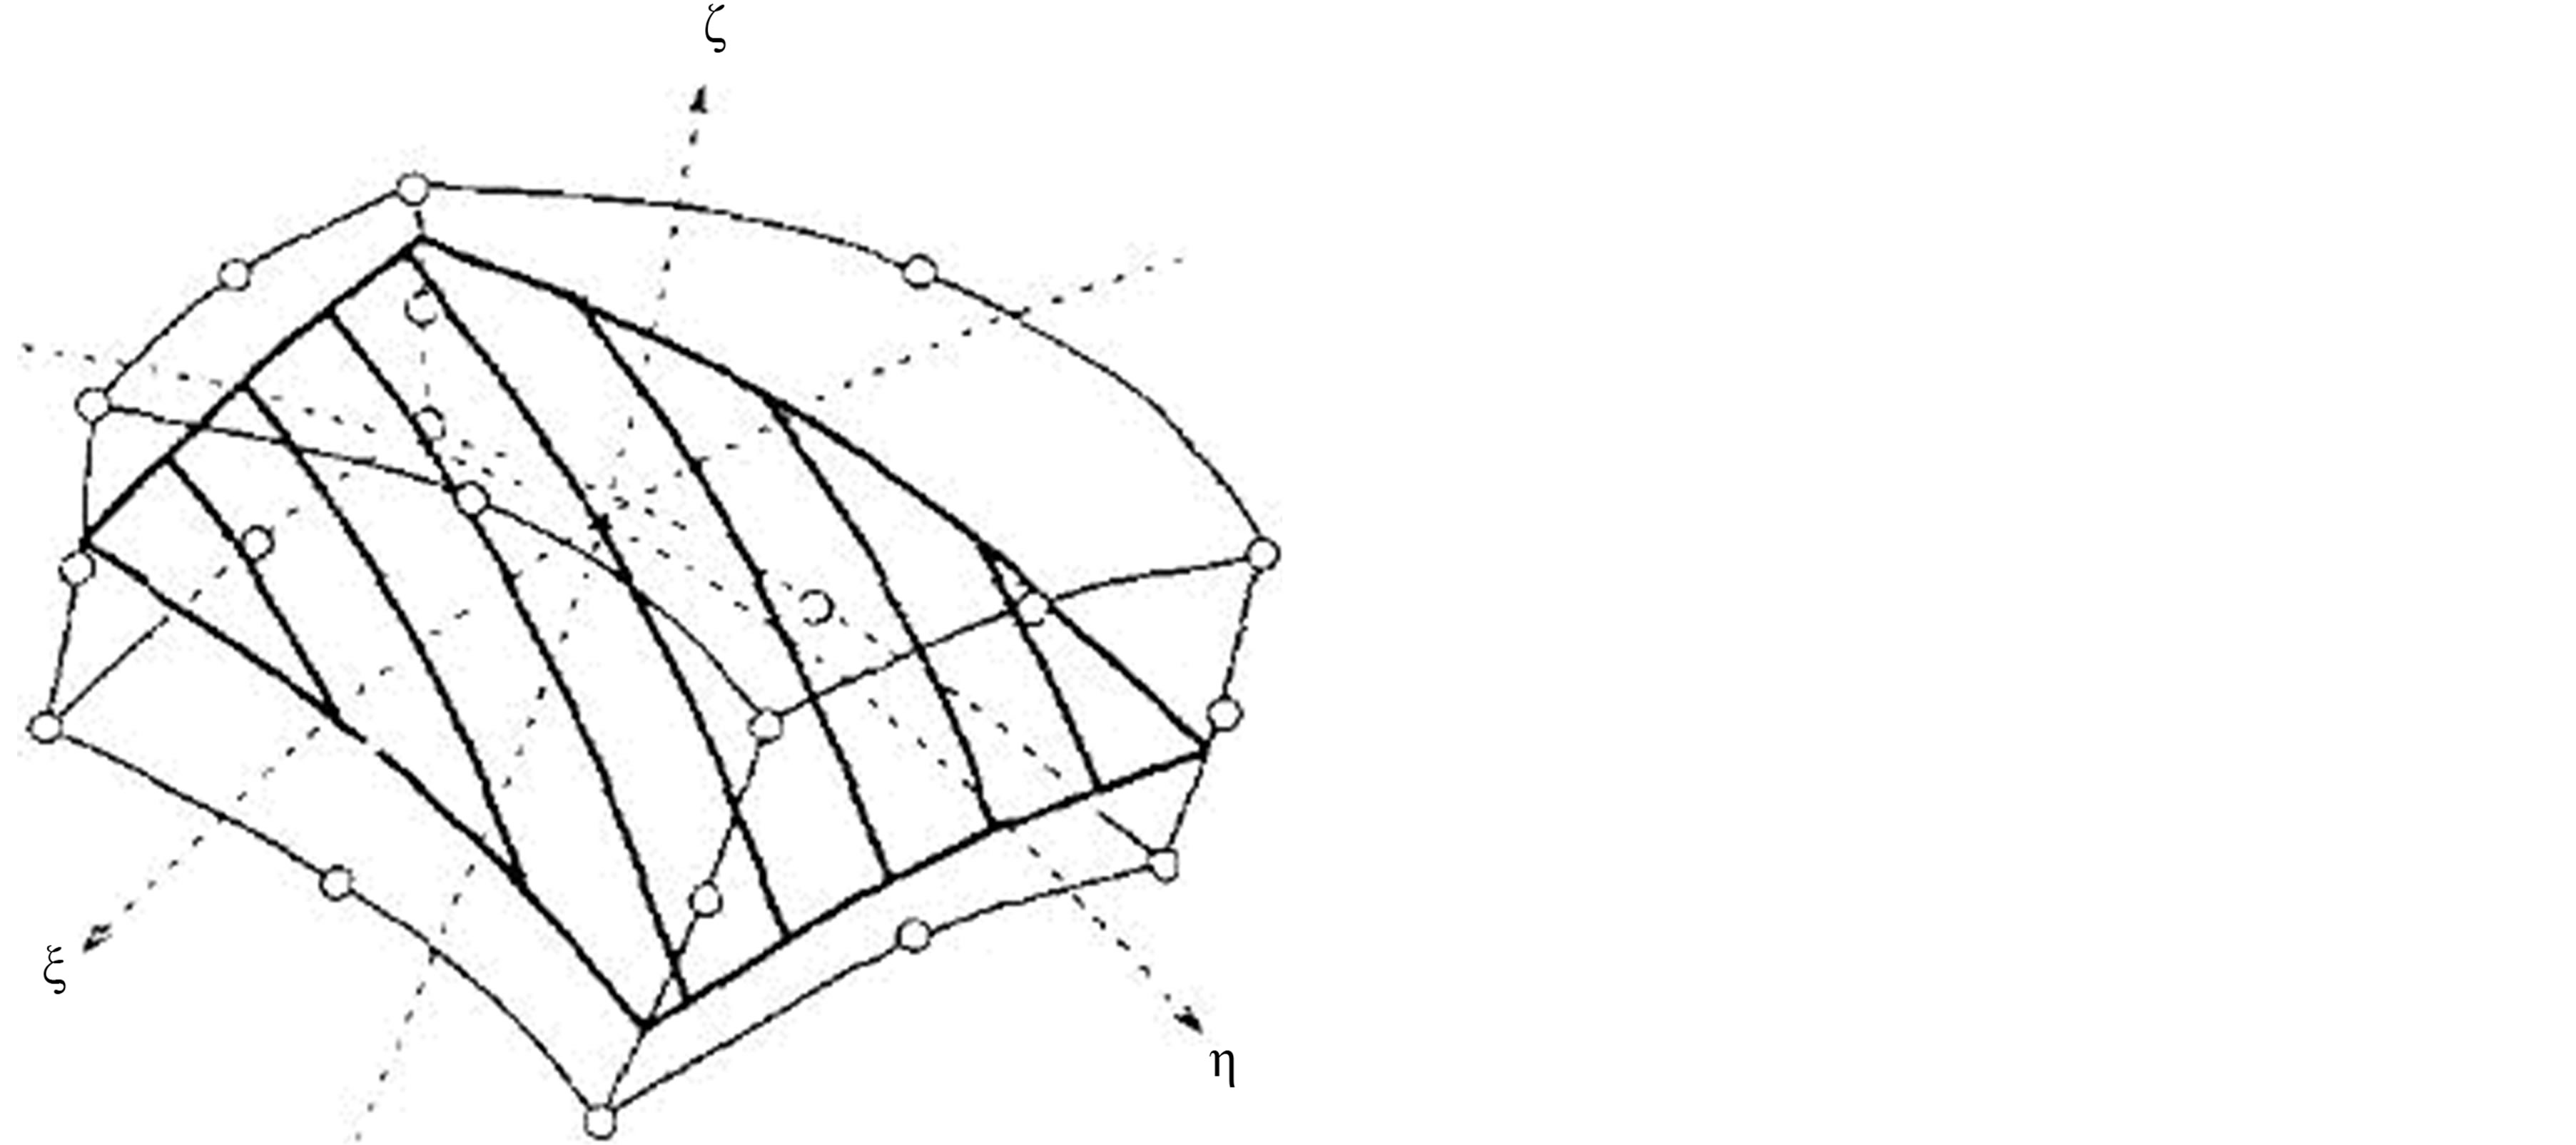 (b)
(b)
Figure 6. Typical rebar layer in a 20-node isoparametric element. (a) Geometry in the host element; (b) Geometry in the isoparametric domain.
integration points.
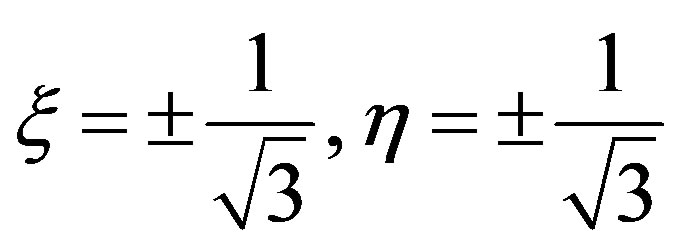
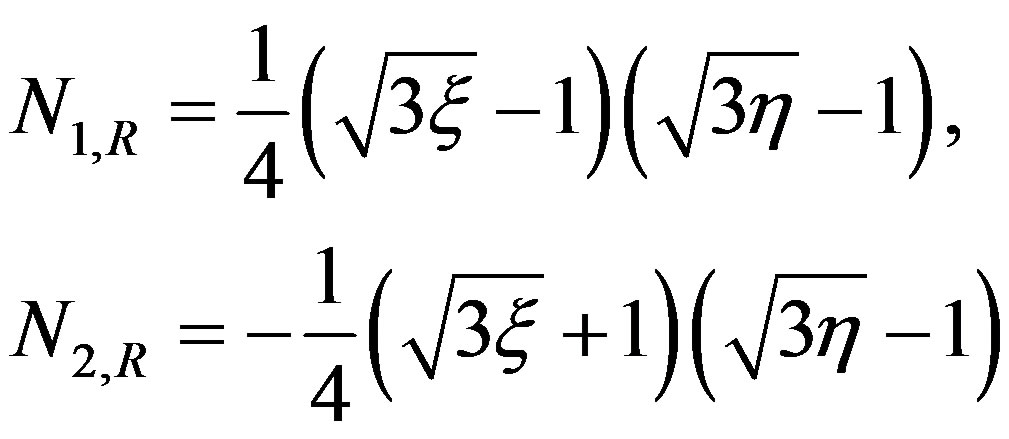
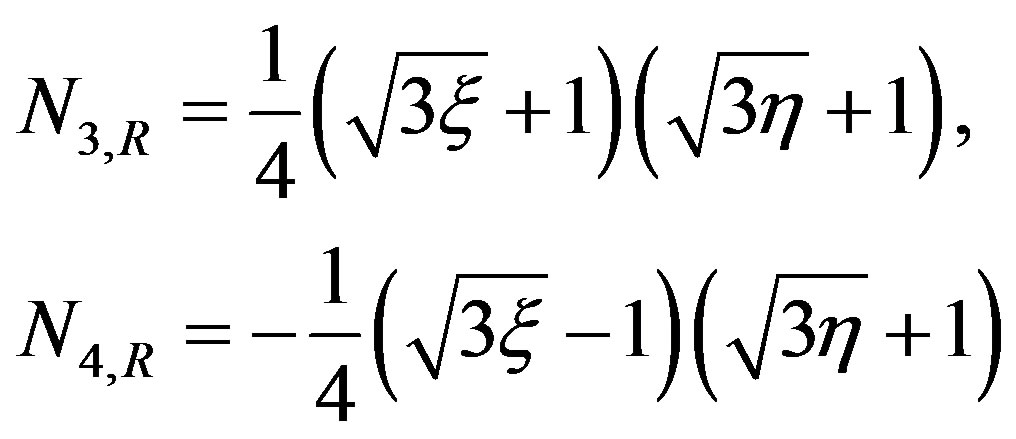
And the shape functions Nr,R given as;
3.3. Numerical Results of the Laminate Theory
The stress distribution results within laminate based on the above theory can be seen in Figure 7, while stress distribution within the stitch can be seen in Figure 8.
The Tsai-Hill failure criterion, an interactive maximum stress criterion, can be applied to the above results to determine which ply failed first. The Tsai-Hill failure criterion predicts failure when any one of the ultimate (yield) strength values exceeds the corresponding allowable stresses in a principal axes direction. Thus, to ensure a safe design, the following inequalities must be satisfied in both tension and compression.
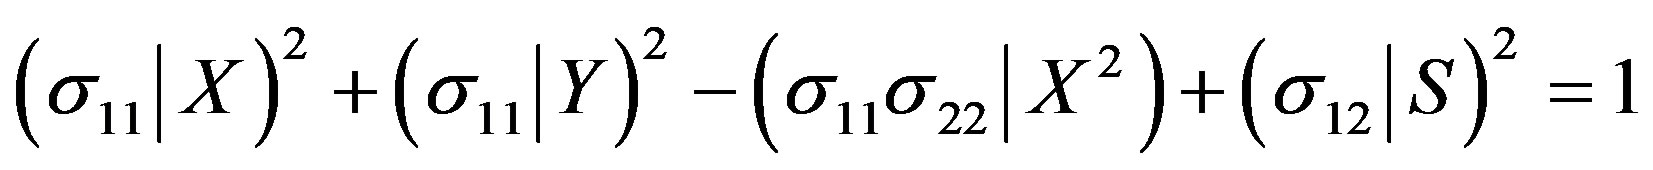
where the quantities X and Y are the tensile and compressive yield strengths of the material, respectively, and S is the corresponding shear strength. We may then draw the conclusion that the first failure occurred in Ply 2, the second failure in Ply 7, and the third failure in Ply 8. Therefore, the FBG was placed between Ply 8 and Ply 9 to acquire as much spectrum data as possible before the total failure of the specimen.
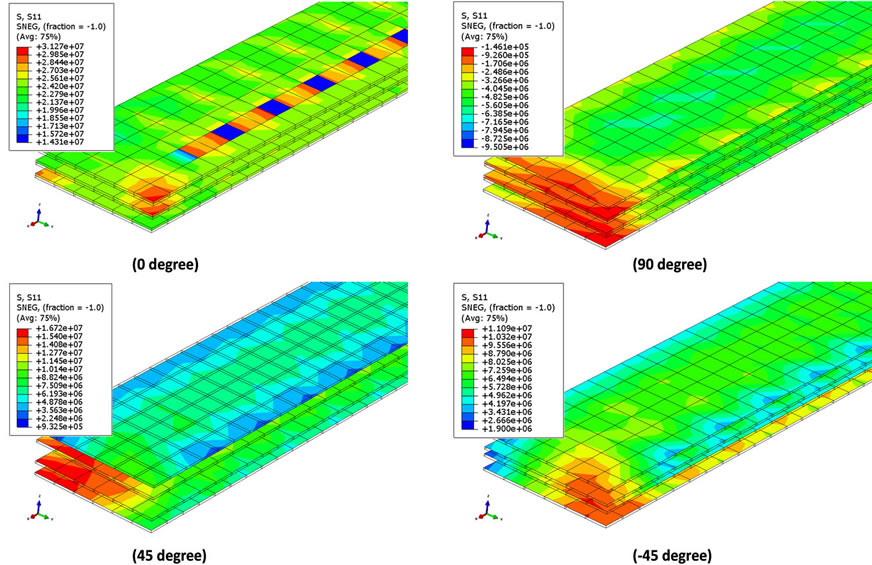
Figure 7. Off-axis stress distribution within stitch laminate.
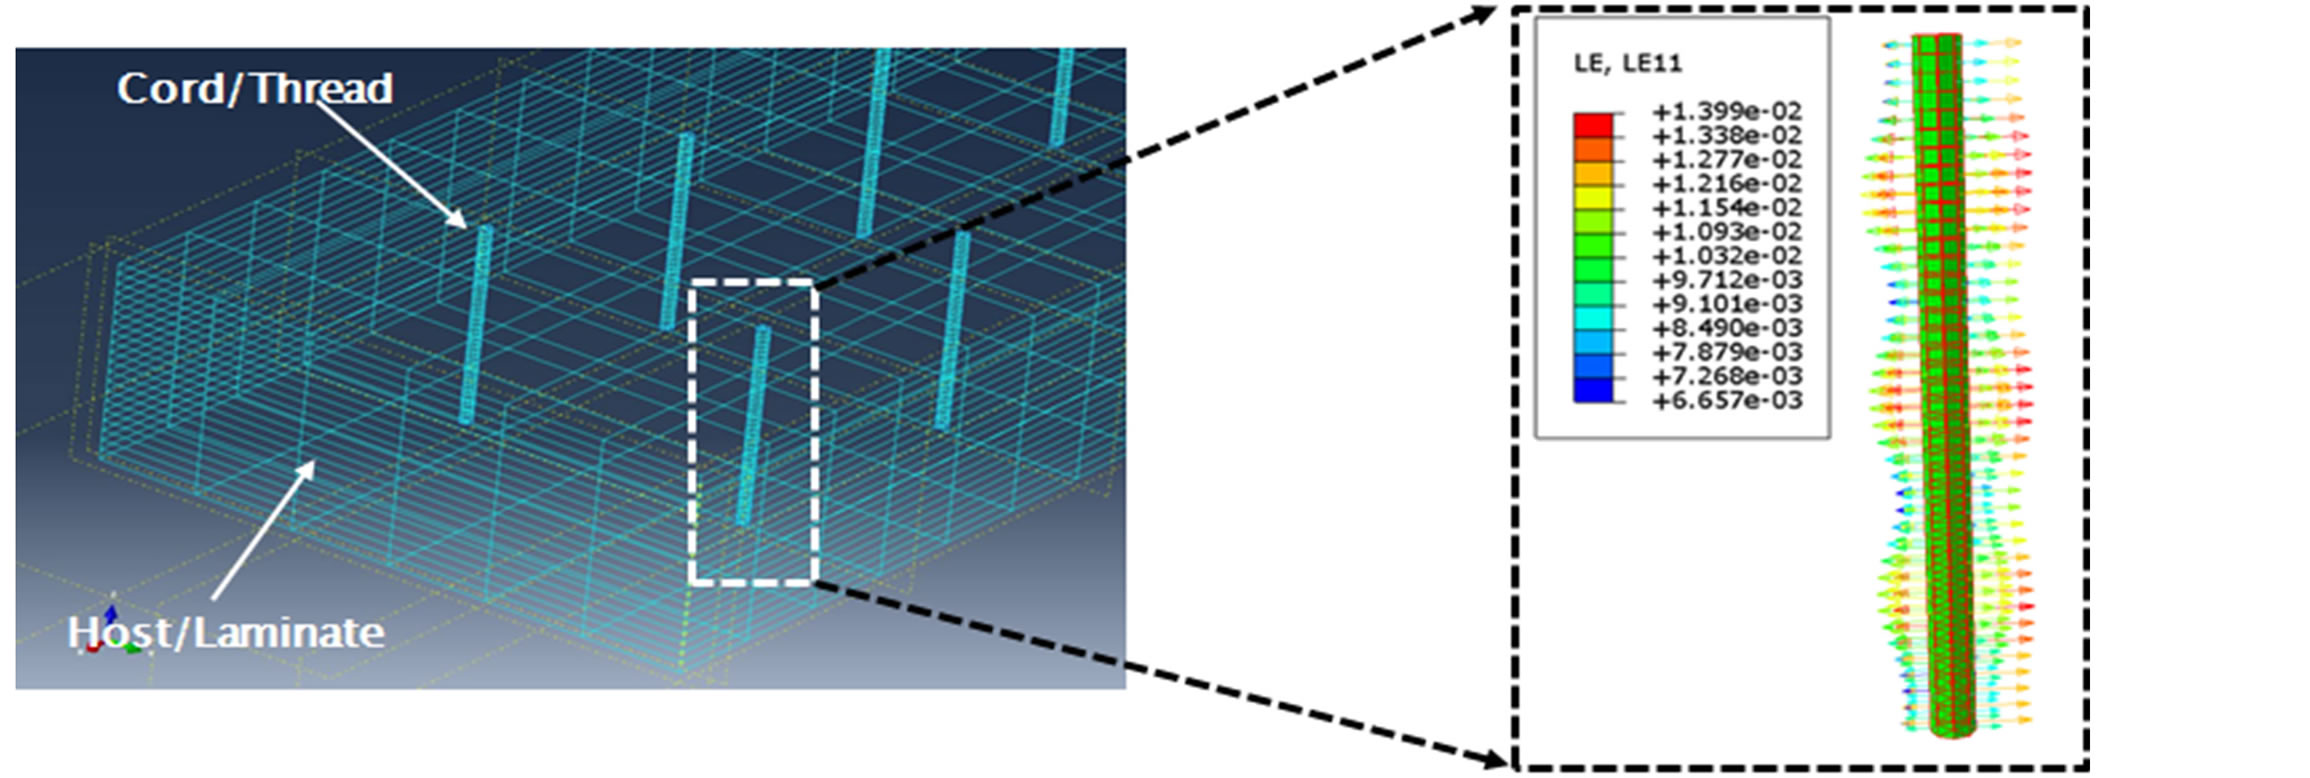
Figure 8. Stress distribution within stitch laminate.
4. Empirical Approach in the Static Case
Experimental Procedure
Before conducting the test, the specimen was fabricated with the configuration shown in Figure 9. The FBG was placed between Ply 8 (90˚) and Ply 9 (45˚) for reasons explained with the numerical scenario in the previous chapter. The position of the FBG in the micro-structure can seen in Figure 10. During the static test, the FBG optical fiber was lit with a broadband light source (ASE FL7002, 1530 - 1610 nm, Fiber Labs) using a Fujikara arc splicer fiber optic weld-join device. The power spectrum was measured from the reflected light in the FBG sensor, which was embedded inside the stitch laminate. The losses after the fiber optic joining were 0.00 dB, indicating a perfect joining result, as shown in Figure 11. The spectrum reflection was measured using an optical spectrum analyzer (MS9710C, Anritsu Co.). The interrupt load test was also performed to gather data for comparison with non-destructive inspections that used a Cscan to determine the degree of damage. The interrupt test was used to simulate real conditions such that the loading-unloading conditions represented operatinggrounded conditions. This type of test can also determine the effects of changes in the load distribution and stress concentration during loading.
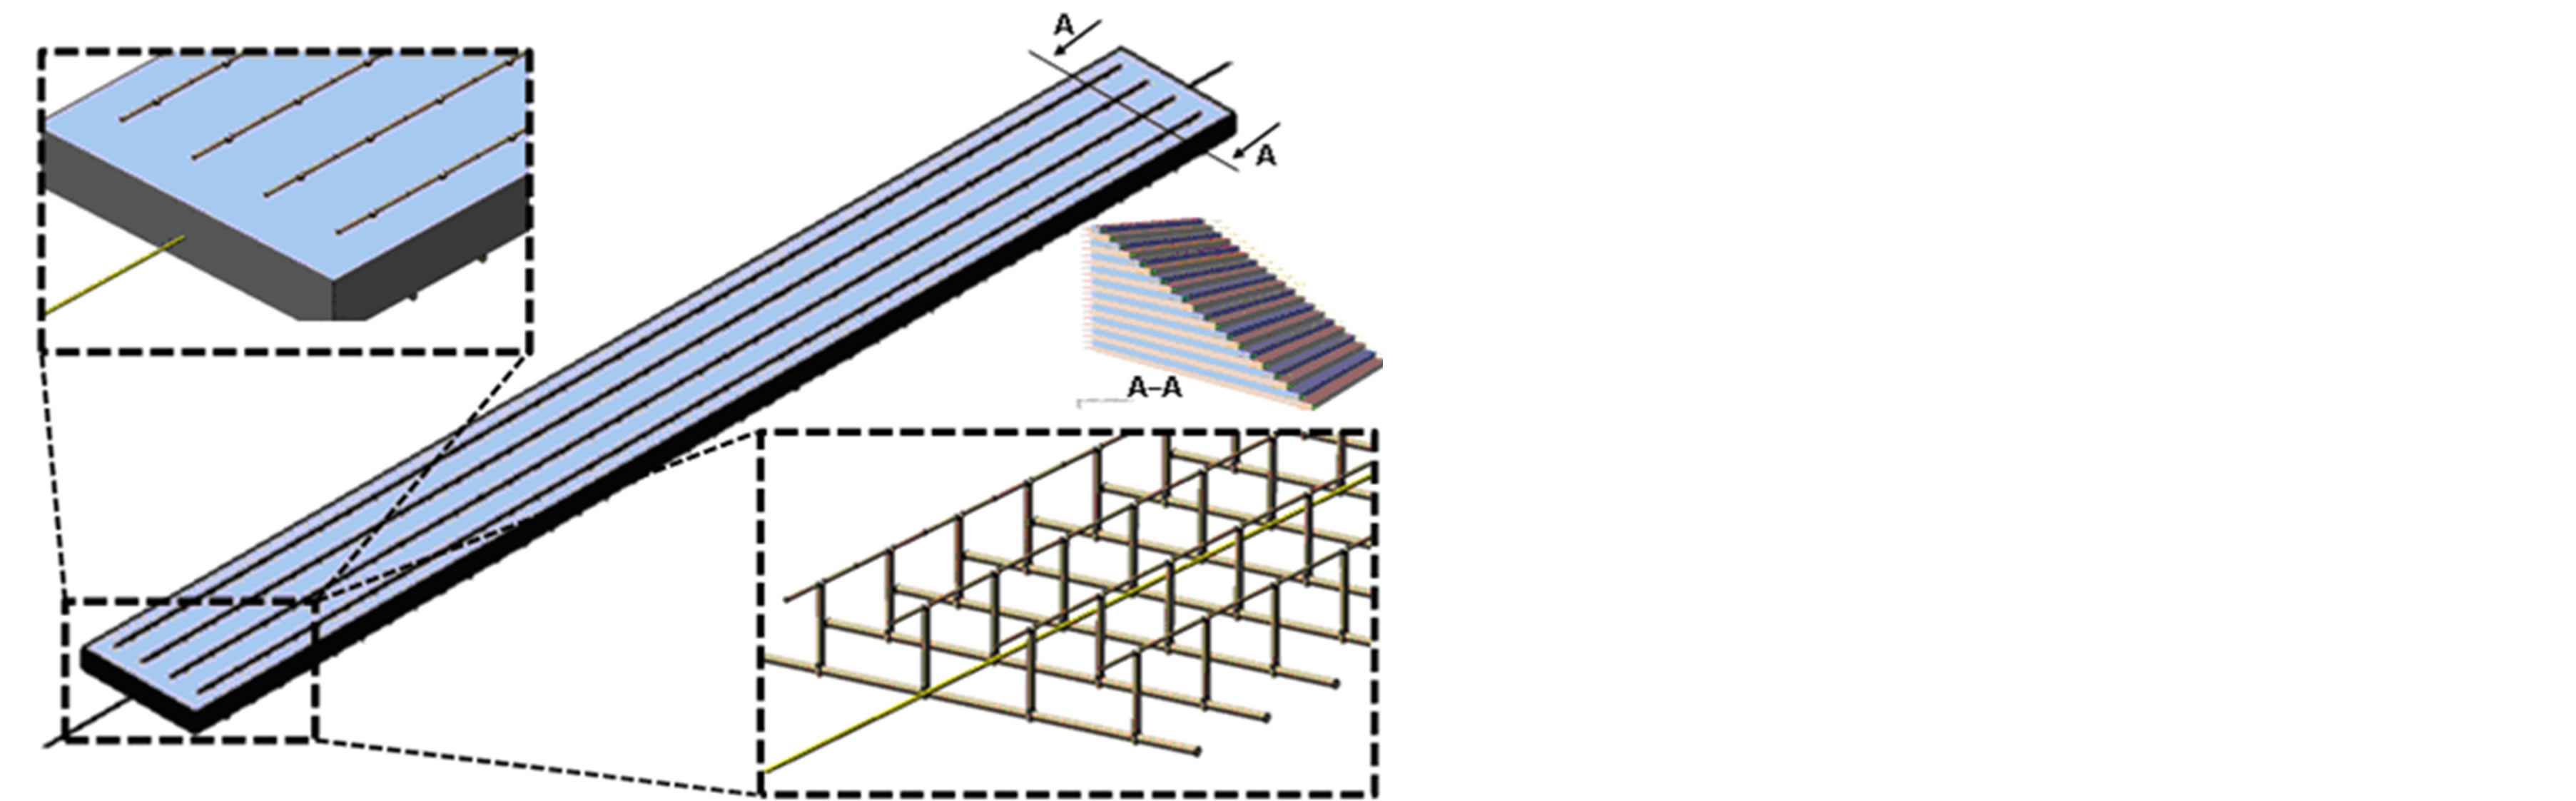
Figure 9. Specimen configuration.
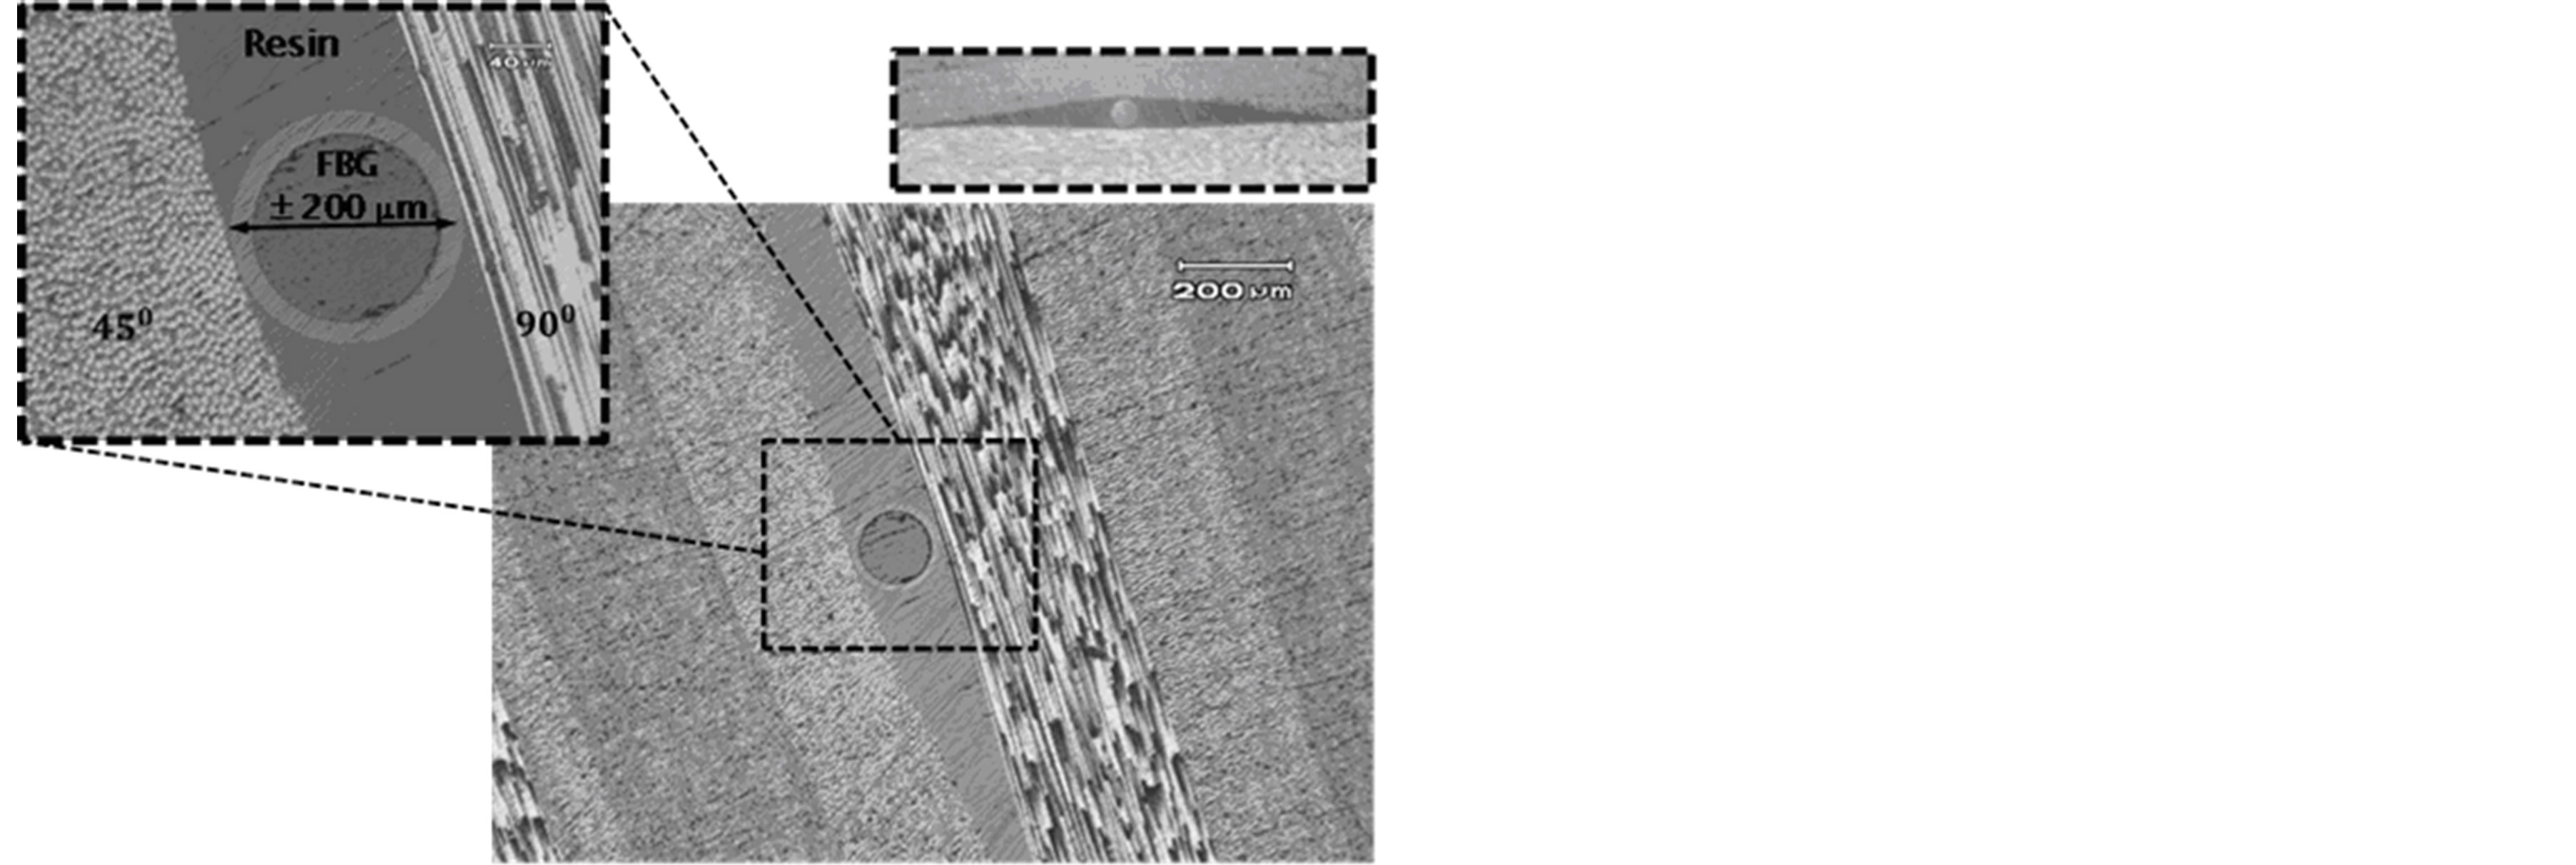
Figure 10. The micro-structure of the specimen model.
Figure 12 presents the experimental arrangements. The tensile test was conducted using a universal testing machine (Instron 8802). The crosshead speed was 1 mm/min for the FBG and AE test profiling, up until the specimen experienced total failure; the crosshead speed on the interrupt load test was 0.5 mm/min to acquire more data. The span length of the tensile test was 160 mm. A non-contact strain sensor, an advanced video extensometer (AVE), was used to monitor the axial strain behavior on the stitch laminate specimen to clarify the accuracy of the universal testing machine. The spectrum reflection was continuously measured until the specimen broke. After that point, an interrupted test at a certain load interval was conducted to observe the damage growth with FBG interrogation under loaded and unloaded conditions. The specific load for the interrupted test was chosen based on the load-displacement curve and from the changes in the spectrum reflection, which indicated that damage had initialized. The loading-unloading condition
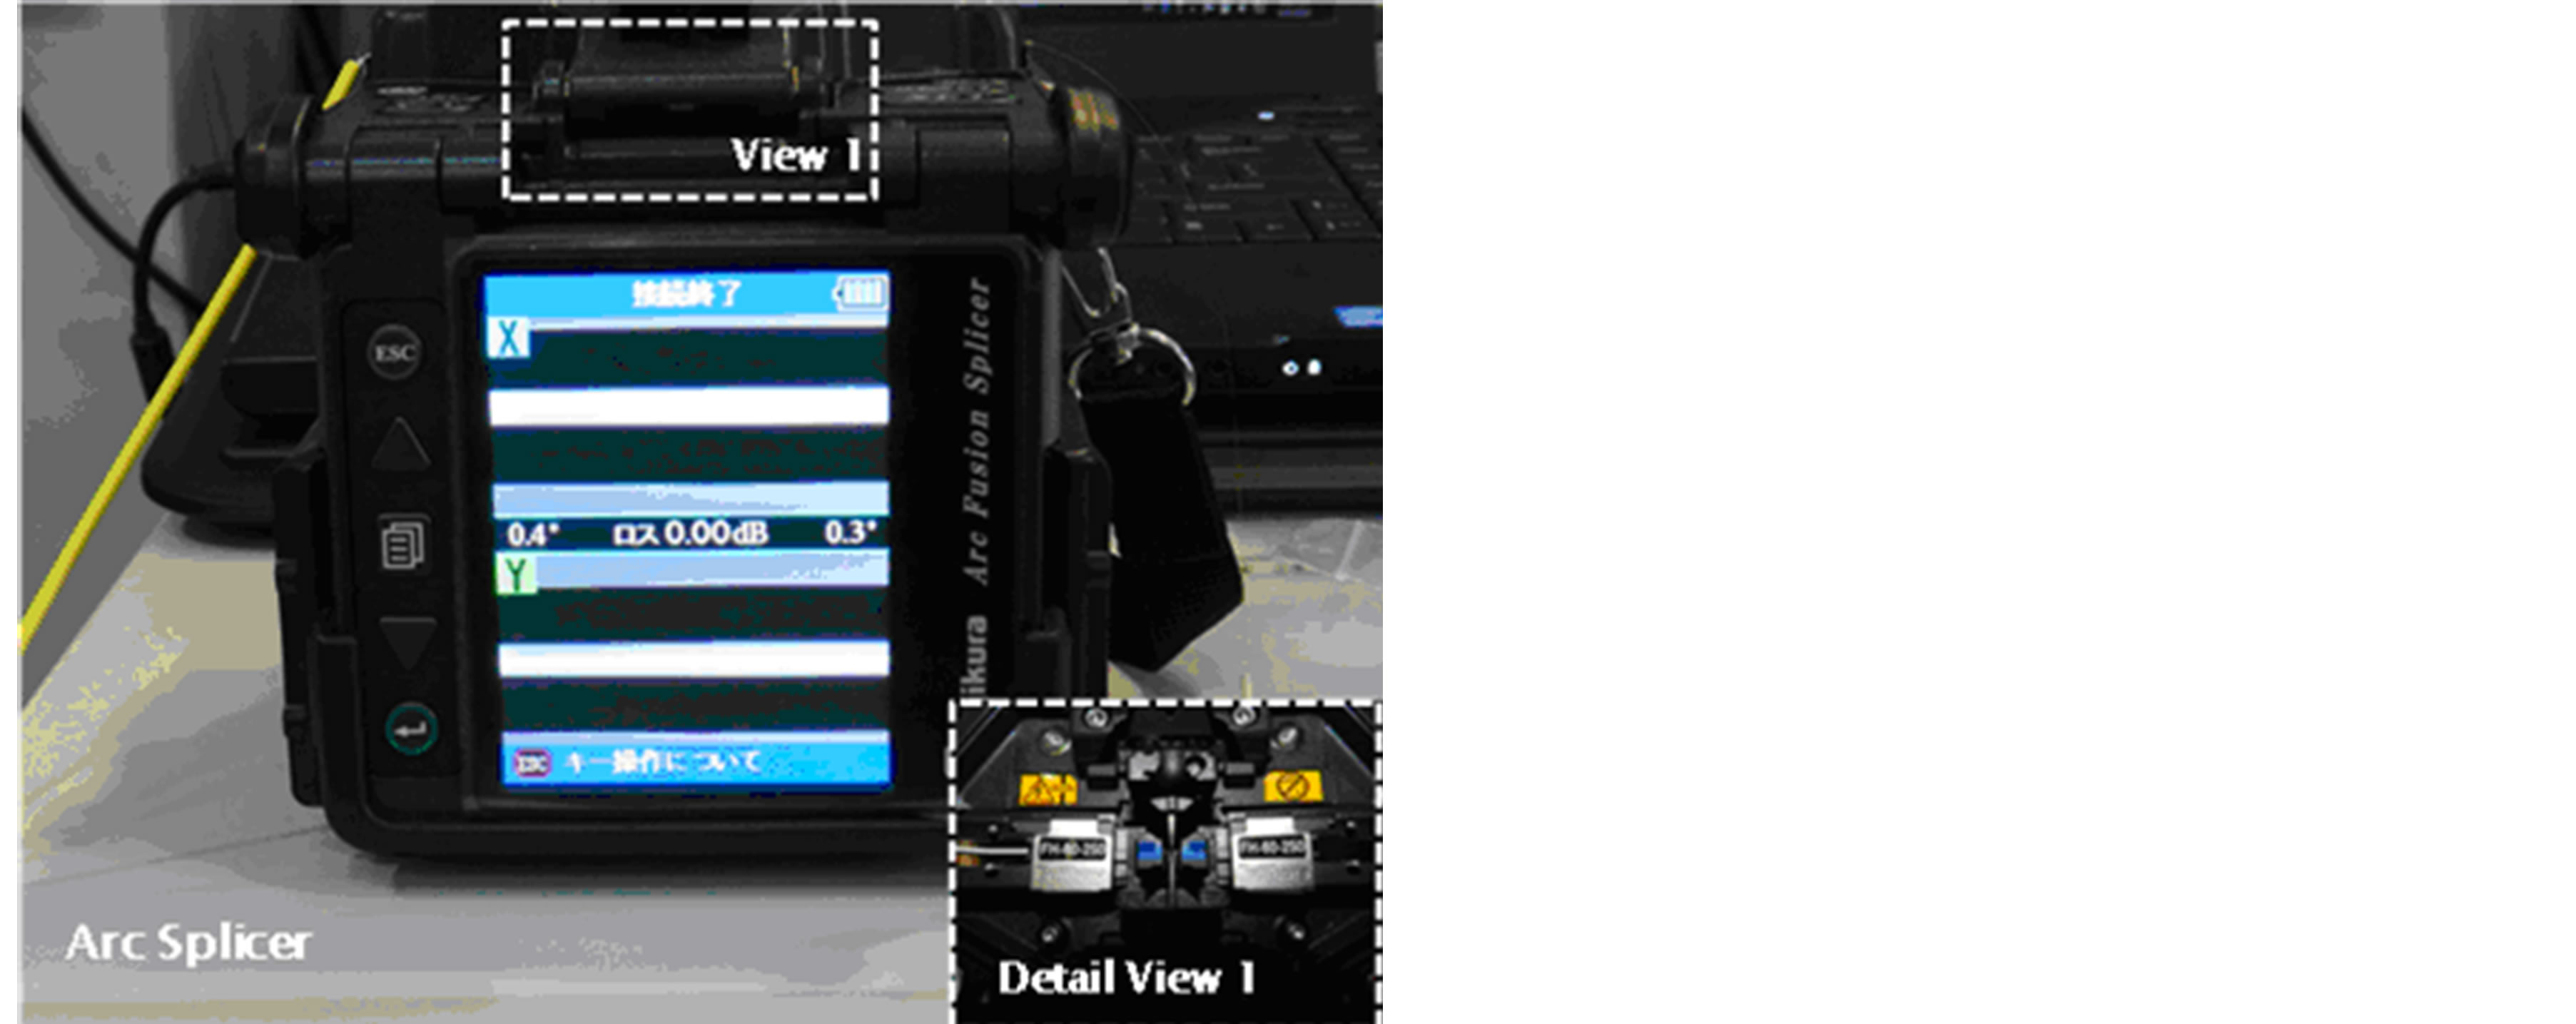
Figure 11. FBG connection setup and light bias test.
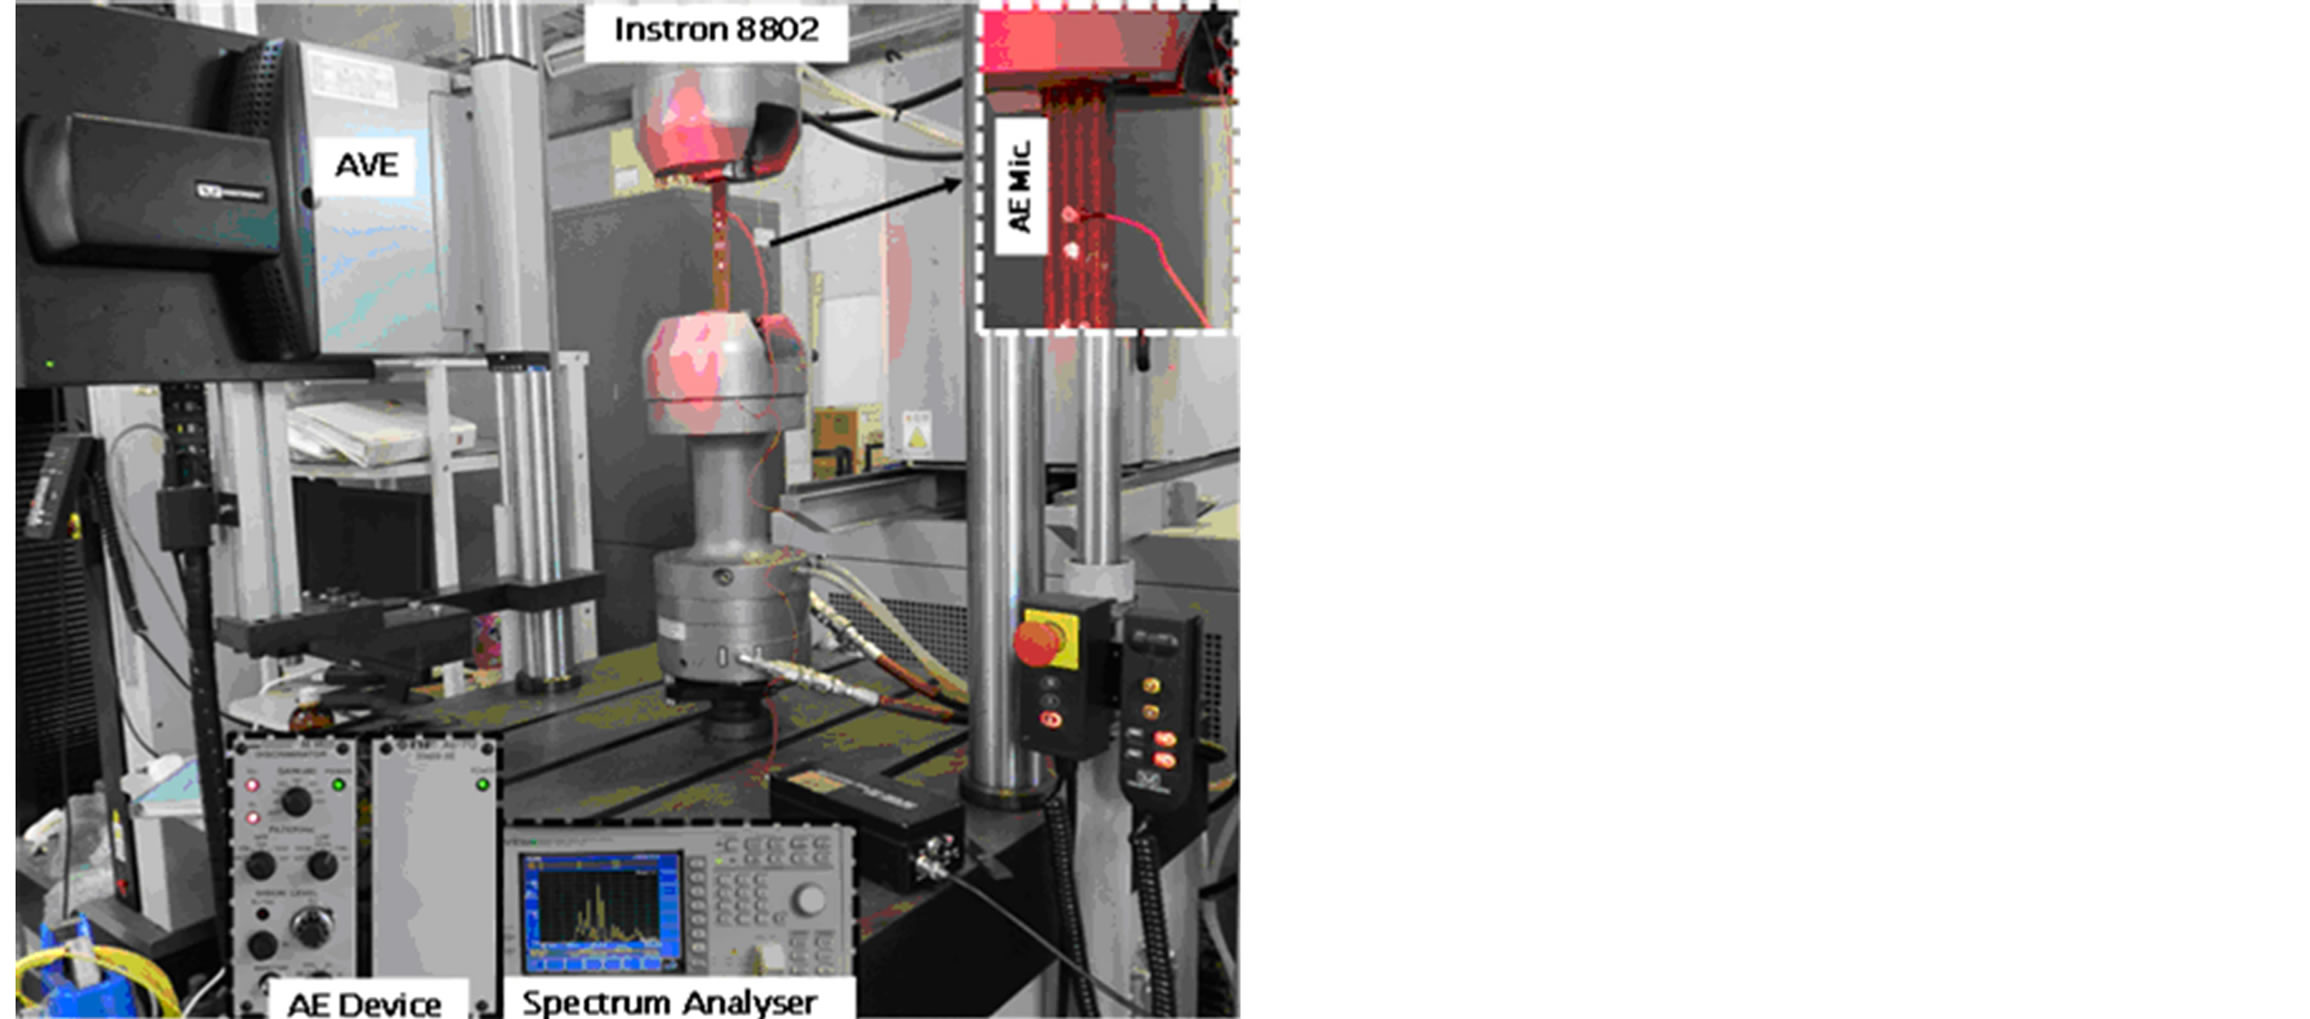
Figure 12. Tensile, AE, and spectrum analyzer test setups.
was used to represent real conditions when the damage occurs in aircraft structures. The evolution of the shape of the reflected spectrum was observed using a spectrum analyzer, and damage was observed using an ultrasonic c-scan (Gsonic scan 6A × 600).
Figure 13 shows the spectrum pattern from the FBG reading. The figures, reading from left to right, are as follows: the FBG spectrum in the original signal, the spectrum without the FBG, the evolution of the FBG spectrum when damage occurred, and the evolution of the spectrum when almost all the grating periods of the FBG are broken. When the last case occurs, the spectrum pattern converges to a spectrum pattern without the FBG.
Figure14 shows the load versus strain combined with the hit versus strain. A hit is a result of a transient energy wave generated by damage growth inside the stitch laminate specimen in the acoustic emission test. Certain load positions that were chosen as the interrupt load based on significant spikes and multi-peaks in the power spectrum occurred, and Figure 15 indicates that the energy versus load graph and the hit versus load graph have the same trends and almost the same values. Thus, the AE test shows that determining if a value calculated from the energy wave generated by the damage growth and spectrum hit a prescribed threshold was correct.
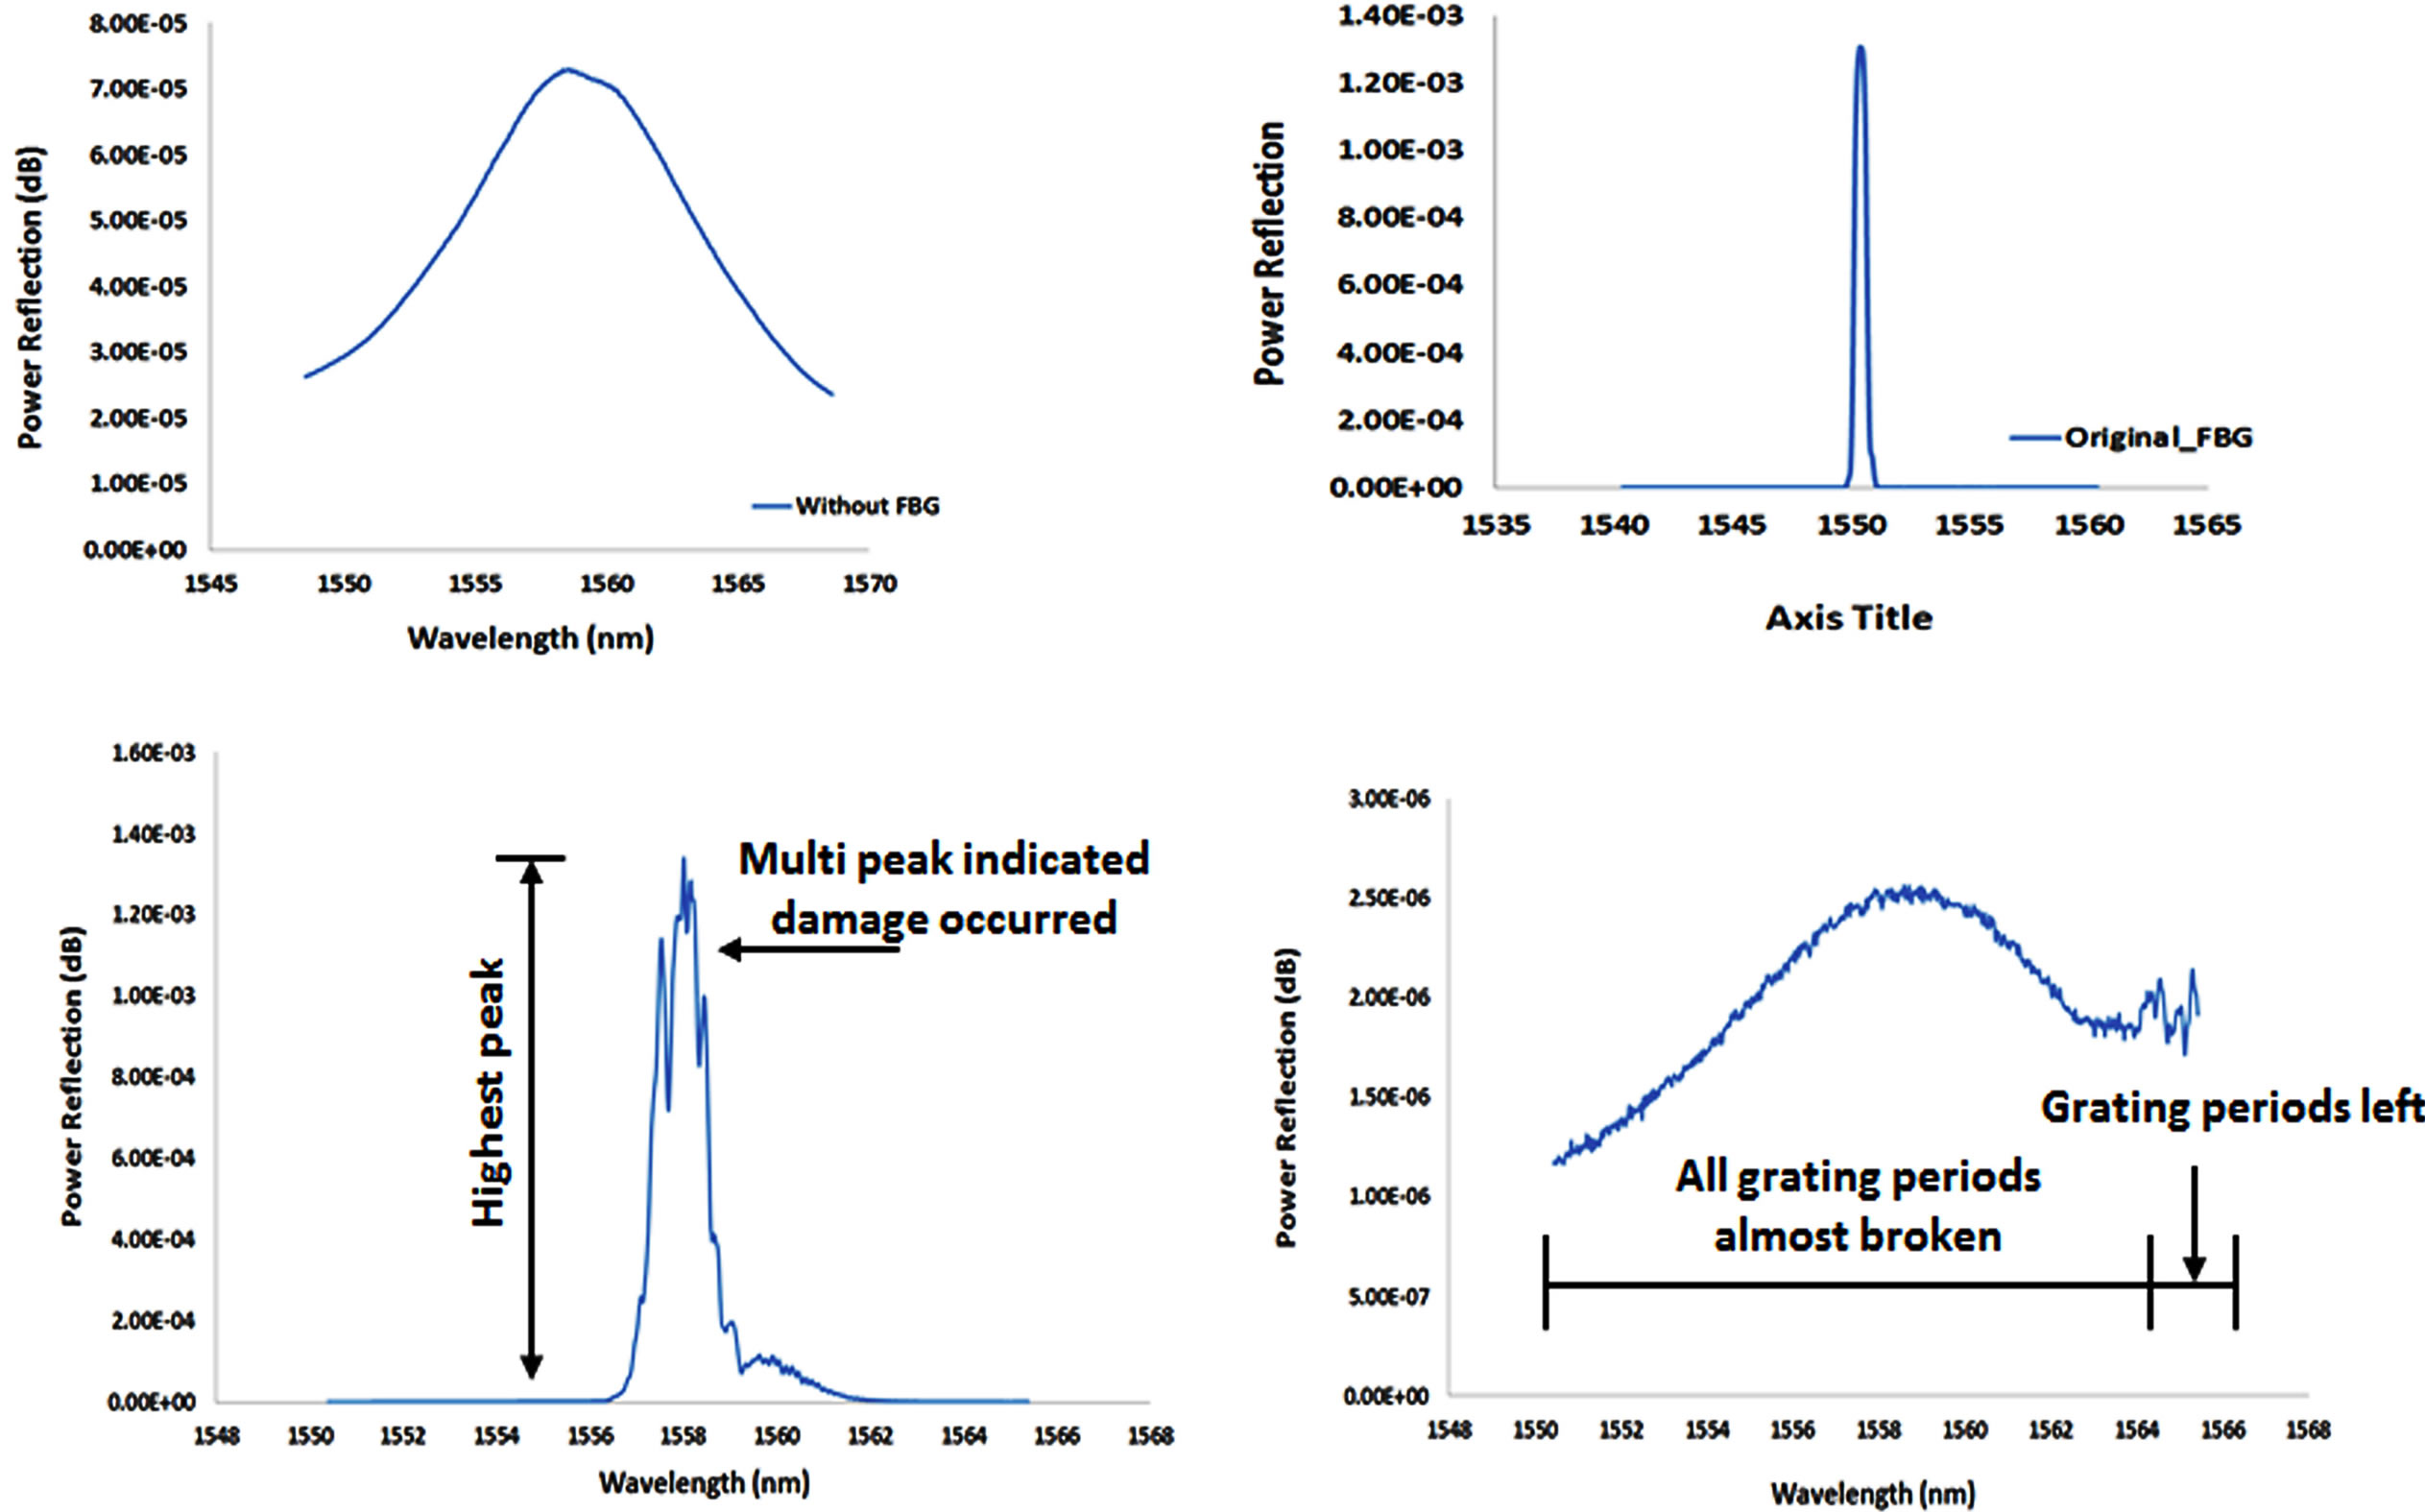
Figure 13. Spectrum of the FBG character.

Figure 14. Mechanical behavior versus the AE behavior of the stitch laminate.
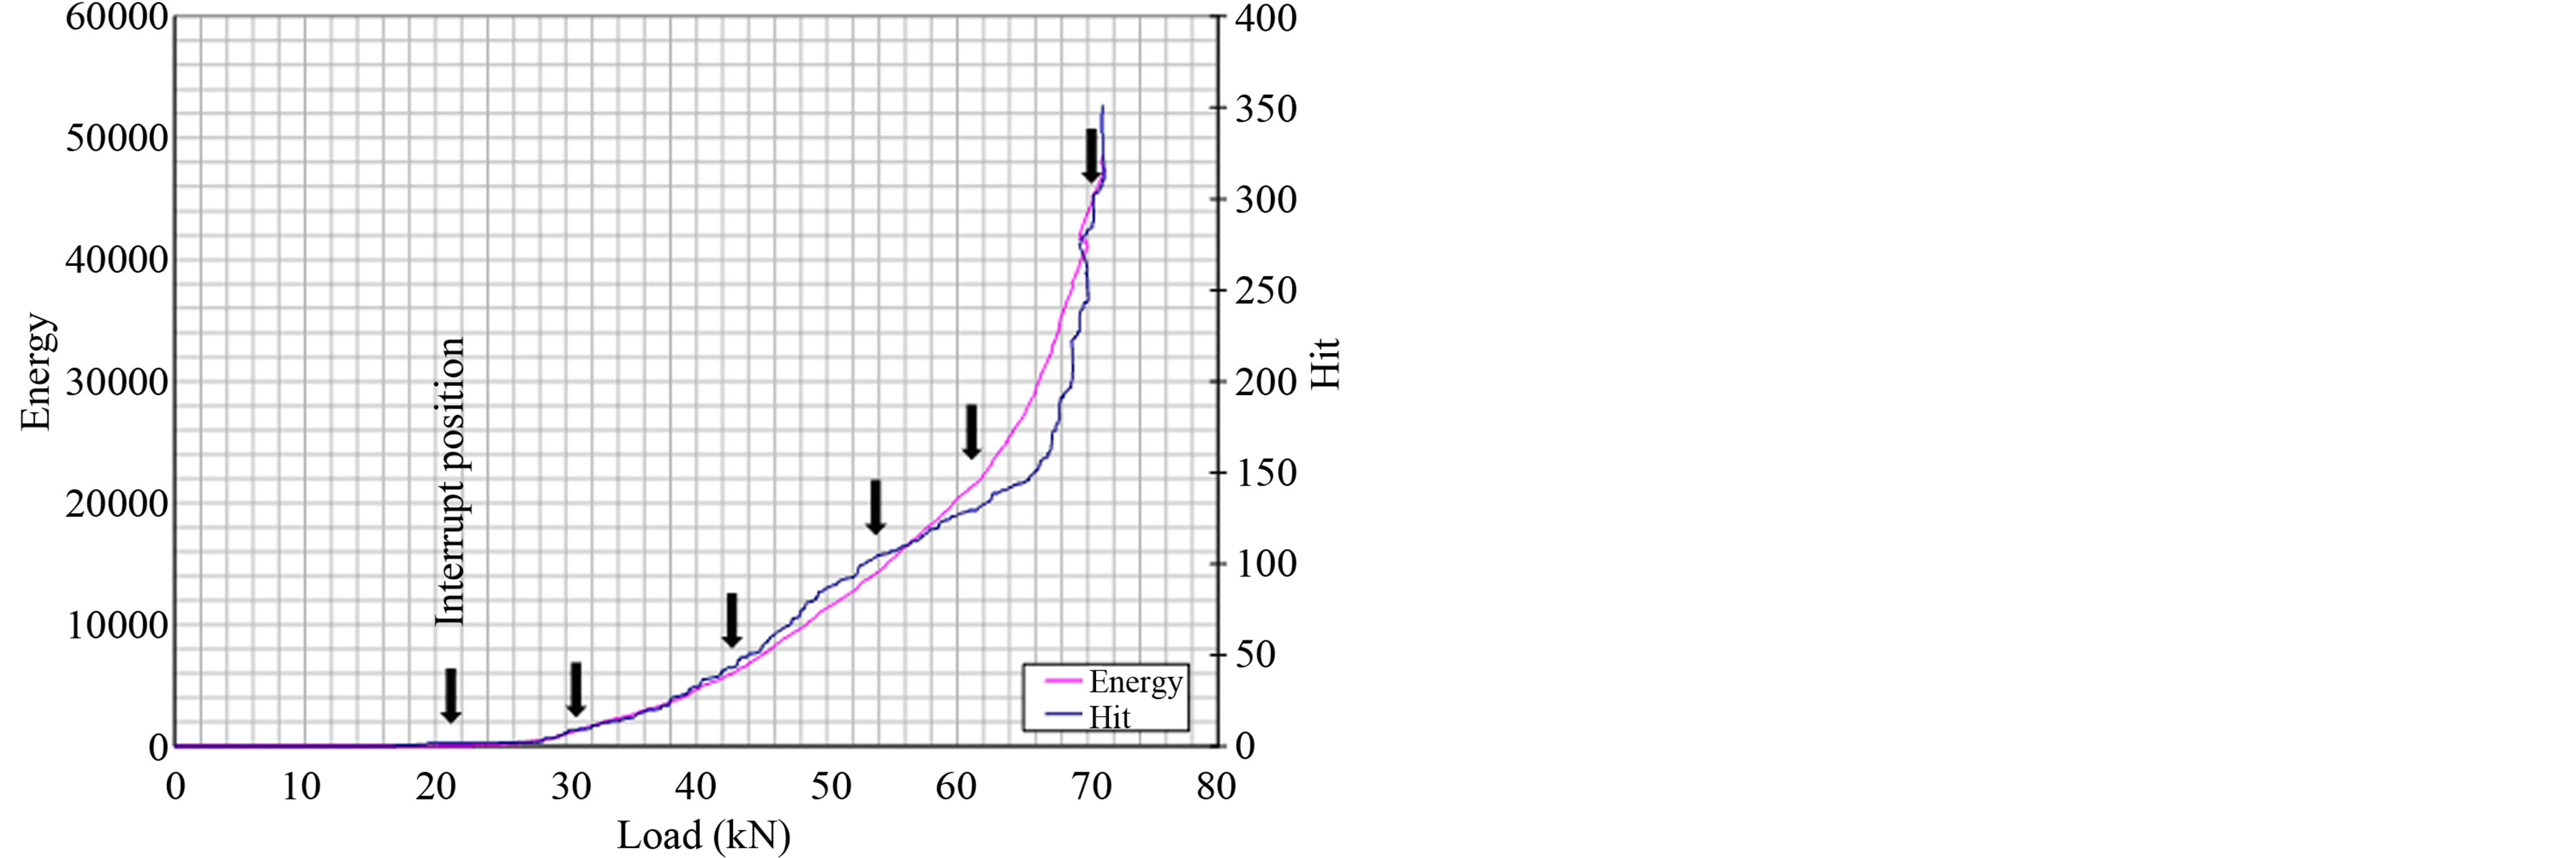
Figure 15. AE test result.
Figure 16 shows the spectrum pattern evolution during the load run from the FBG reading in a tensile test up to the breakage of the specimen. The occurrence of multi-peaks or patterns that differ from the original indicate the occurrence of damage. The spectrum evolution has a constant pattern, especially in the power reflection value. The value has a tendency to decrease gradually until the failure of the stitch laminate specimen. We can take advantage of this pattern and use the highest peak in each spectrum as an indicator to make graphs and then determine the degradation of the strength of the material. We can then compare the result with a mechanical behavior graph. The above-mentioned pattern also consistently occurs in the interrupt load test, as shown in Figure 17. The un-loading spectrum data is shown in Figure 18. An example of interesting behavior is that the FBG broke at almost the same time as the stitch laminate specimen in unloading spectrum shape 6. In that spectrum, the spectrum pattern has the same shape as the spectrum without the FBG inside the fiber optic, indicating that the entire grating period was already broken.
Figure 19 shows the simplification of the spectrum
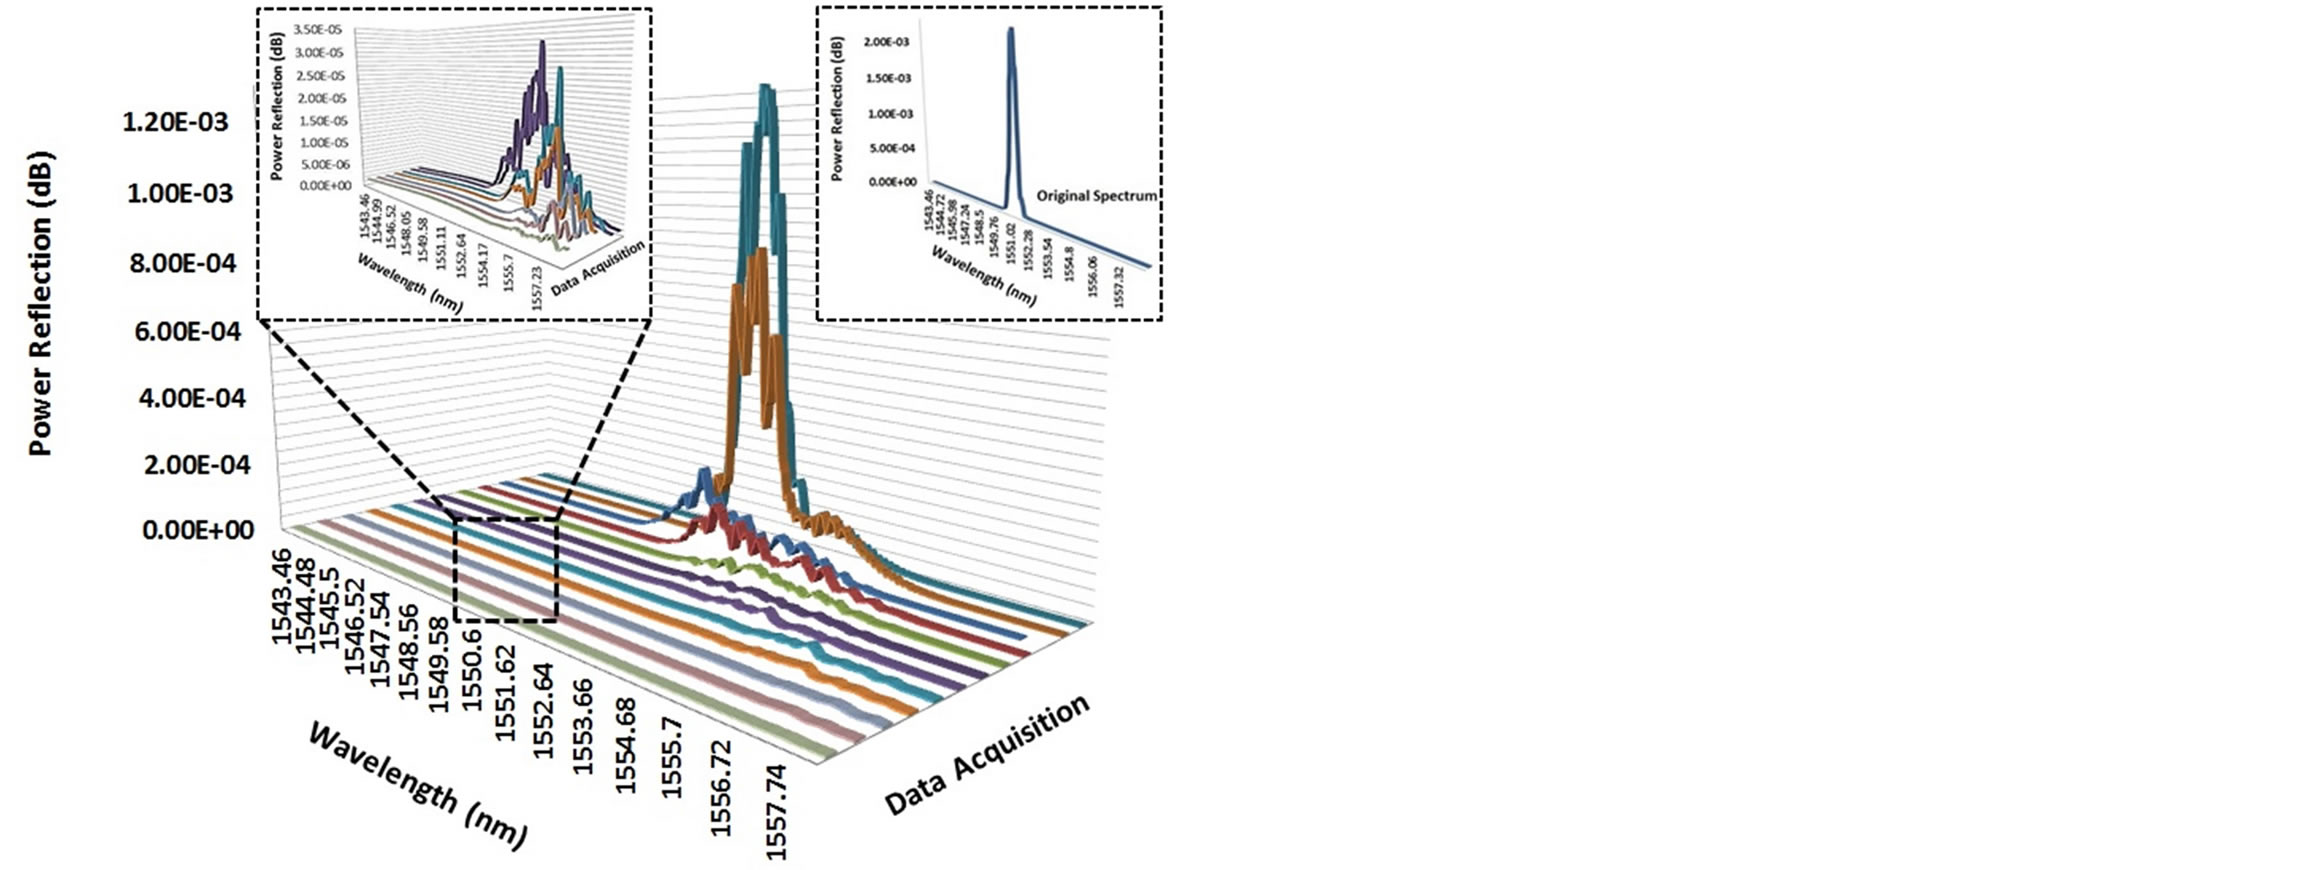
Figure 16. Spectrum evolution on profiling tensile test.
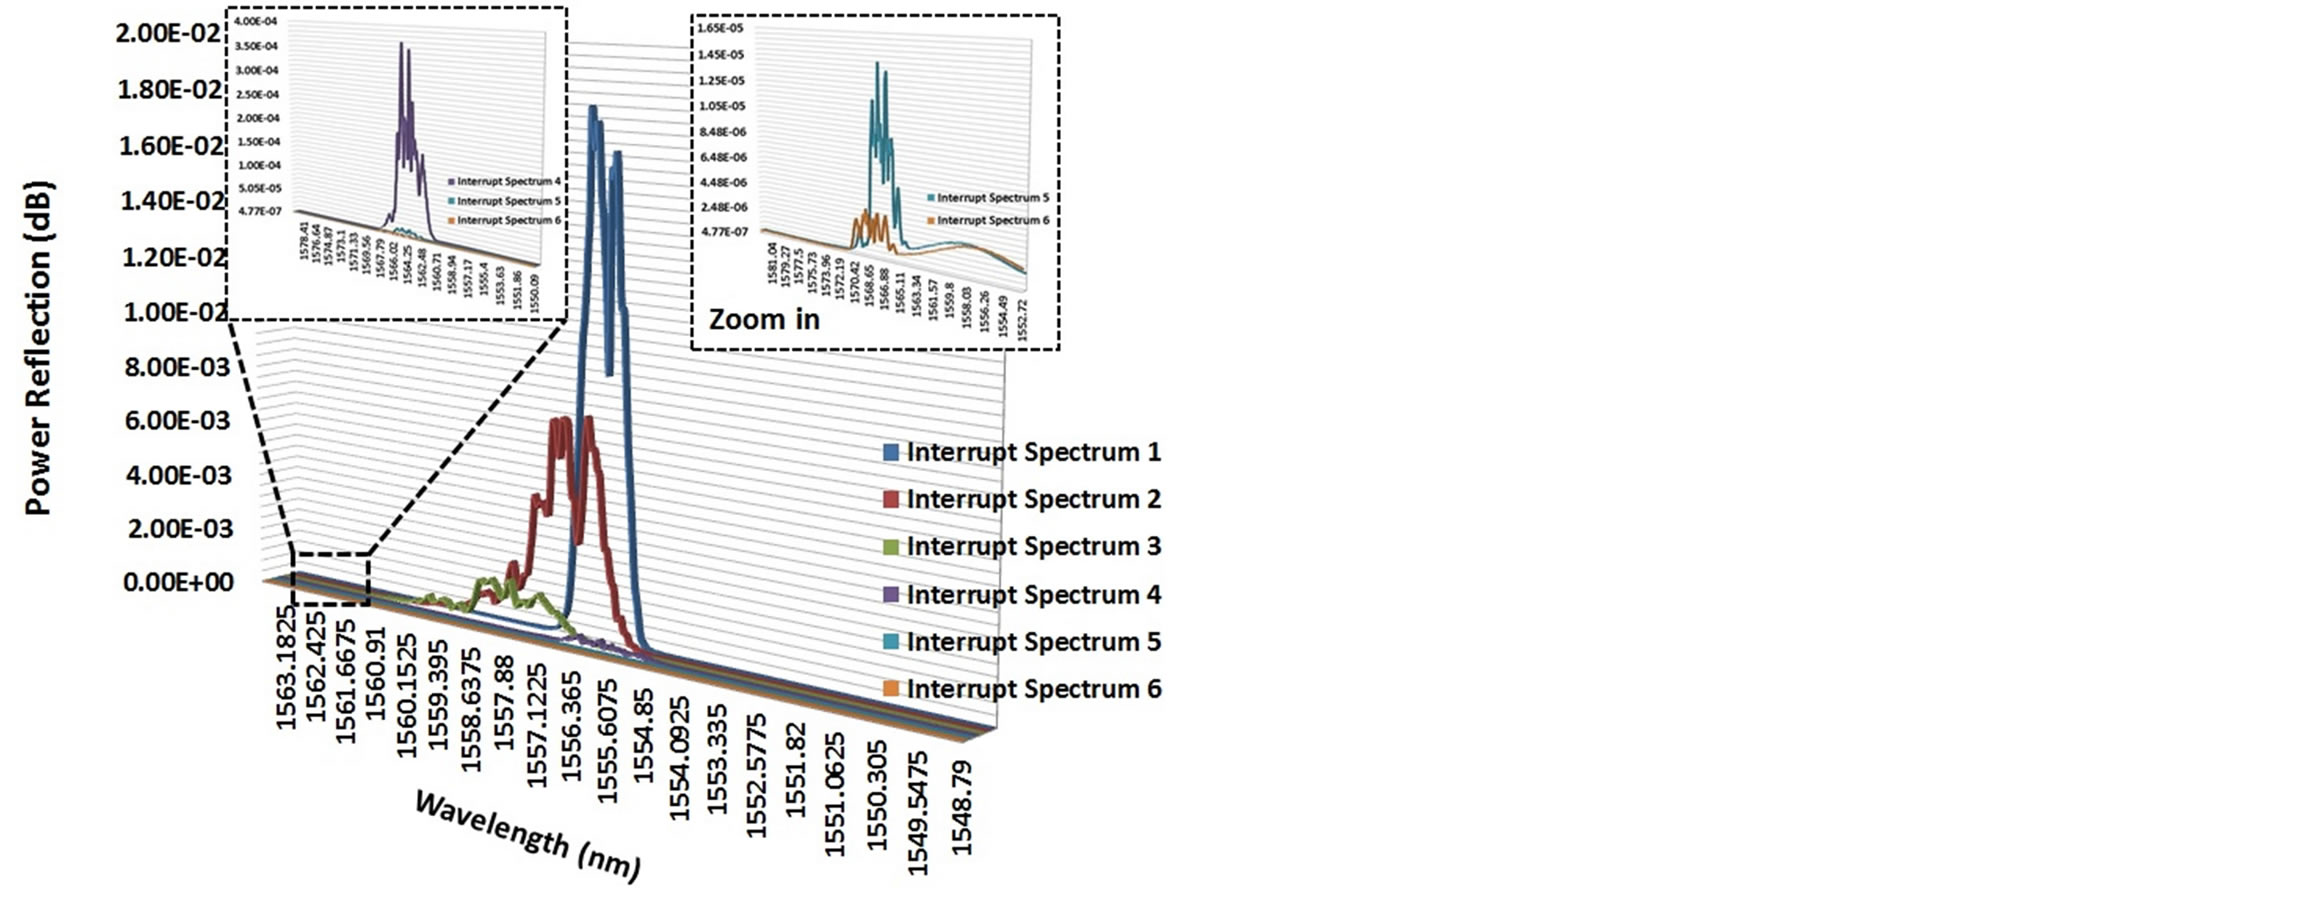
Figure 17. Spectrum evolution in the interrupt load test.
evolution during the profiling tensile test in graph form. The graph can be made by taking advantage of the consistency of the spectrum evolution during the test; it then depicts more clearly the decreasing tendency of the power spectrum based on the highest peak value during both the profiling data (until specimen failure) and the interrupt load test (small window in the graph).
Figure 20 plots the mechanical loading and the power
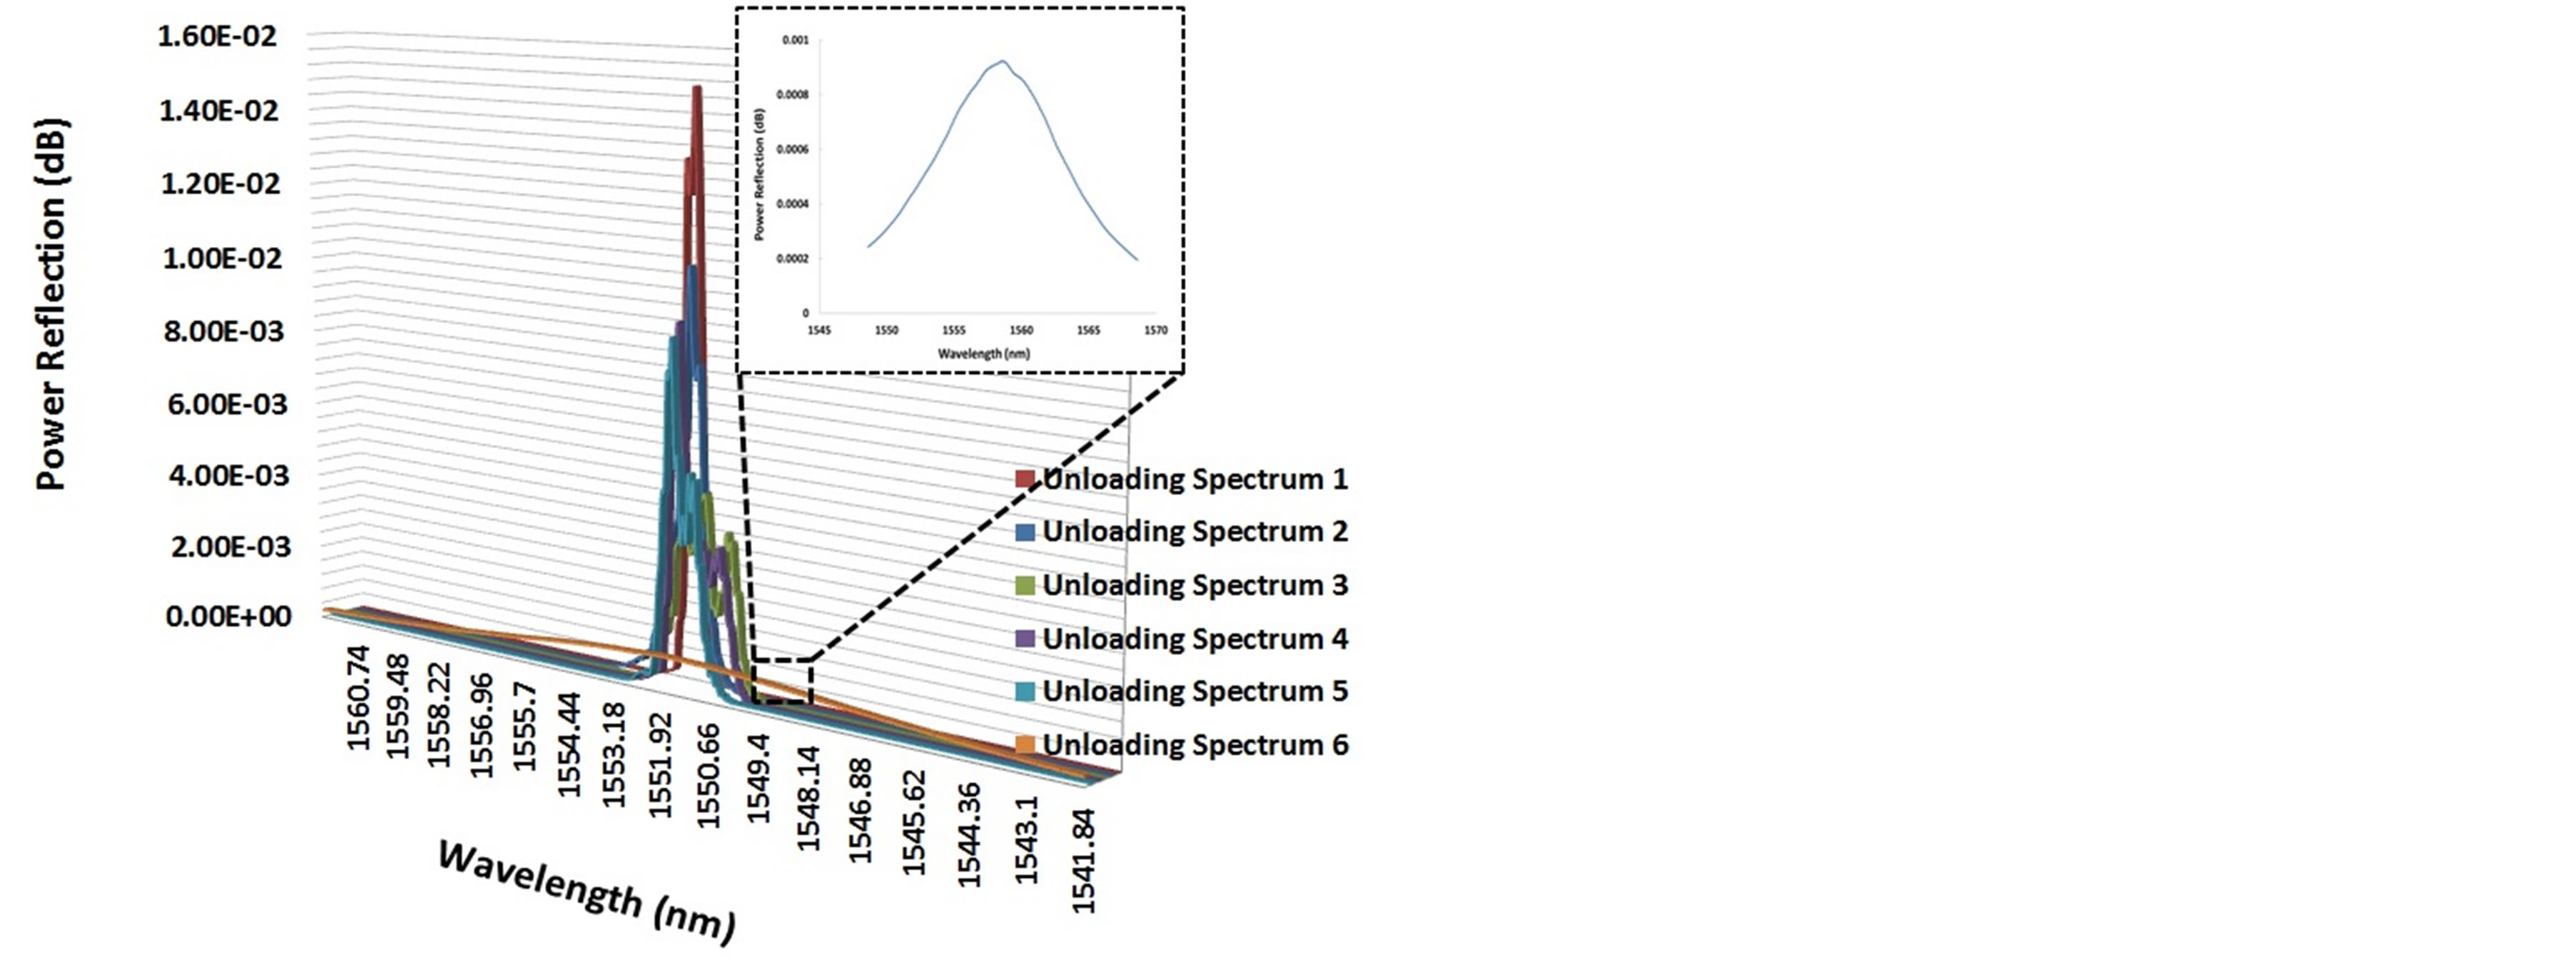
Figure 18. Spectrum evolution in the unloading data.
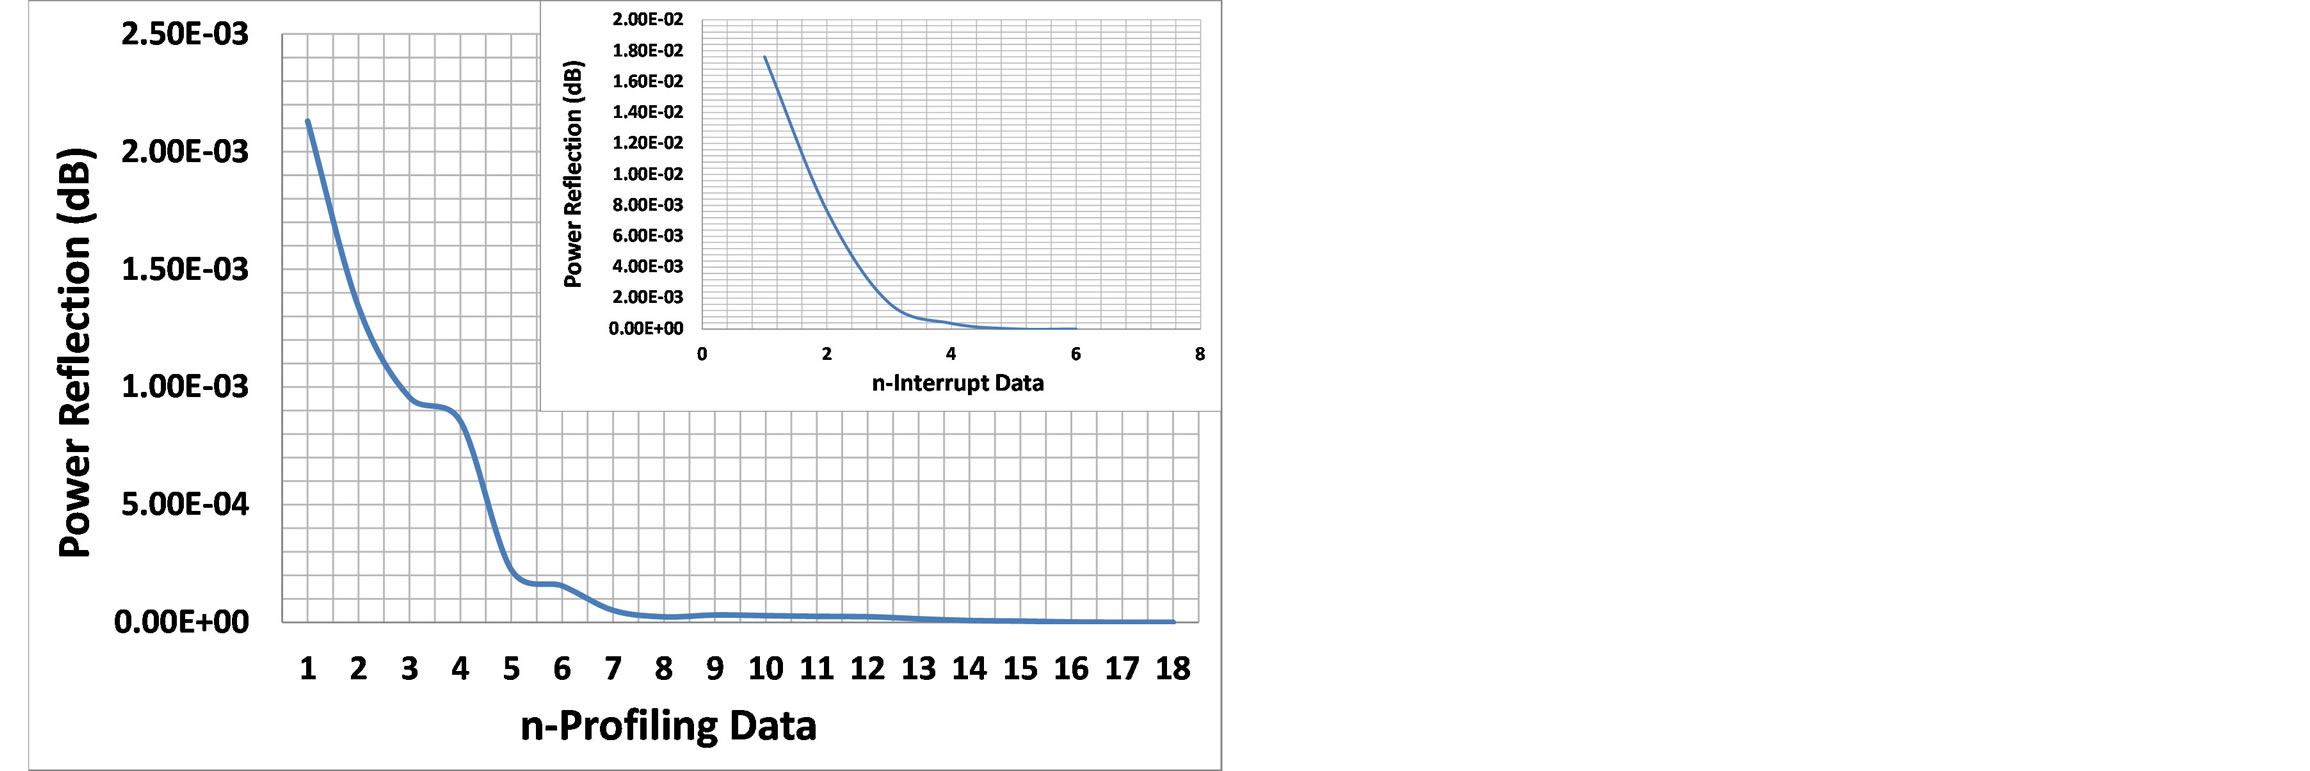
Figure 19. AE result in the profiling tensile test compared with the interrupt test.
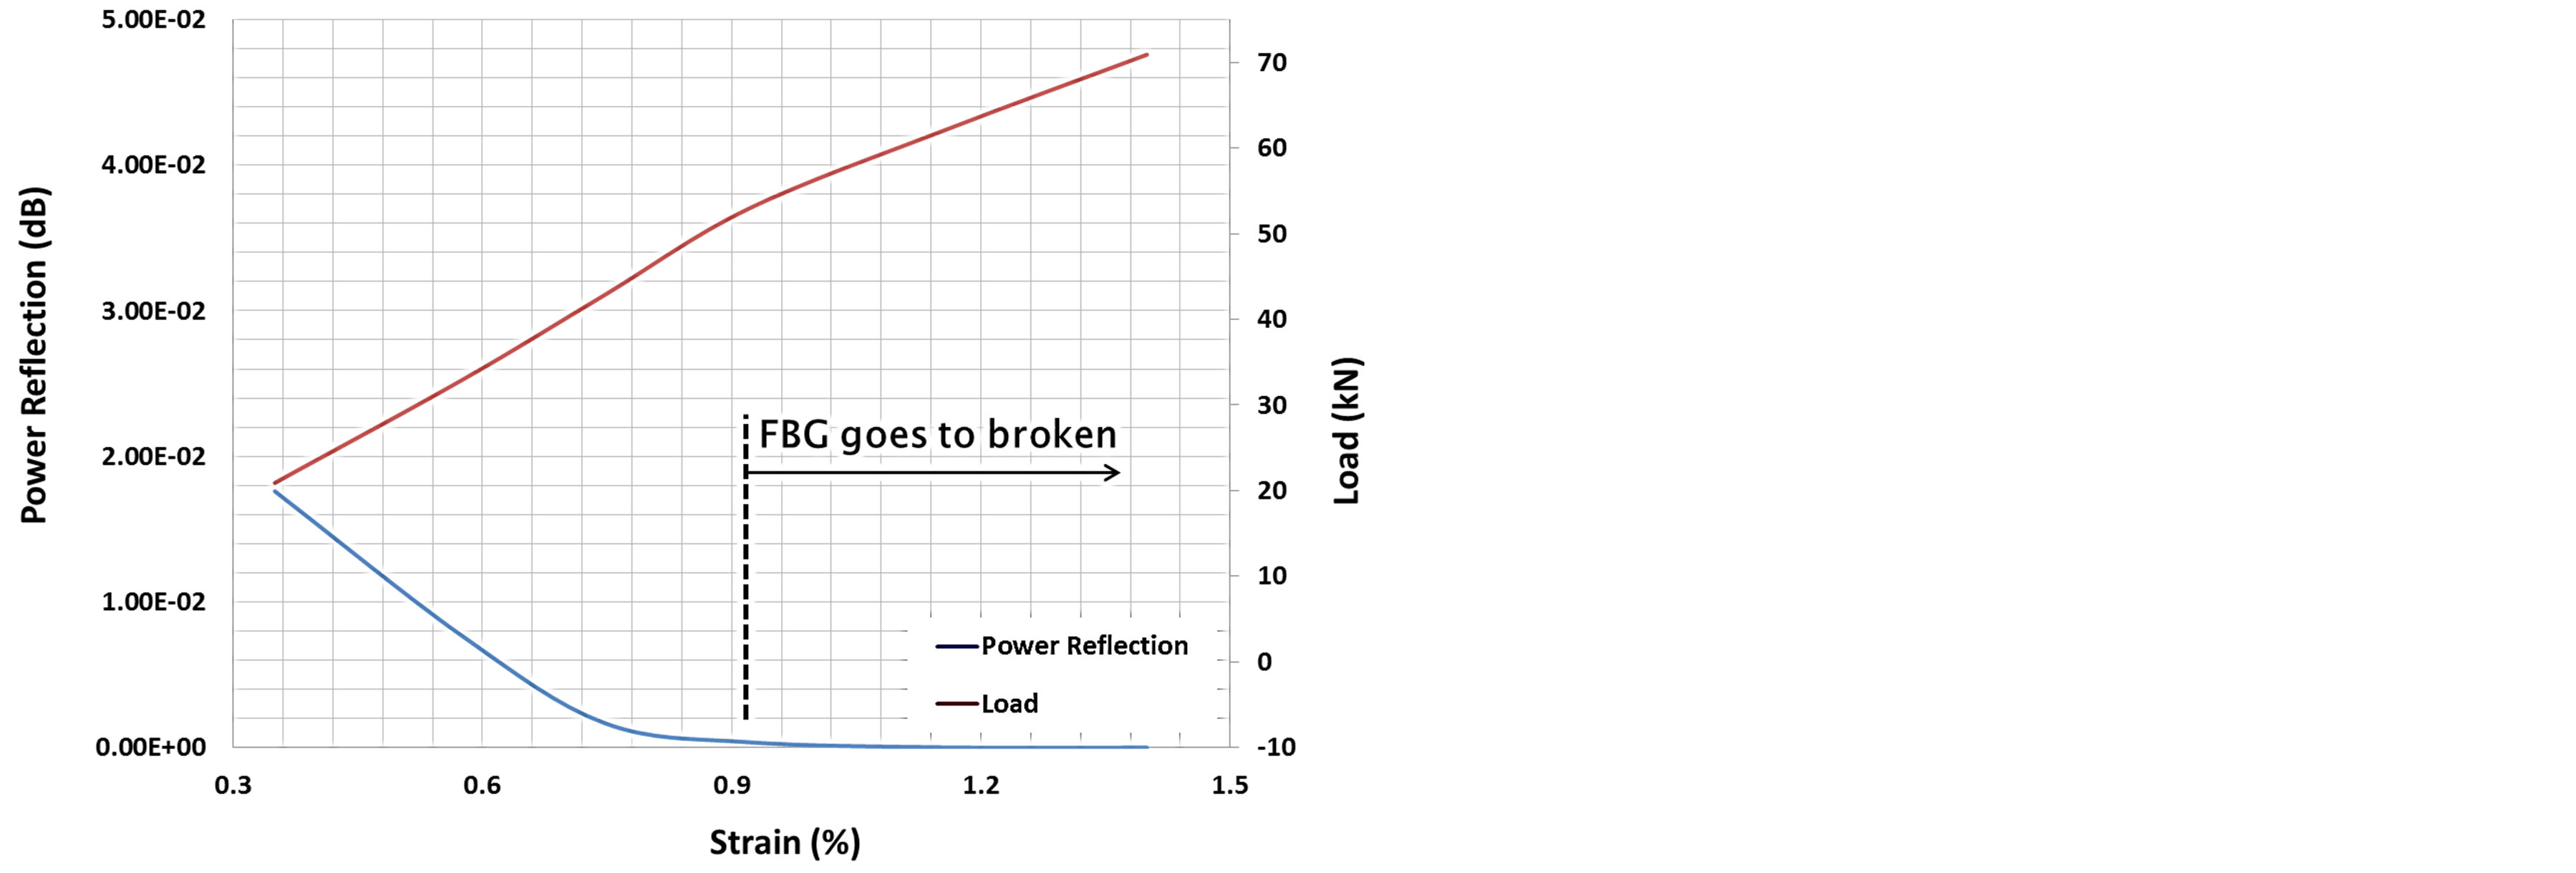
Figure 20. Power reflection of the FBG reading compared with the mechanical behavior.
spectrum versus the strain. After the strain in the stitch laminate reaches approximately 0.92%, the graph of the spectrum evolution behavior has a gently sloping line, indicating that the grating period of the FBG is almost broken due to severe damage inside the stitch laminate. On the other hand, the mechanical graph does not display the damage existence and growth, indicated by a straight lineup until the specimen fails completely.
Figures 21 and 22 show the comparative behavior between the FBG reading and the acoustic emission reading. Both graphs feature lines with significant slopes, which is caused by fast damage growth. However, based on the spectrum observed during the test, the spectrum of the FBG was easier to use as damage indicator because only one spectrum was needed to interpret the damage initiation and the growth. On the other hand, in the acoustic emission reading, there were so many transient energy waves generated by the occurring damage growth that a detailed analysis was to interpret the correlation between the energy wave occurrance with damage behavior inside the specimen model.
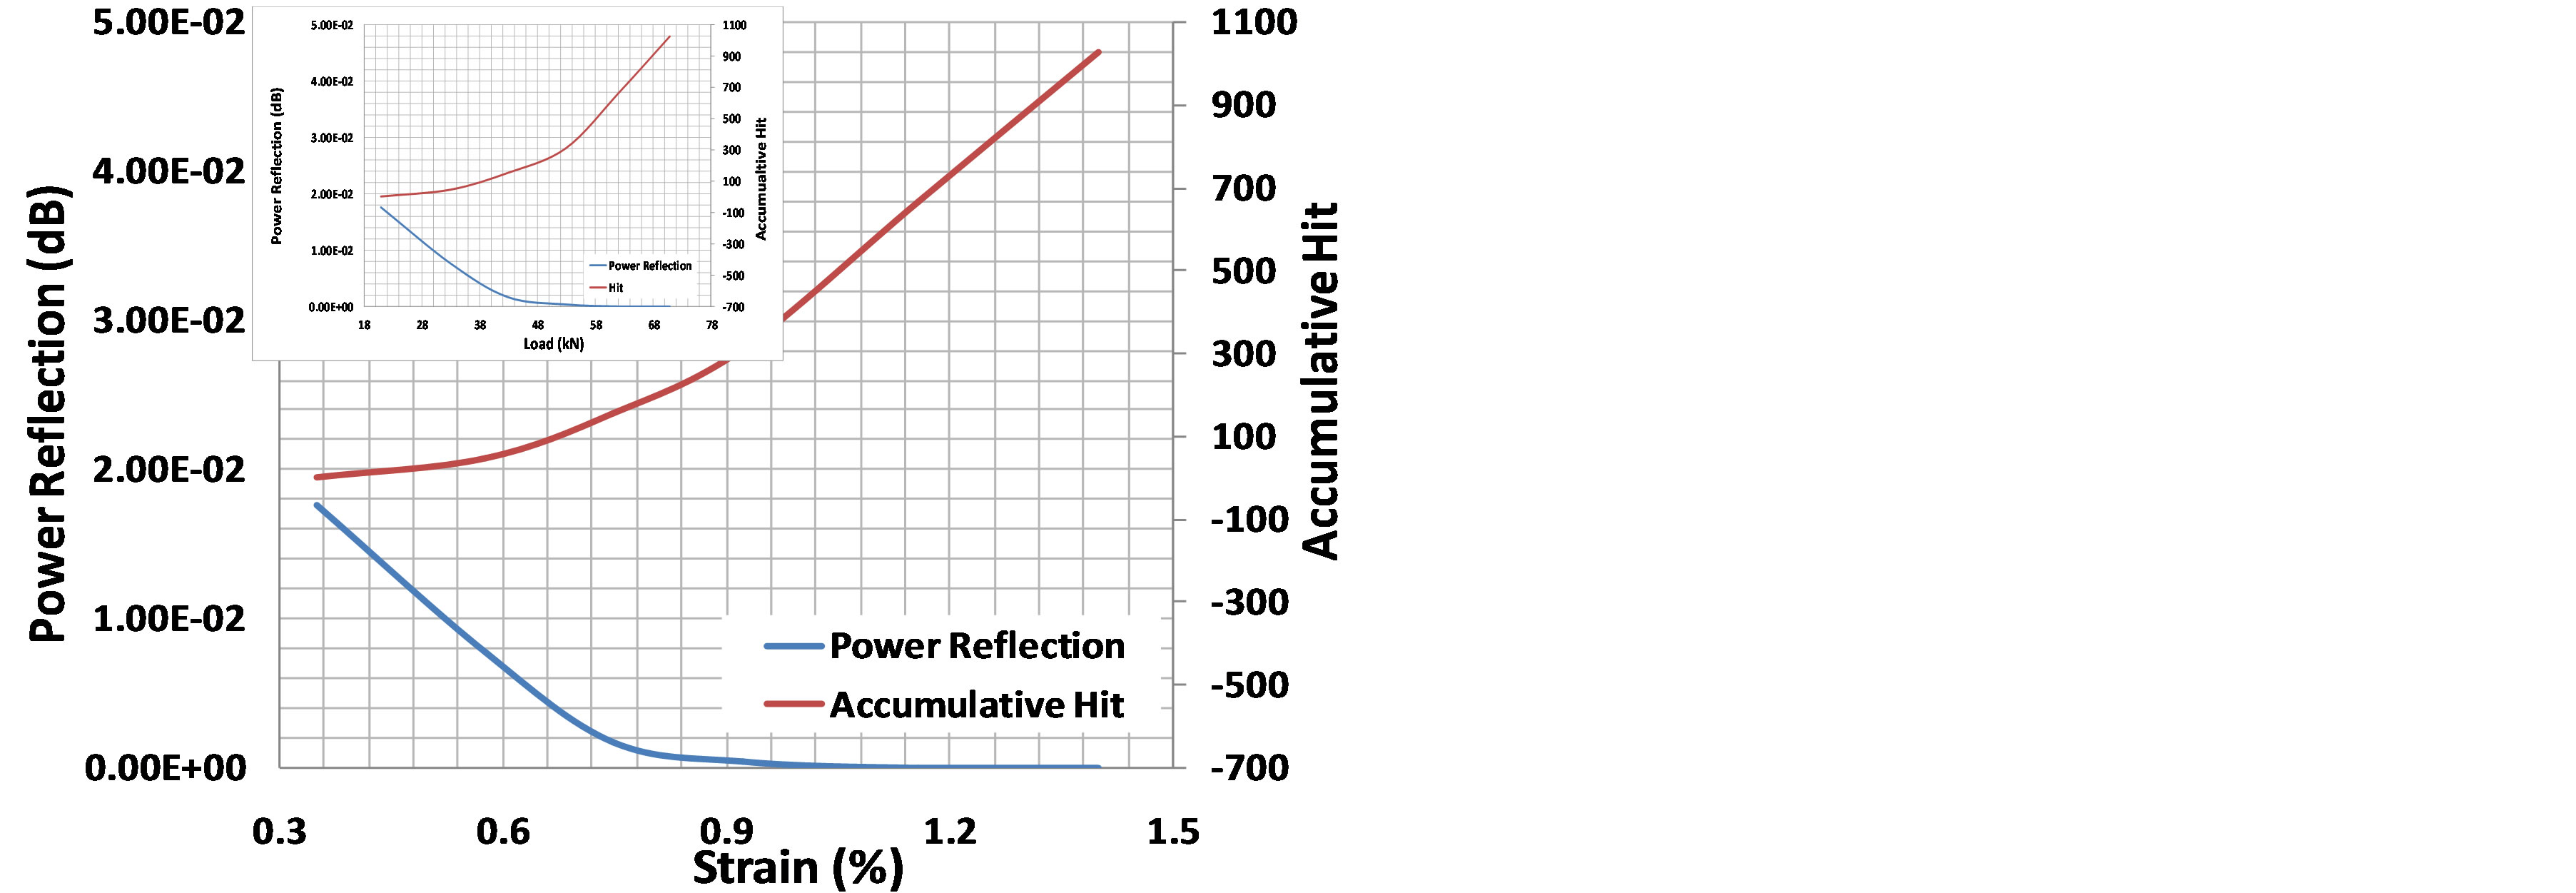
Figure 21. Power reflection of the FBG reading compared with AE: hit characteristic and mechanical behavior.
5. Non Destructive Inspection: Quantifying Damage
FBG strain sensors provide two data readouts in the spectrum analyzer: power reflection and wavelength. The wavelength equation has a linear relationship with the mechanical strain, as indicated by Equations (1) and (2). If the material or structure in which the FBG is embedded suffers damage that causes a non-linear mechanical strain response, Equations (1) and (2) cannot be used. However, if the response through the length of the FBG grating period is still uniform, the linear equations can still be used. The power reflection is used to measure whether the materials or structures have been damaged enough to cause the FBG grating length to become nonuniform. This measurement is marked by a multi-peak occurrence of the power reflection.
Figure 23 shows the setting of the ultrasonic c-scan inspection for the quantification of damage after conducting a mechanical test. Special techniques and tuning procedures were applied for the ultrasonic inspection of the various specimens. As is commonly done, the distance
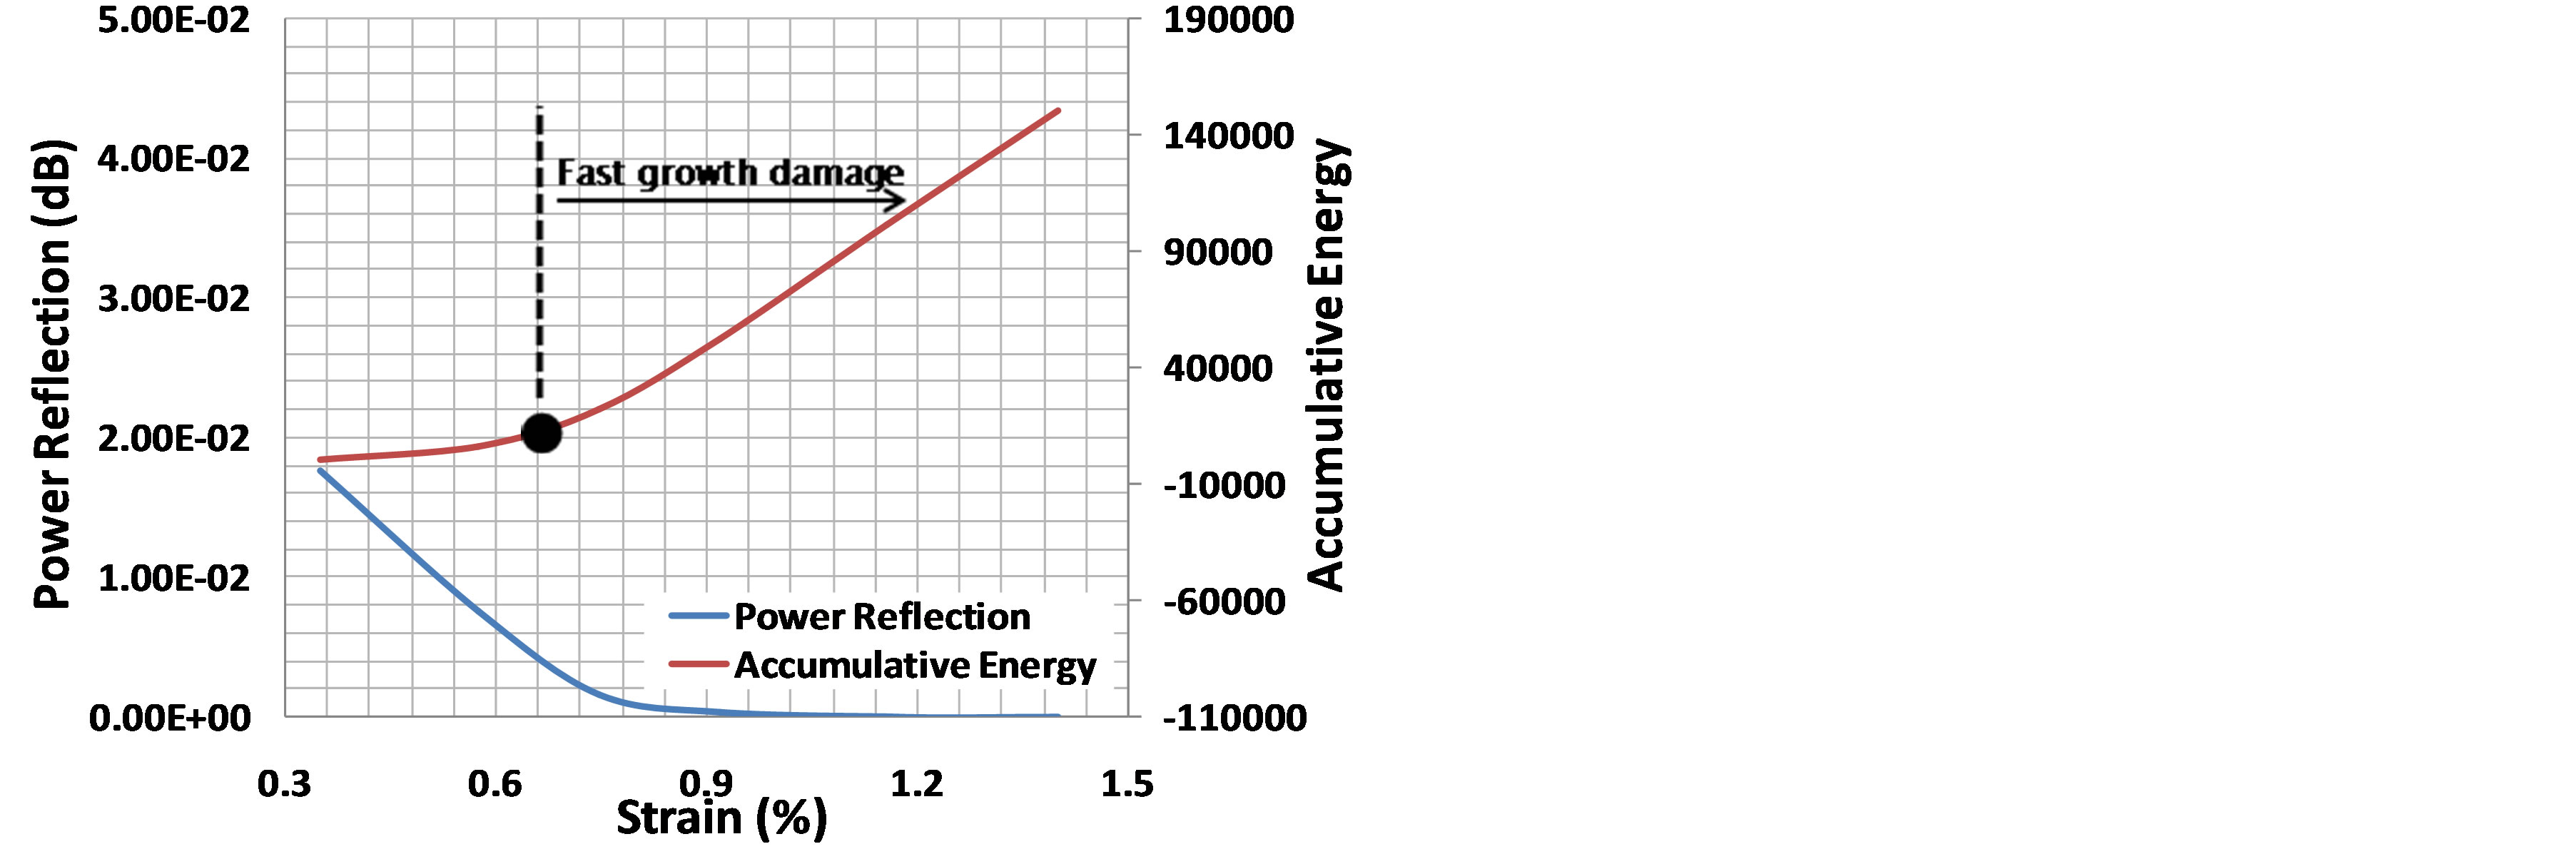
Figure 22. Power reflection of the FBG reading compared with AE: energy characteristic and mechanical behavior.
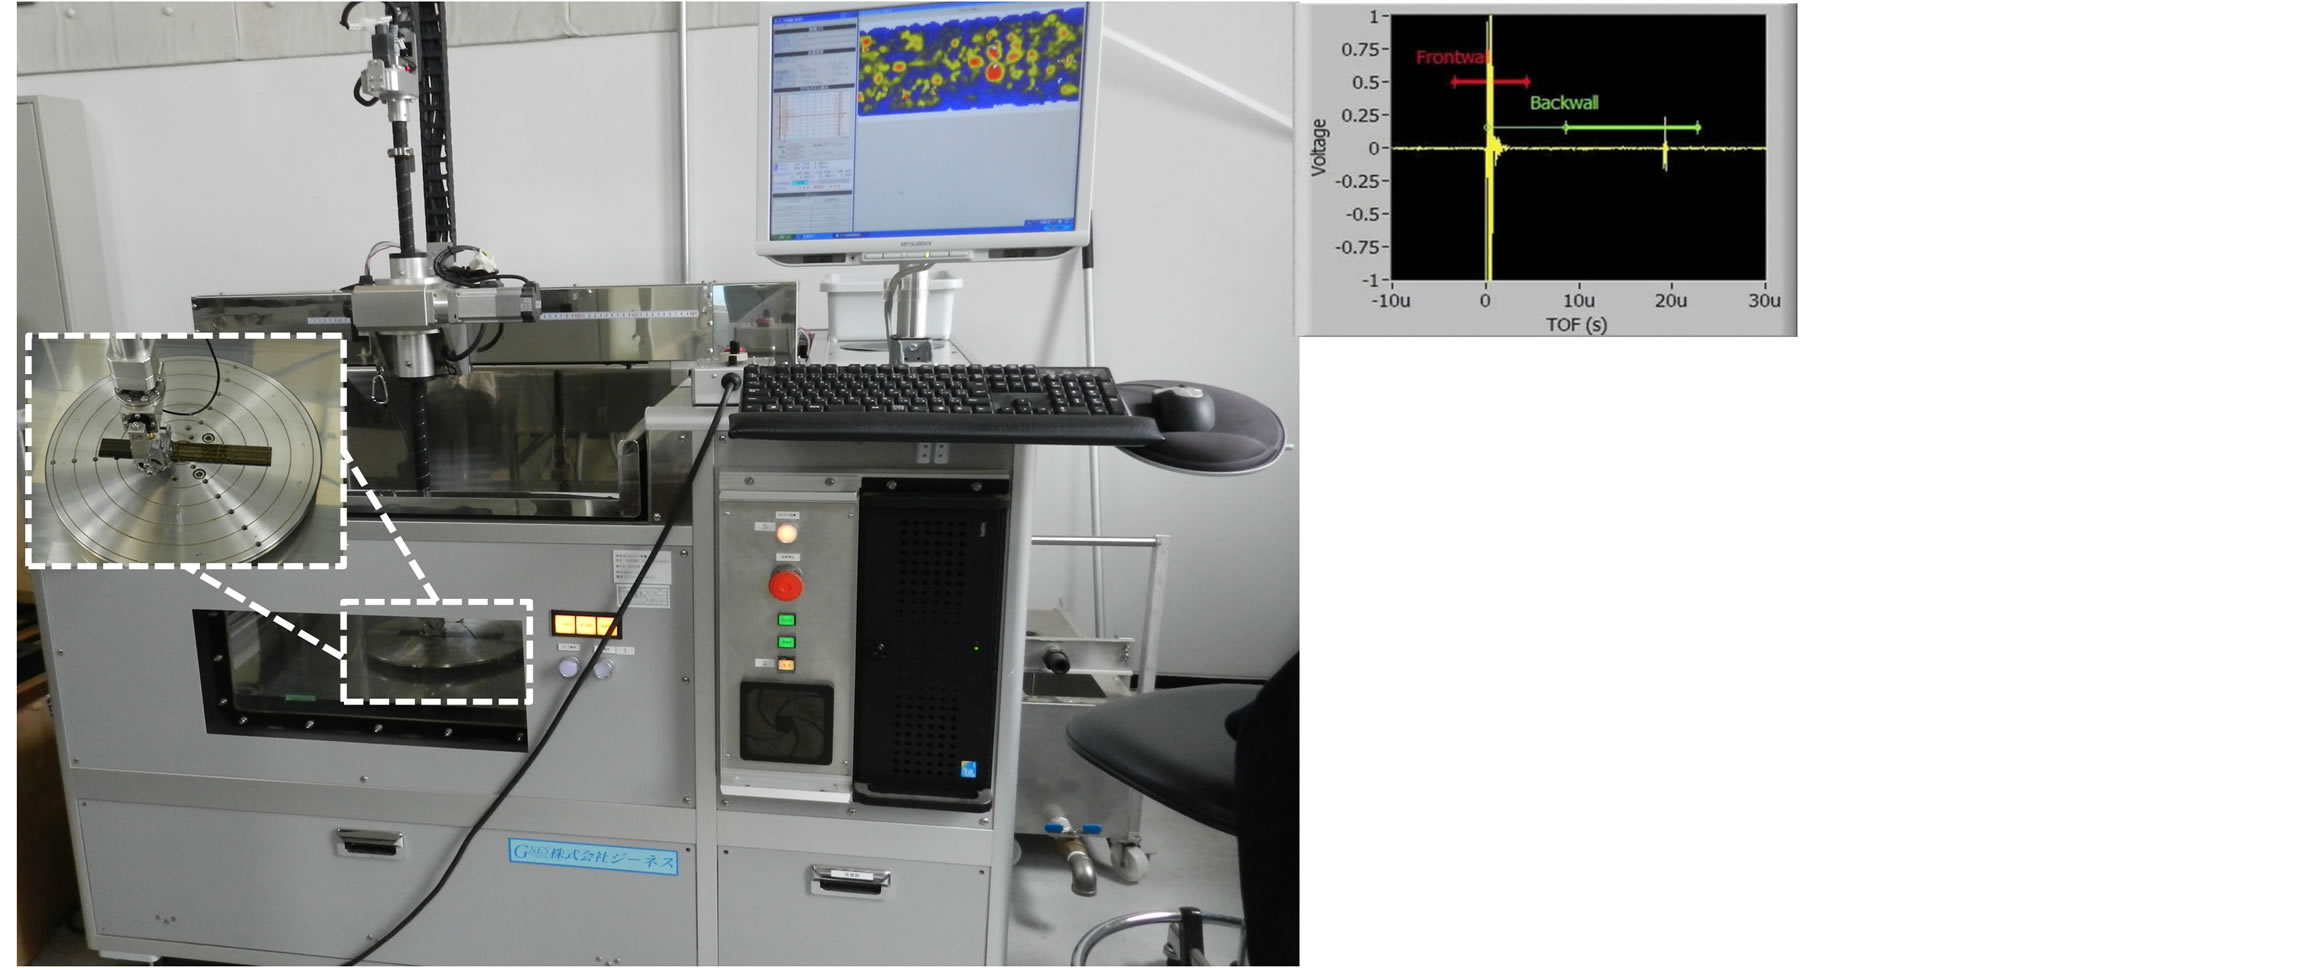
Figure 23. Ultrasonic c-scan inspection.
between the transducer and the material (water path) was set at the end of the near field value of the transducer that was used (which is 25 mm) to avoid the fluctuation of the acoustic pressure that takes place in the near field zone. A steel plate, on which the specimens were placed, was used as a reflective plane to distinguish the back wall echo from any other echos. A linear Distance Amplitude Correction (DAC) curve was used to increase the ultrasonic signal amplitude, thus reducing the causes of the signal losses to factors such as scattering, absorption, etc. The gates were synchronized with the first echo from the specimen, and the detection threshold was adjusted to a value that was greater than 50% of the Full Screen Height (FSH), avoiding the generated noise echoes.
Figures 24-29 show the ultrasonic c-scan results from the interrupt load test. Two projection views are provided in the right and on the bottom of the surface/main view to reflect the damage condition inside the stitch laminate specimen in detail. Theoretically, the damage will start in ply no.2, near the surface, but in this case, the damage clearly initiates at the location of the FBG. One of the reasons this occurs is that the FBG coating was not compatible with the resin used. Thus, it is important to determine another coating of FBG that is suitable with the resin used to prevent the FBG from creating an impurity in the material system. Therefore, the damage that starts in the area near the FBG placement will then develop in the weakest area near that location and start to grow in the area near surface, as shown in Figures 27-29.
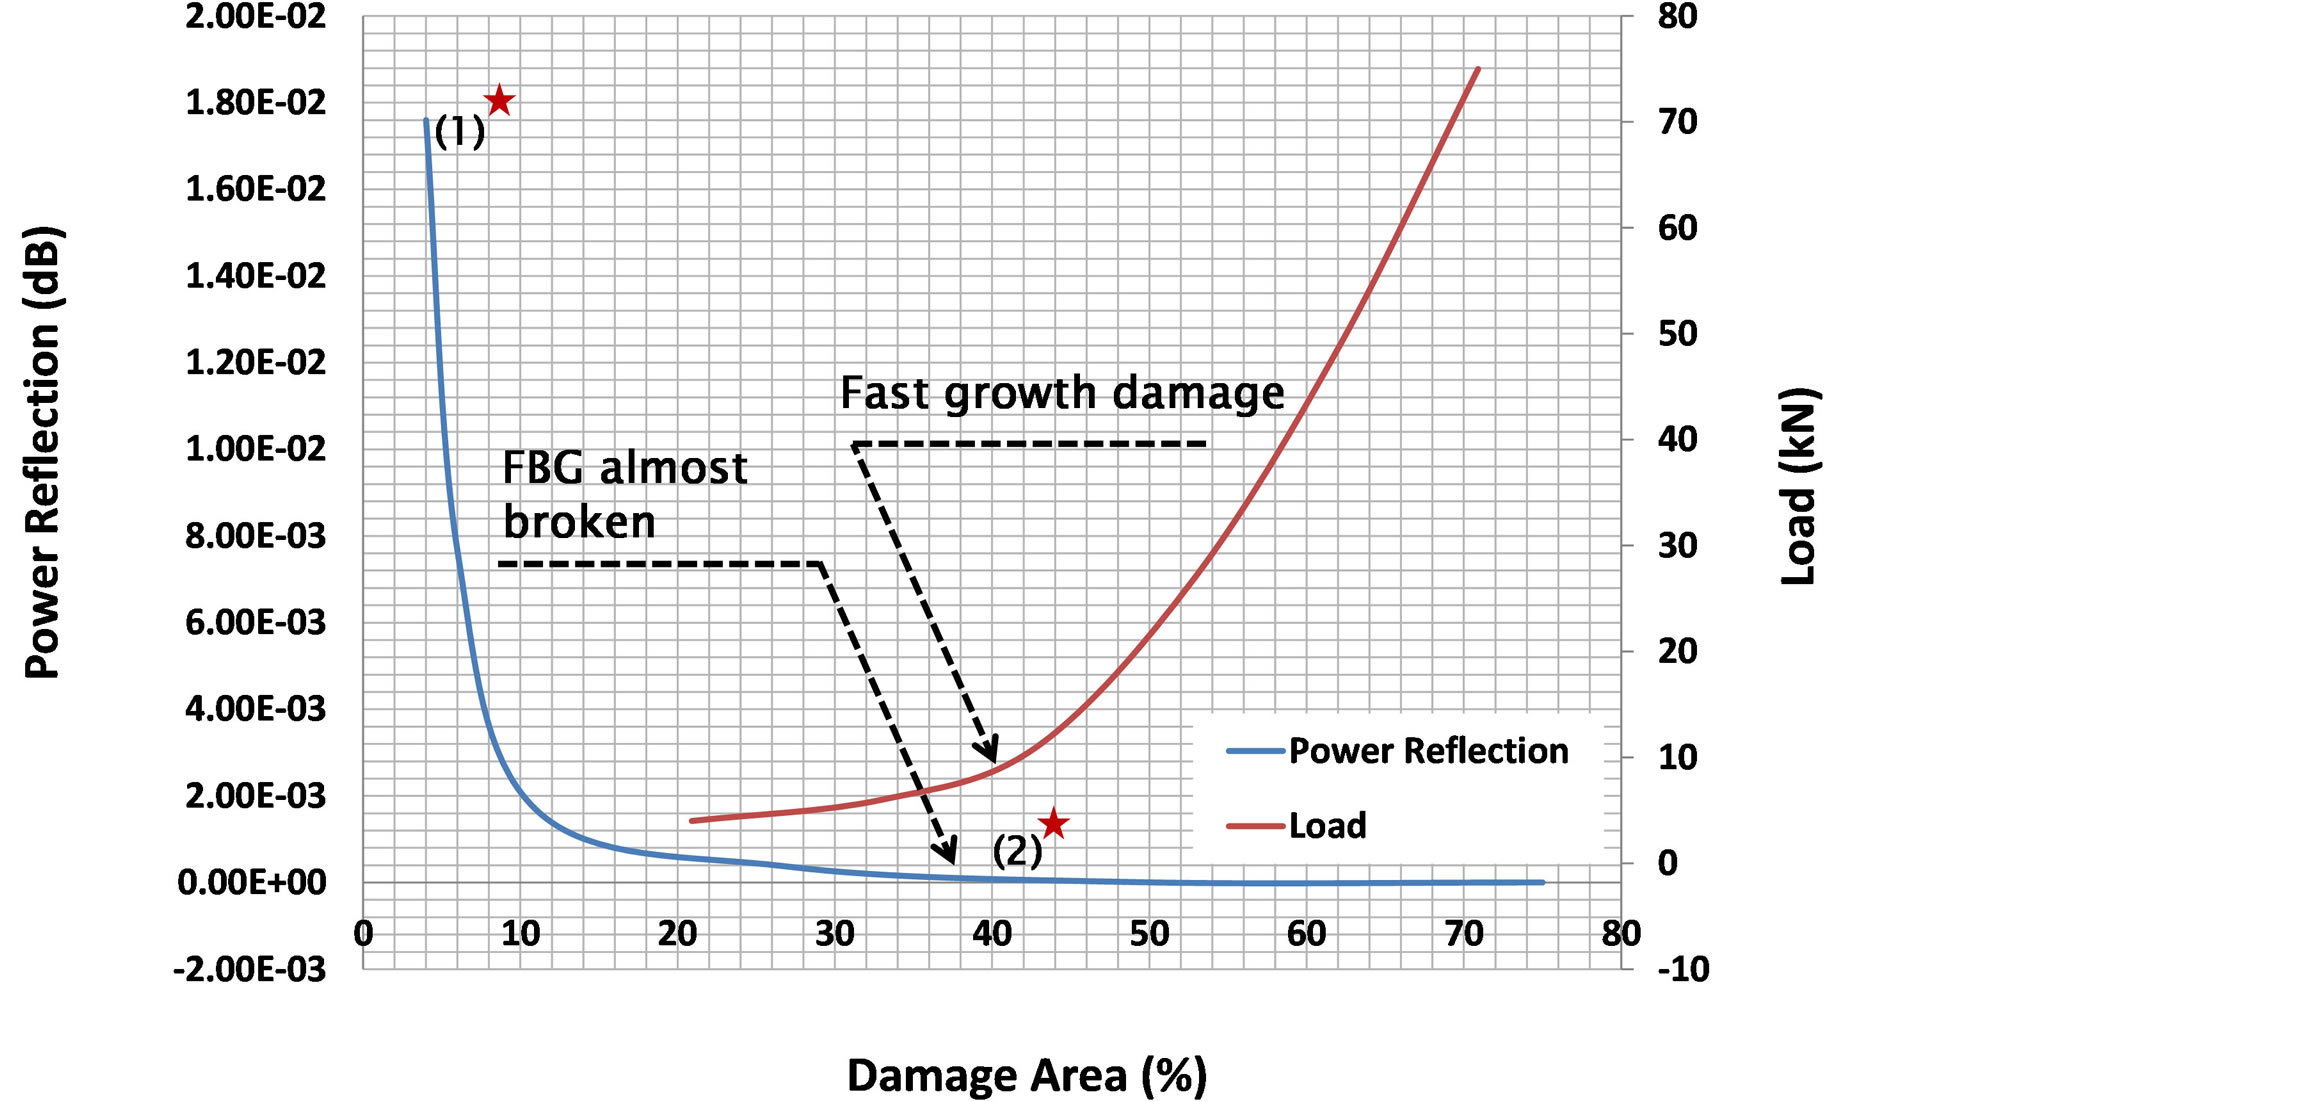
Figure 30 overlays the damage quantification from the power reflection with the FBG reading and the load versus the percentage of damaged area. The graph demonstrates how the multi-peak power reflection occurrence quantifies the damage growth in the specimen model with tension loading. By noting the highest peak after the occurrence of the multi-peak power reflection, we can see a correlation between the multi-peak spectrum and damage growth. Conversely, a steep line on the graph indicated many damage sources in stitch laminate with producing many rich resin area around threads which creates a crack initiation as shown in Figure 30(b).
Figure 31 overlays the power reflection from FBG reading and the accumulative hit from the AE reading versus the percentage of the damaged area. In principal, both techniques can be used to detect and quantify damage, but the FBG technique is superior because only requires a single spectrum to characterize the damage, while AE depends on the test setting to determine the many spectrums that reacher the threshold set during the damage growth. Thus, different test settings may produce different results.
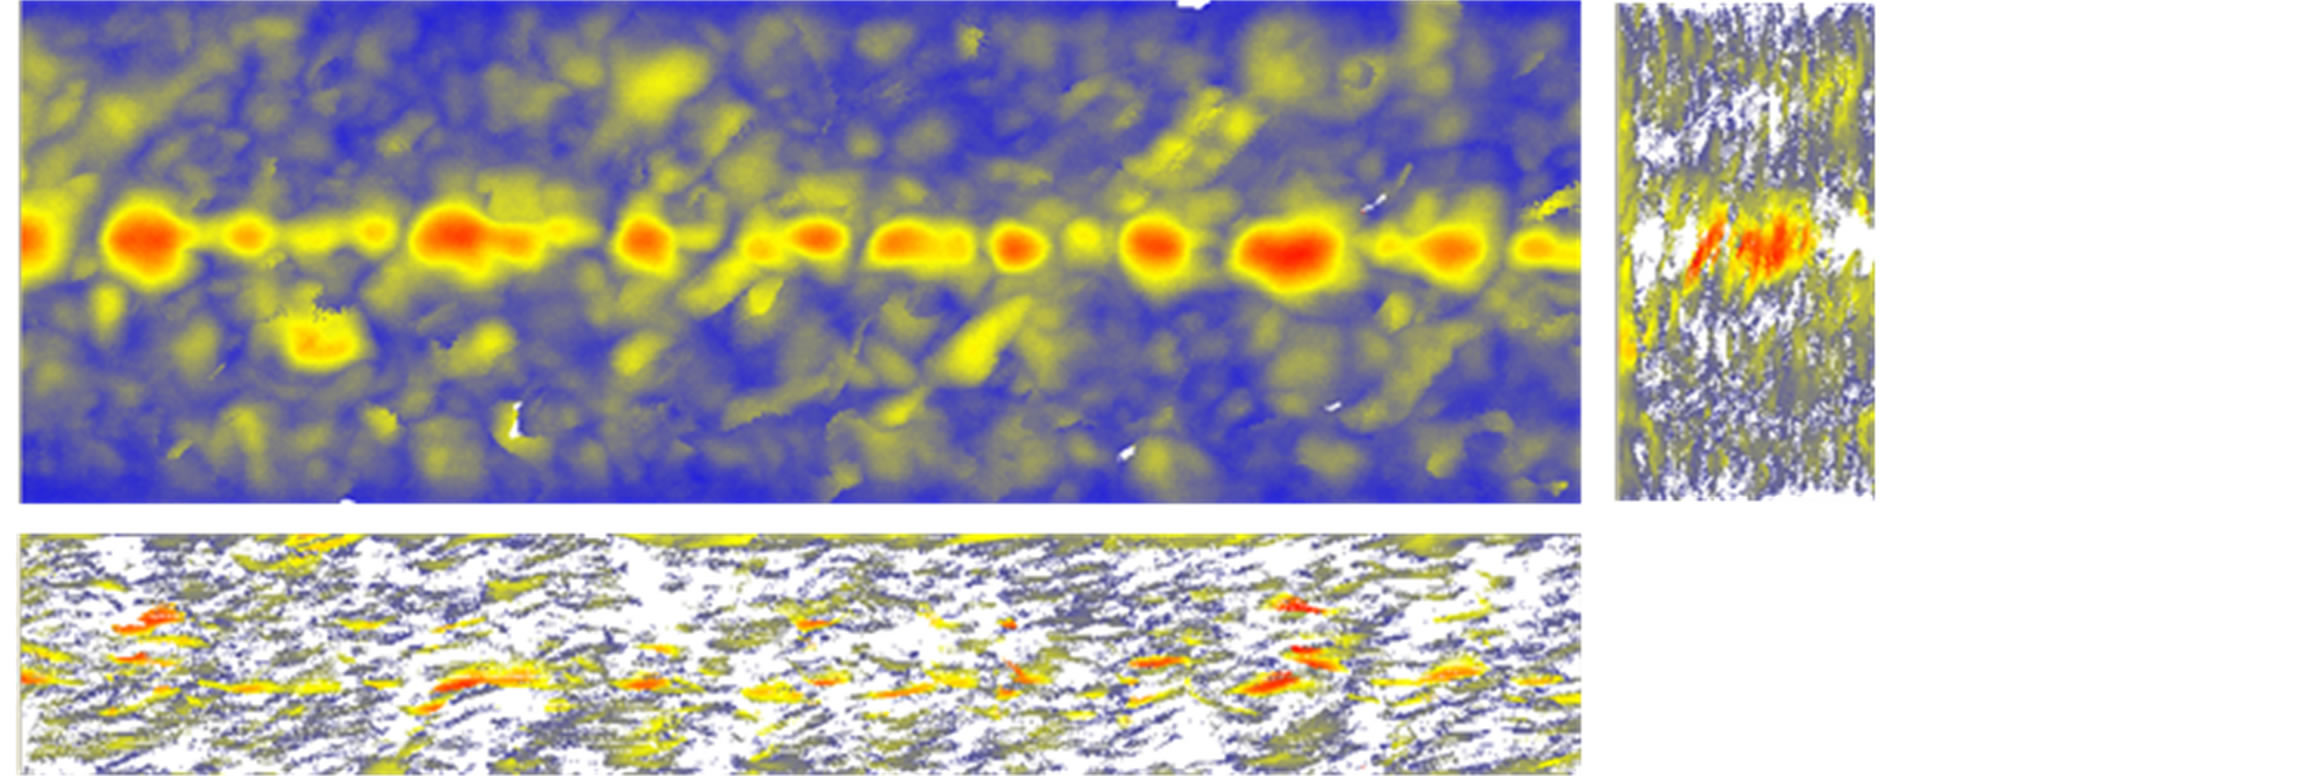
Figure 24. Interrupt test 1.
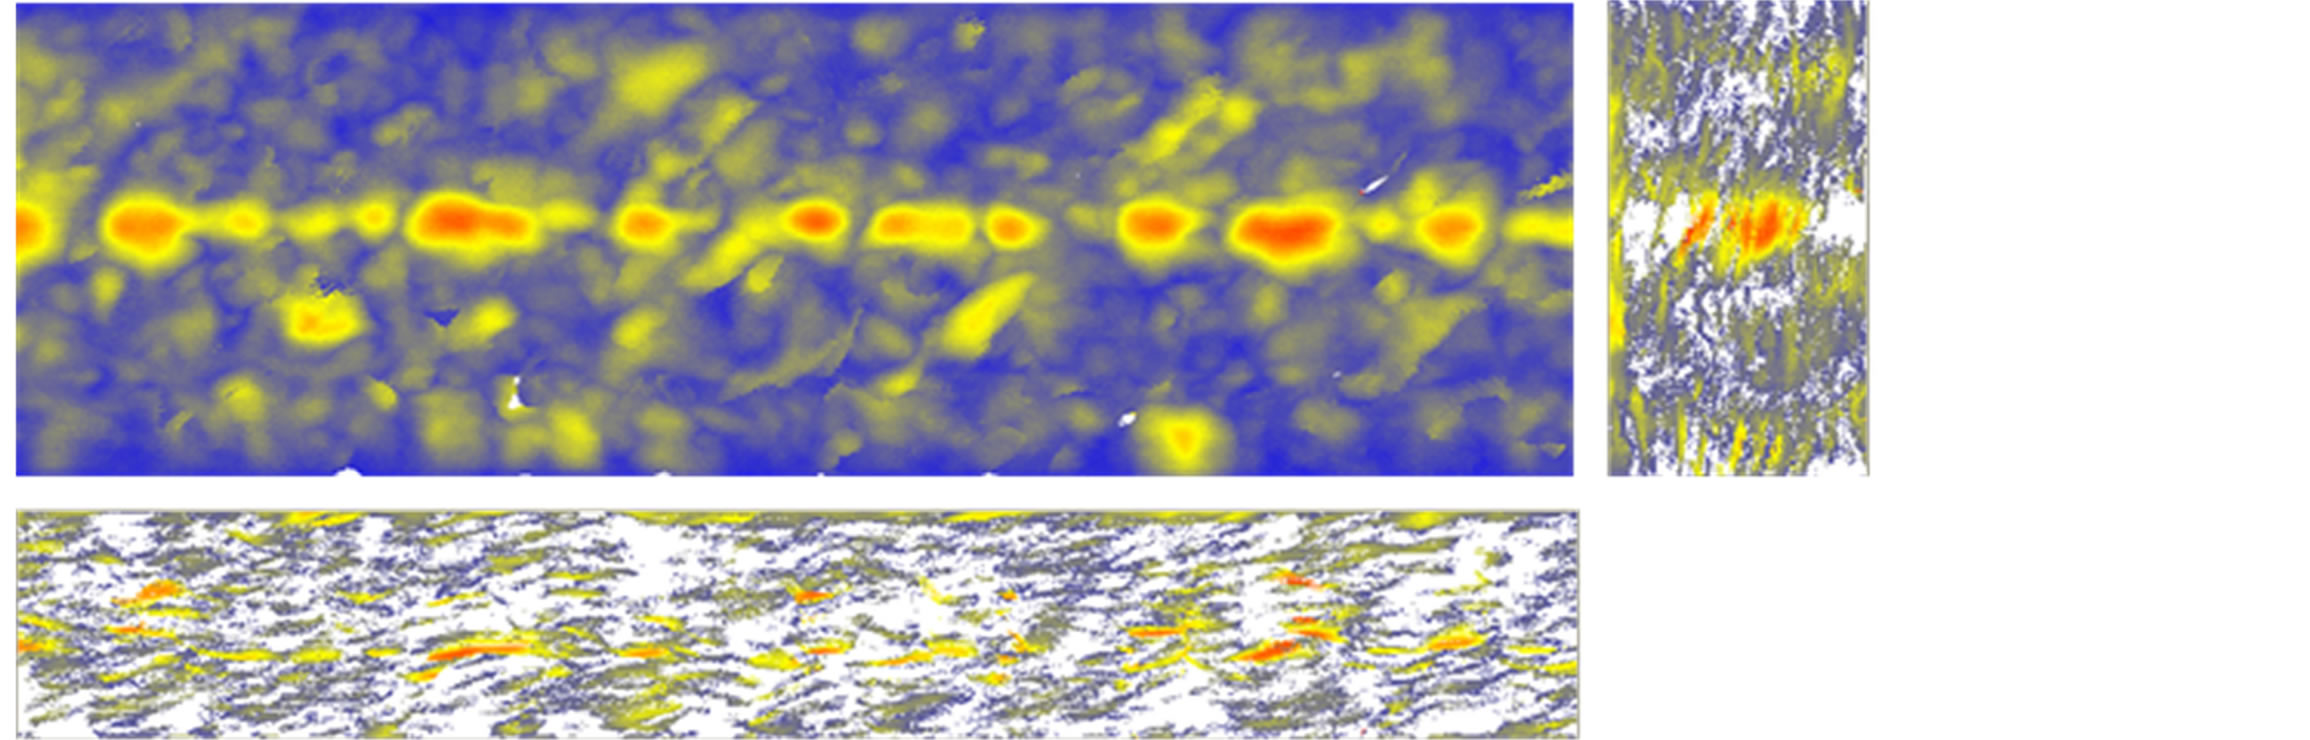
Figure 25. Interrupt test 2.
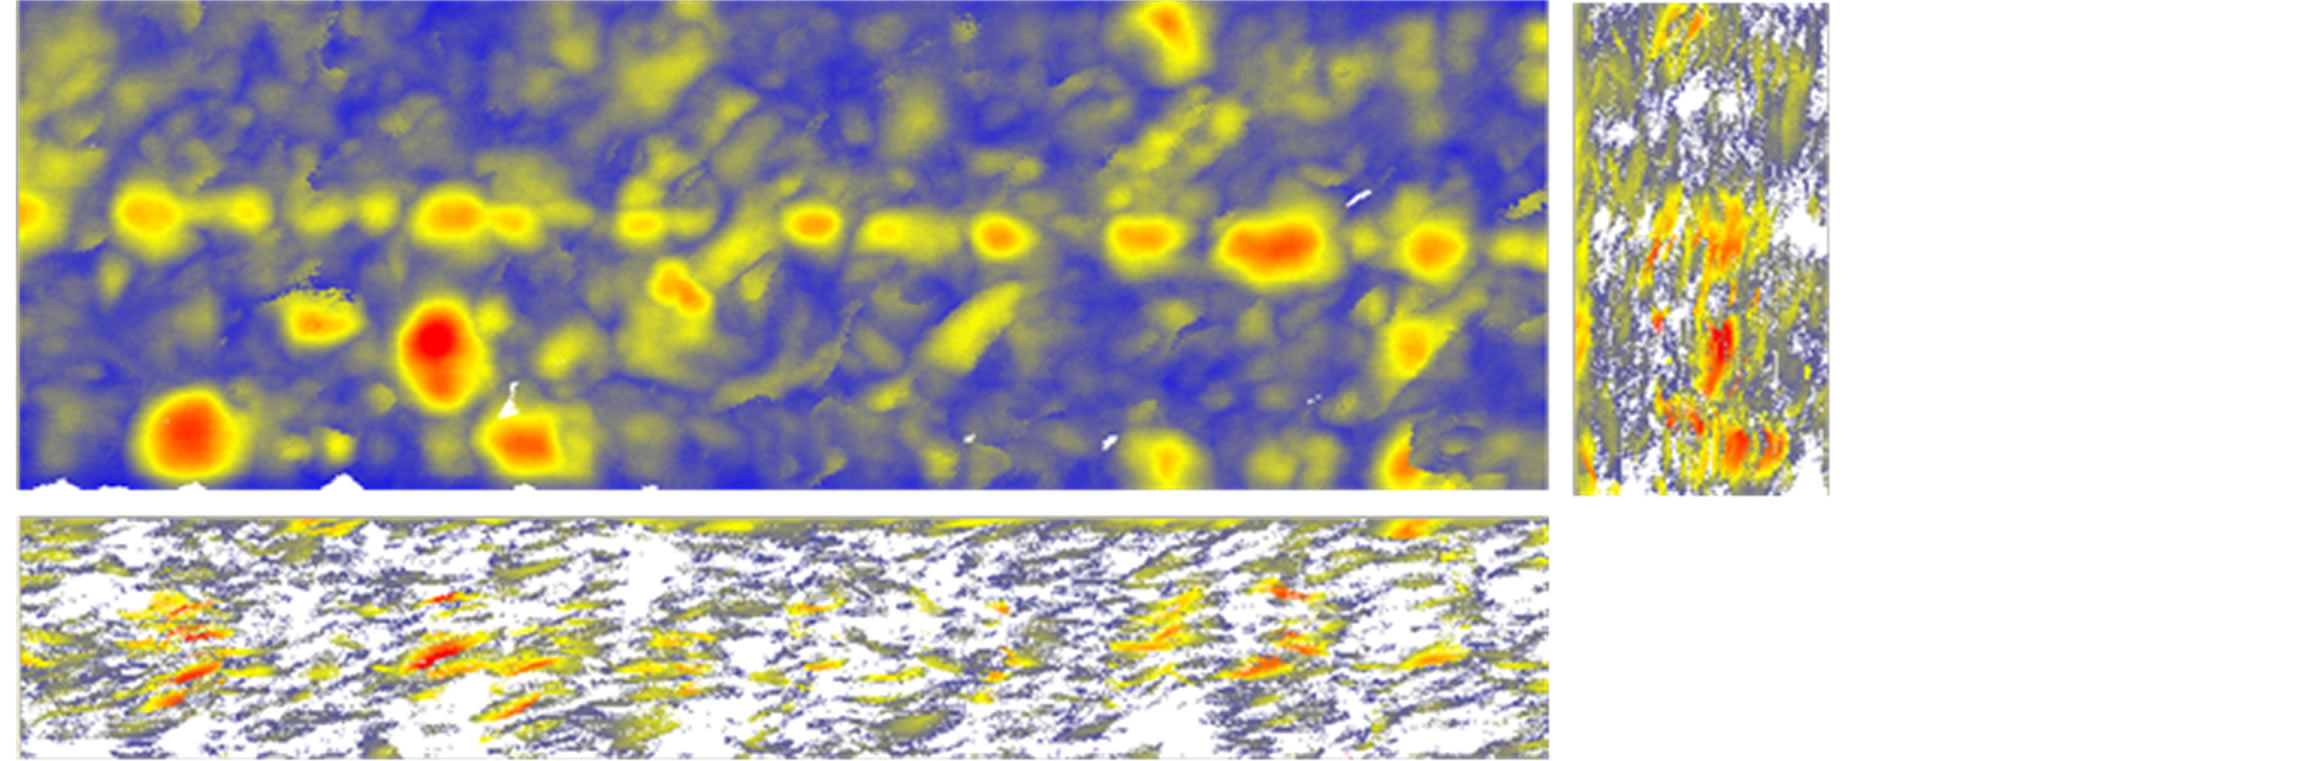
Figure 26. Interrupt test 3.
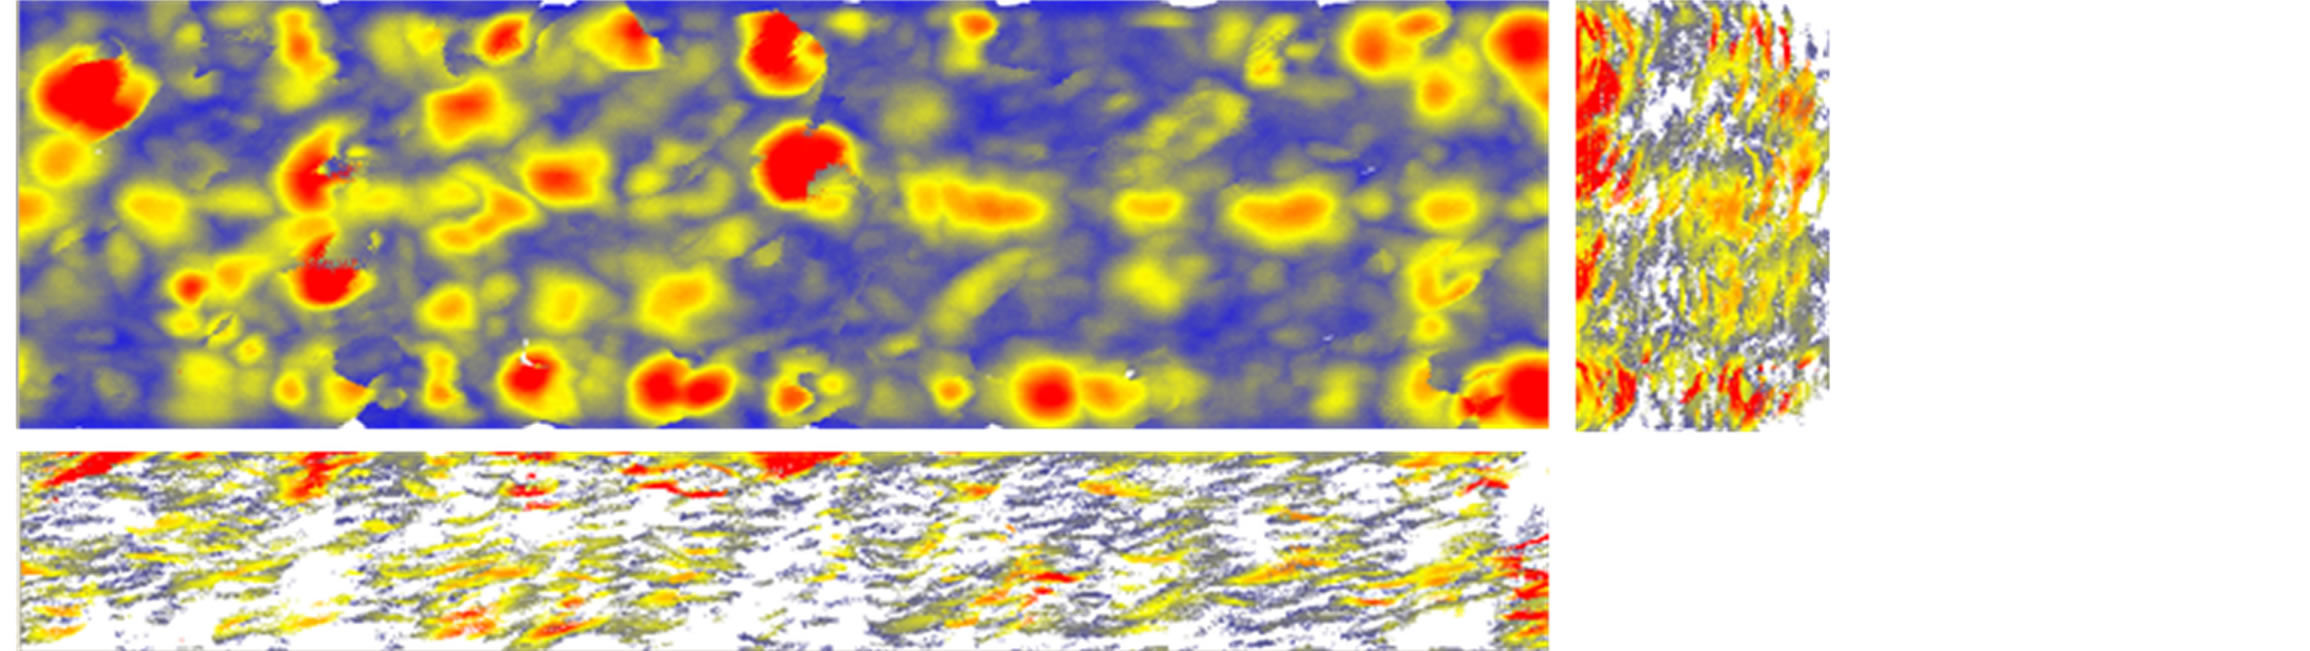
Figure 27. Interrupt test 4.
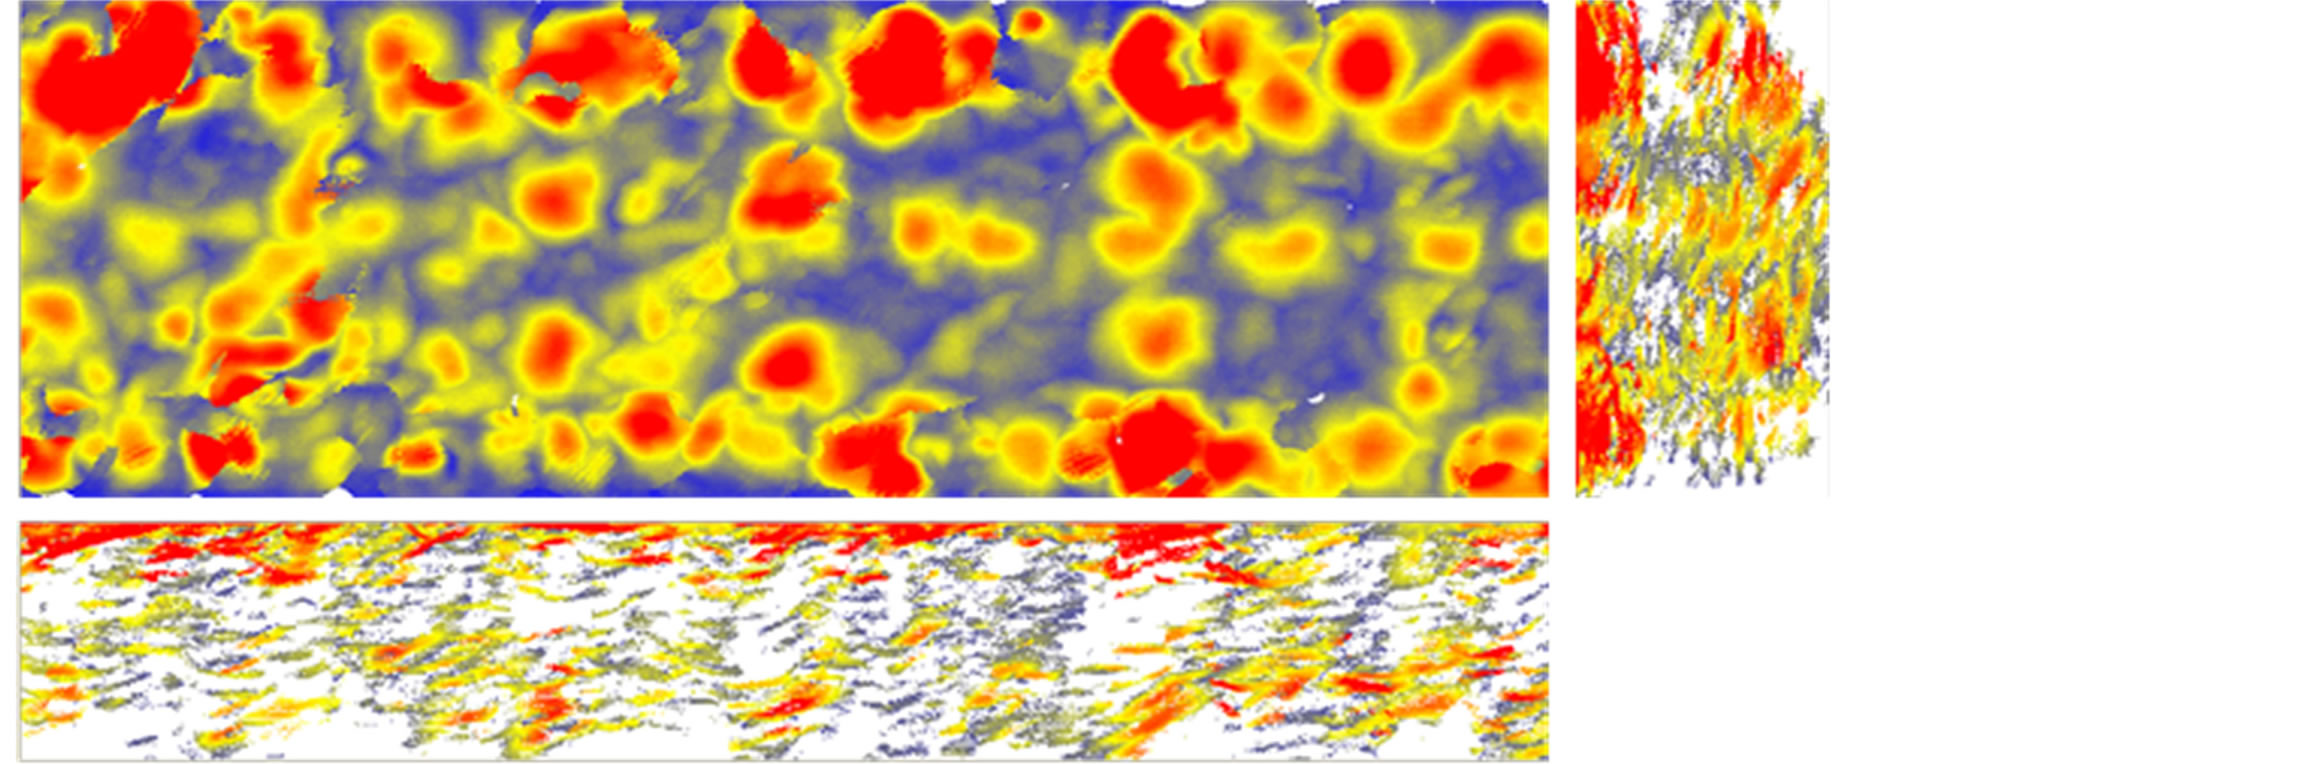
Figure 28. Interrupt test 5.
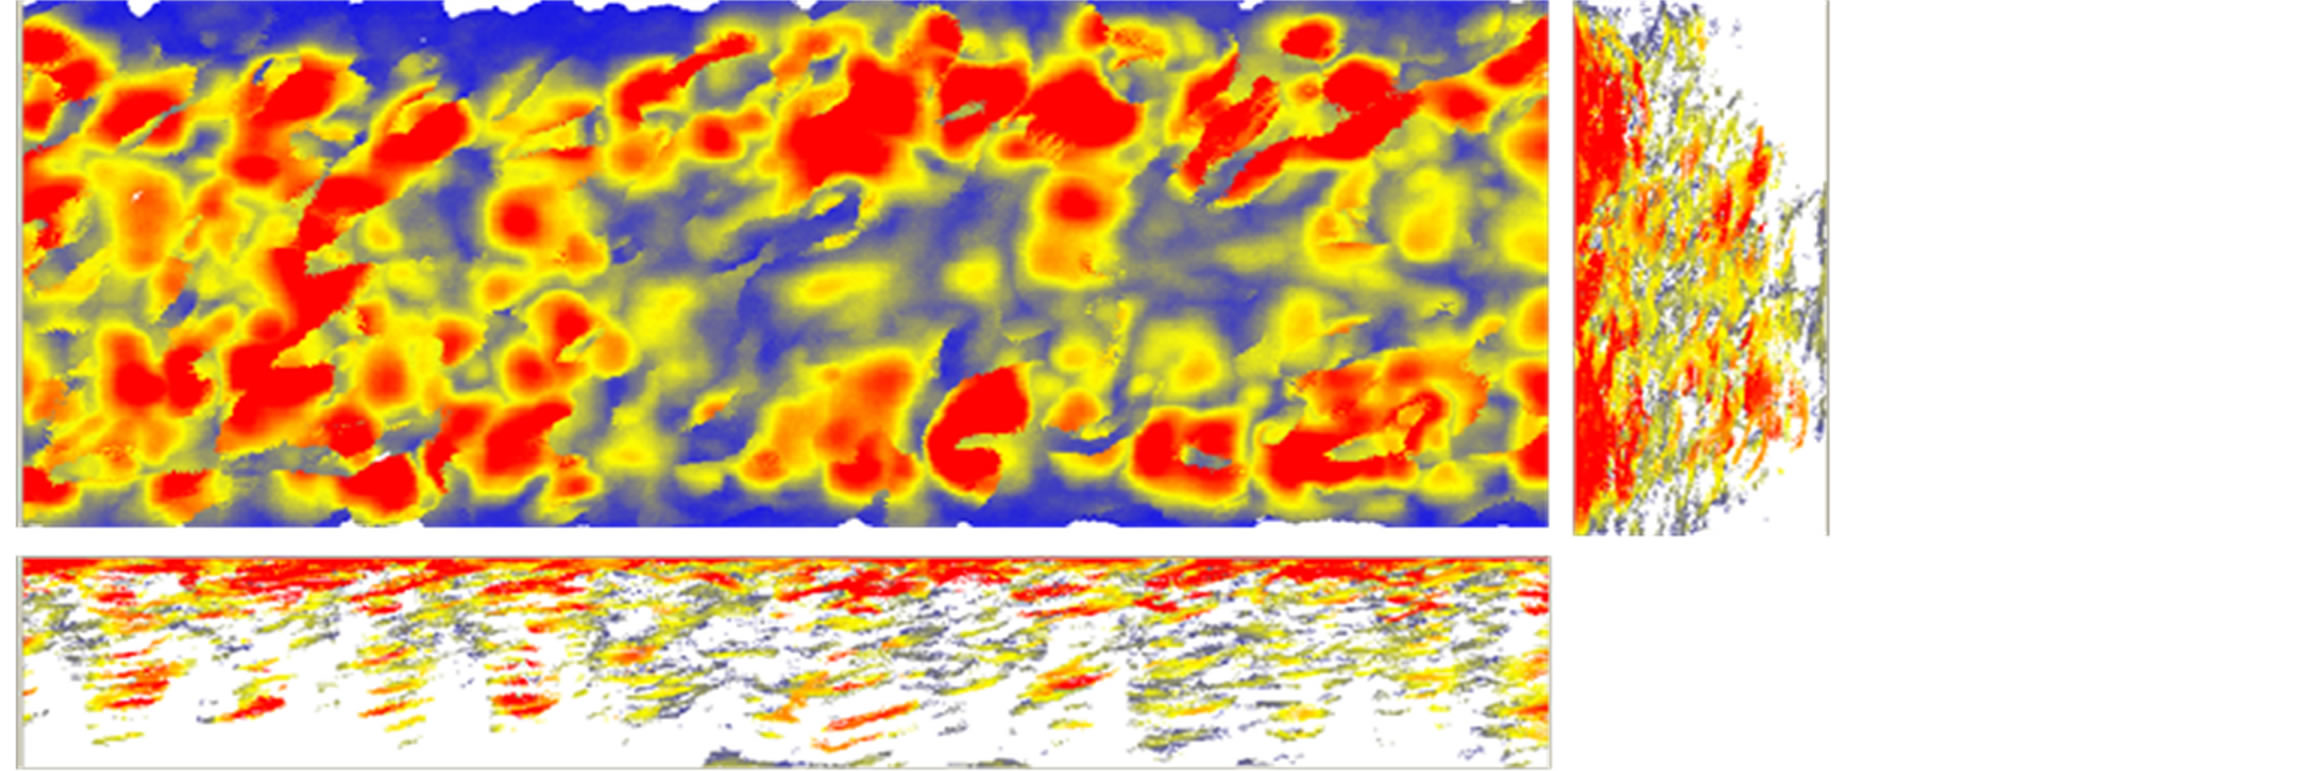
Figure 29. Interrupt test 6.
 (a)
(a)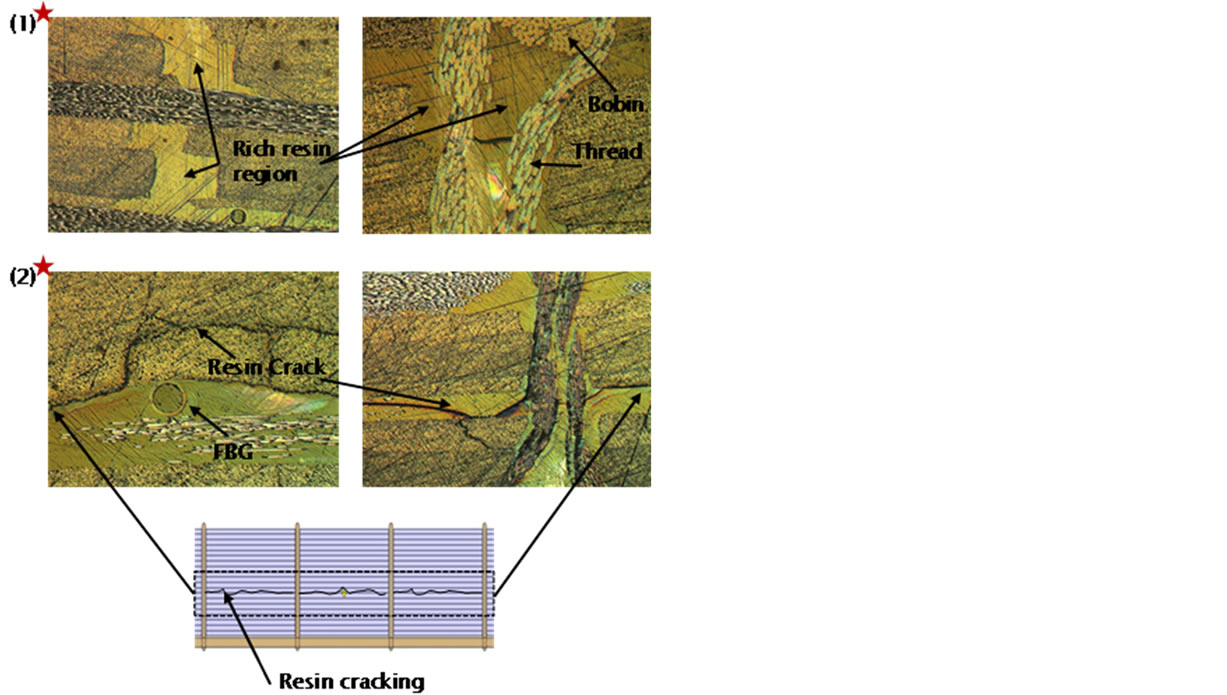 (b)
(b)
Figure 30. Damage quantification based on the FBG reading and mechanical behavior.
6. Conclusions
The behavior of a stitch laminate has been demonstrated by numerical and empirical approaches, using FBG sensors and with additional comparisons with acoustic emission readings. The continuous monitoring of damage using FBG has also been demonstrated. Numerical and empirical approaches have become crucial to determine the proper placement of the FBG. As a result, the behavior of the model and its tendency to create damage must be understood before the fabrication of the specimen models in order to avoid misreadings.
We conclude that the FBG can detect initial damage and its subsequent growth properly, as proven by empirical data. The occurrence of damage to the specimen models can be characterized by the FBG by the occurrence of multiple peaks in the power reflection. The damage growth can be successfully quantified by FBG readings by knowing the decreasing trend of the highest peak during the occurrence of the multi-peak spectrum. It is also important to determine the coating material of the FBG optical fiber to avoid incompatibility with the resin used in the stitch laminate system during fabrication. Additionally, acoustic emission readings can be used to
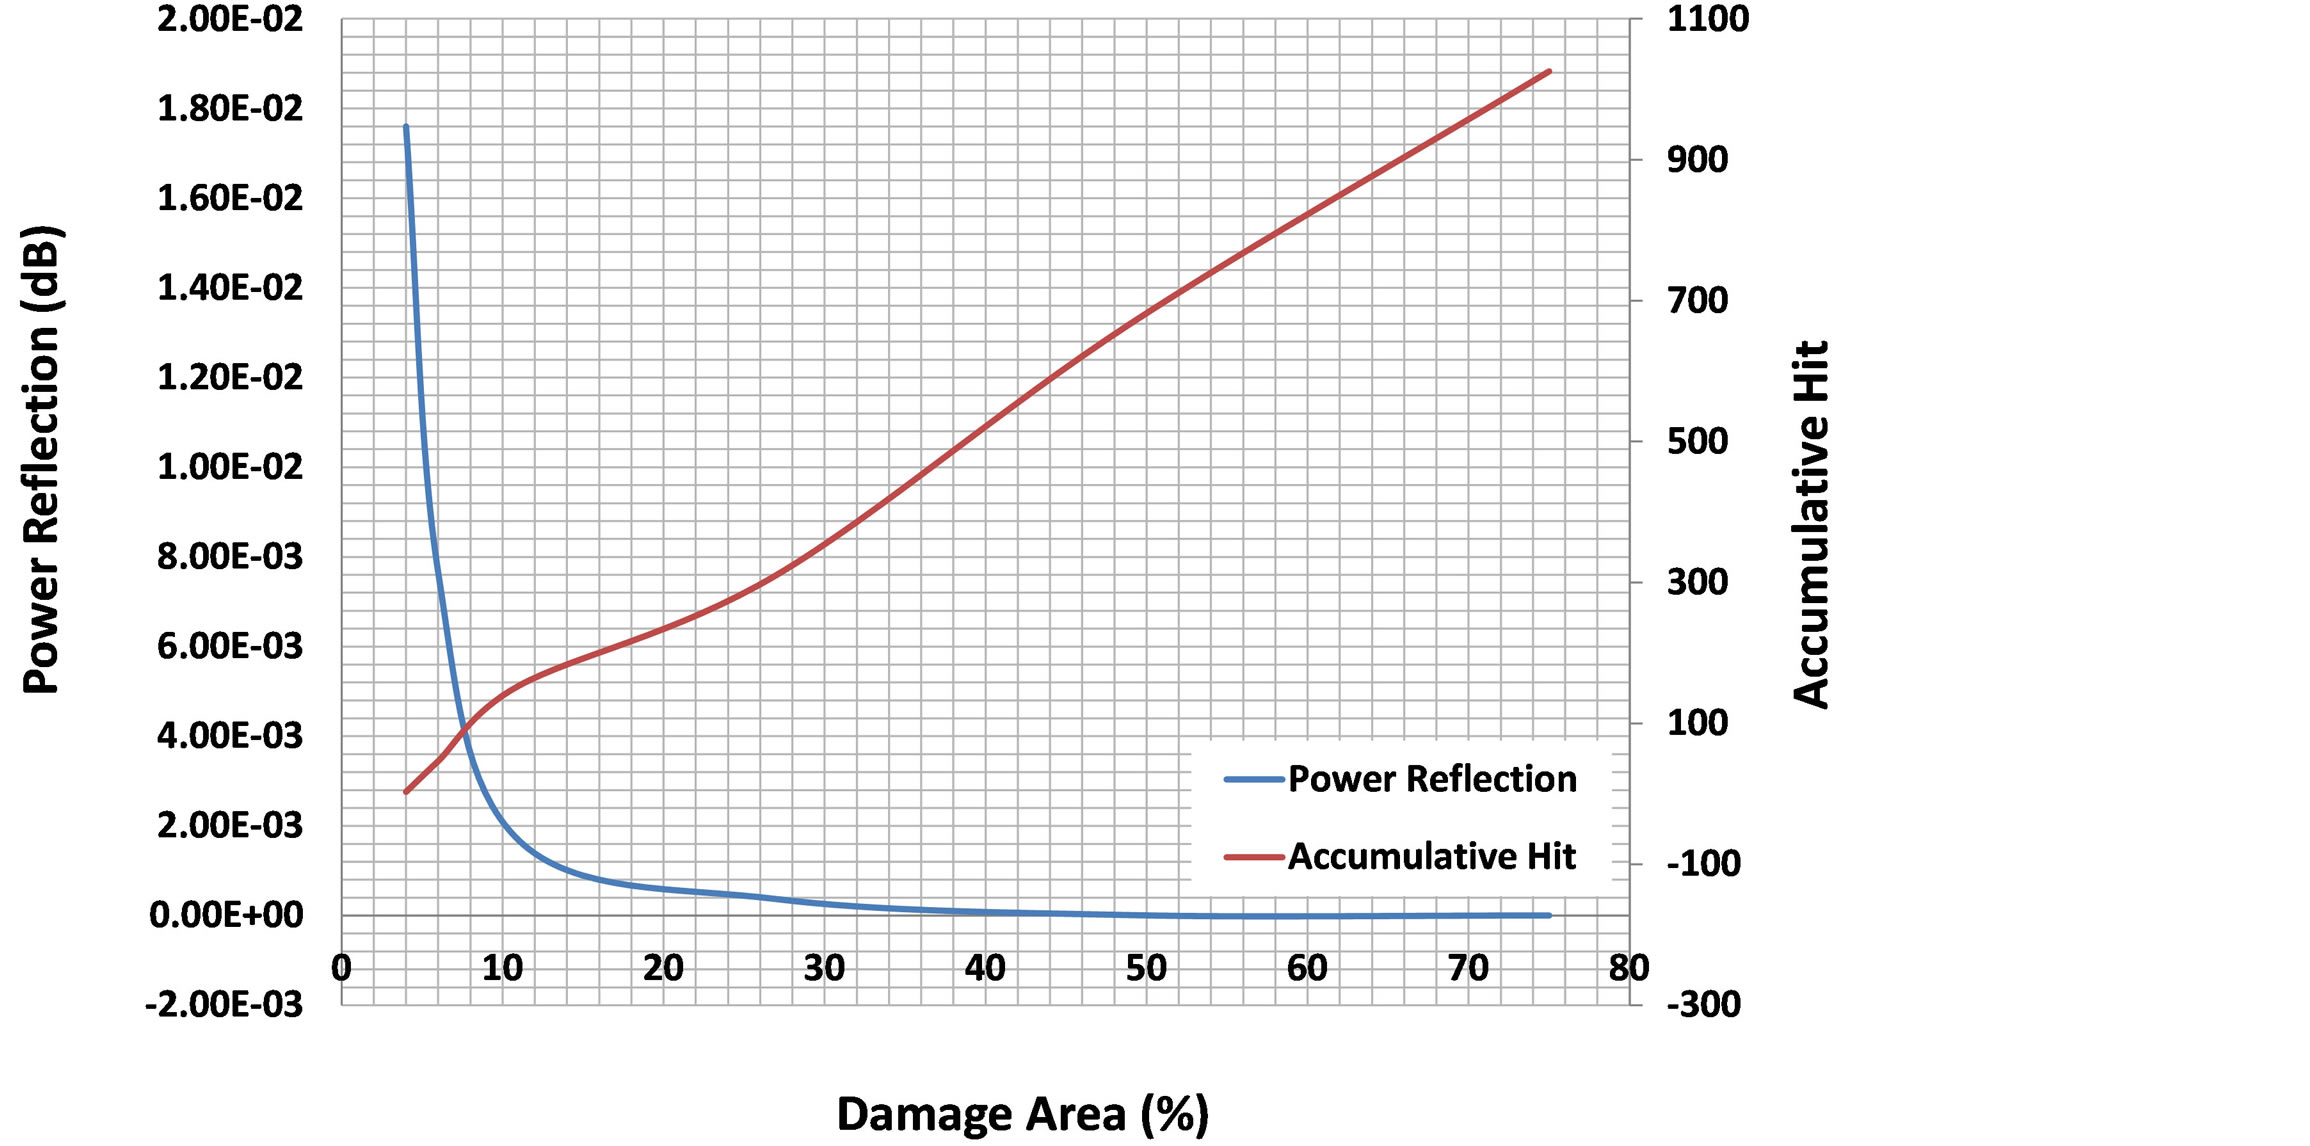
Figure 31. Damage quantification based on the FBG reading and AE characteristic.
detect and quantify the damage, but FBG has the advantage in that its data involve only a single spectrum and are therefore simpler.
With the above-mentioned considerations, it is necessary to continue research on a proper coating of the FBG optical fiber and on various stitch densities in the laminate to enrich the available data.
Acknowledgements
The authors gratefully acknowledge the Tokyo Metropolitan Government for its financial support from the Asian Human Resources Fund under the project Asian Network of Major Cities 21 (ANMC21). Experimental assistance from Dr. Satoshi Kobayashi is gratefully acknowledged.
REFERENCES
- J. R. Vinson, “The Behavior of Structures Composed of Composite Materials,” Kluwer Academic Publisher, New York, 2004.
- A. Baker, “Composite Materials for Aircraft Structure,” American Institute of Aeronautics and Astronautics Publishers, 2004.
- S. Sridharan, “Delamination Behavior of Composite,” Woodhead Publishers, Cambridge, 2008.
- T. Hahn, J. M. Yang, S. Suh, T. Yi and G. C. Wu, “Damage Tolerance and Durability of Selectively Stitched, Stiffened Panels,” DOT/FAA/AR-03/46, 2003.
- K. Peters, P. Pattis, J. Botsis and P. Giaccari, “Experimental Verification of Response of Embedded Optical Fiber Bragg Grating Sensors in Non-Homogeneous Strain Fields,” Optic and Lasers in Engineering Journal, Vol. 33, No. 2, 2000, pp. 107-119. http://dx.doi.org/10.1016/S0143-8166(00)00033-6
- S. Huang, M. M. Ohn, M. Leblanc and R. M. Measures, “Continuous Arbitrary Strain Profile Measurements with Fiber Bragg Grating,” Smart Material and Structure Journal, Vol. 7, No. 2, 1998, pp. 248-256. http://dx.doi.org/10.1088/0964-1726/7/2/012
- H. Wang, S. L. Ogin, A. M. Thorne and G. T. Reed, “Interaction between Optical Fibre Sensors and Matrix Cracks in Cross-Ply GFRP Laminates. Part 2: Crack Detection,” Composite Science and Technology, Vol. 66, No. 13, 2006, pp. 2367-2378. http://dx.doi.org/10.1016/j.compscitech.2005.10.021
- N. Takeda, “Characterization of Microscopic Damage in Composite Laminates and Real-Time Monitoring by Embedded Optical Fiber Sensors,” International Journal of Fatigue, Vol. 24, No. 2-4, 2002, pp. 281-289. http://dx.doi.org/10.1016/S0142-1123(01)00083-4
- S. Yashiro, N. Takeda, T. Okabe and H. Sekine, “A New Approach to Predicting Multiple Damage States in Composite Laminates with FBG Sensors,” Composite Science and Technology Journal, Vol. 65, No. 3-4, 2005, pp. 659- 667. http://dx.doi.org/10.1016/j.compscitech.2004.09.022
- J. Botsis, L. Humbert, F. Colpo and P. Giaccari, “Embedded Fiber Bragg Grating Sensor for Internal Strain Measurements in Polymeric Materials,” Optic and Lasers in Engineering Journal, Vol. 43, No. 3-5, 2005, pp. 491- 510. http://dx.doi.org/10.1016/j.optlaseng.2004.04.009
- W. Sprenger and W. Wagner, “On the Formulation of Geometrically Nonlinear 3D-Rebar-Elements Using the Enhanced Assumed Strain Method,” Engineering Structures Journal, Vol. 21, No. 3, 1999, pp. 209-218. http://dx.doi.org/10.1016/S0141-0296(97)00182-X
- G. Meschke and P. Helnwein, “Large-Strain 3D-Analysis of Fibre-Reinforced Composite Using Rebar Elements: Hyperelastic Formulation for Cords,” Computational Mechanics Journal, Vol. 13, No. 4, 1994, pp. 241-254.
NOTES
*Corresponding author.