Open Journal of Radiology
Vol.4 No.2(2014), Article ID:46305,8 pages DOI:10.4236/ojrad.2014.42024
Multimodal Imaging to Delineate Tumor Heterogeneity in Cerebral Gliomas
Astrid Ellen Grams1*, Jens Gempt2, Florian Ringel2, Eric Soehngen3,4, Sabrina Astner5, Jürgen Schlegel4, Bernhard Meyer2, Claus Zimmer3, Annette Förschler3
1Department of Neuroradiology, Medical University Innsbruck, Innsbruck, Austria
2Department of Neurosurgery, Klinikum Rechts der Isar, Technical University Munich, Munich, Germany
3Department of Neuroradiology, Klinikum Rechts der Isar, Technical University Munich, Munich, Germany
4Department of Neuropathology, Klinikum Rechts der Isar, Technical University Munich, Munich, Germany
5Department of Radiation Oncology, Klinikum Rechts der Isar, Technical University Munich, Munich, Germany
Email: *astrid.grams@i-med.ac.at
Copyright © 2014 by authors and Scientific Research Publishing Inc.
This work is licensed under the Creative Commons Attribution International License (CC BY).
http://creativecommons.org/licenses/by/4.0/


Received 16 February 2014; revised 16 March 2014; accepted 23 March 2014
ABSTRACT
Purpose: Magnetic resonance imaging (MRI) is the gold standard in visualizing brain tumors and their effects on adjacent structures. However, no reliable information concerning different tumor components and borders between perifocal edema and infiltration areas can be received. The aim of the study was to establish and evaluate a multimodal imaging concept, in order to differentiate different biological tumor components and to determine tumor borders. Materials and Methods: 12 patients with cerebral gliomas (four low and eight high grade) received a “morphological” MRI, a 3D MR spectroscopy and a T2* MR perfusion examination prior to surgery. Data was evaluated by defining different tumor components, which were entitled based upon their multimodal characteristics and histological data. Results: In high grade gliomas different components can be differentiated, which were described as: “true edema”, “cellular proliferation”, “vascular proliferation”, “cellular infiltration”, “tumor” and “necrosis”. In low grade gliomas, four different tumor components were found: “true edema”, “cellular infiltration”, “cellular proliferation” and “tumor”. Conclusion: With the applied multimodal imaging and a novel evaluation concept, it was possible to detect different tumor components, which could be helpful in detecting the optimal sites for tumor biopsy. Especially in morphological “edema appearing” sites, this knowledge could be important for the adaption of tumor resection borders and the planning of radiation therapy. Further studies with more patients and histological correlation are needed.
Keywords:Glioma, Glioblastoma Multiforme, GBM, MR-Spectroscopy, MRS, Multimodal MRI

1. Introduction
Glioblastomas (GBM) are WHO grade IV gliomas and the most common and most aggressive primary brain tumors in adults with an incidence of 7 - 8/100,000 per year [1] . The mean survival time of patients with GBM accounts for 9 - 15 months without therapy [1] [2] . The incidence of low grade gliomas is less with 15% of all brain tumors. They exhibit an overall survival of ≥7 years [3] .
Magnetic resonance imaging (MRI) is accepted as the gold standard for morphological visualisation of brain tumors [4] , with which tumor size and its effects on the adjacent brain parenchyma can be evaluated. Contrast enhancement, necrosis and hemorrhage are indicators for a high tumor grade [5] . However, “morphological” MRI doesn’t provide reliable information about biological tumor heterogeneity or the determination of borders between perifocal edema and tumor infiltration zones as they both present with T2 hyperintense changes [4] .
Proton based MR-spectroscopy (MRS) can detect different brain metabolites: N-acetyl-aspartate (NAA) is a marker for neuronal density [6] ; a drop in concentration is a sign for loss of neuronal tissue. Choline (Cho) is a marker for increased cellular proliferation and metabolism. An increase in Cho can be an indicator for increased tumor mitosis [7] [8] . Creatine (Cr) is a quite constant cellular component [9] ; thus, Cho/Cr ratio is a frequently used metabolic marker. A ratio of >1.6 is assumed as tumor suspect and a cut off value between low and high grade gliomas is defined at about >2.3 with an accuracy of 79.8% [10] . It has been shown that with MRS different metabolic characteristics within T2 hyperintense areas and within normal appearing areas can be distinguished suggesting tumor heterogeneity [11] .
Cerebral blood volume (CBV) is an indicator for tissue perfusion and vessel density [12] . In cerebral gliomas, an increased CBV is found [11] [13] , a ratio >1.6 in comparison to the healthy hemisphere in the same region was determined as suspicious for tumor, a cut off value for high grade gliomas was defined at about 2.0 [13] . With the assumption of 2.91 as threshold value between low and high grade glioma, a sensitivity of 94.7 and a specificity of 93.75 were achieved for the differentiation between low and high grade gliomas [14] .
2. Methods
12 patients with cerebral gliomas were examined. Four had WHO Grade II, three Grade III and five Grade IV gliomas (Table 1). Tumor grade was ascertained by postoperative histological evaluation.
Written, informed consent was obtained prior to the scan and the study was accepted by the local ethics committee.
Preoperative MRI studies were performed with a 3 Tesla MRI scanner (Philips Medical Systems Nederland B.V.). The multimodal imaging concept included a “morphological” MRI study with an axial FLAIR sequence (TR: 1200 ms, TE: 140 ms, FOV: 230 × 230 mm, 30 slices, Voxel size: 0.9 × 0.9 × 4 mm3, acquisition time: 3:00 min) and a T1 weighted 3D MPRAGE sequence (TR: 9 ms, TE: 4 ms, FOV 240 × 240 × 160 mm, Voxel size: 1 mm3, acquisition time: 5:56 min); for spectroscopy a 3D CSI PRESS sequence (TR: 1669 ms, TE: 288 ms, FOV: 200 × 180 × 72, 12 mm isovoxel, acquisition time: 15:55 min) and for perfusion a 3D EPI sequence

Table 1. Numbers of different tumor grades and histologies.
(TR: 17 ms, TE: 8 ms, FOV: 230 × 184 mm, 30 slices voxel size: 2.88 mm × 2.88 mm × 3 mm, acquisition time: 1:19 min) were acquired.
Spectroscopy was planned on the FLAIR series covering the entire tumor-edema volume including parts of the healthy hemisphere (Figure 1(a)). For MRI analysis the images were transferred to a postprocessing workstation (Extended MR workspace, Philips Medical Systems Nederland B.V.) and evaluated with the software SpektroView (Philips Medical Systems Nederland B.V.) by use of residual water subtraction, apodization filtering and zero filling (Figure 1(b)). From the perfusion series colour coded CBV maps were calculated with the software Neuro Perfusion (Philips Medical Systems Nederland B.V.) as shown in Figure 1(c). Cho/Cr ratio, NAA-concentration and CBV were described as regional ratios in different tumor areas, in comparison to the healthy hemisphere (rCho/Cr, rNAA, rCBV).
Averages and standard deviations were calculated with the software Excel (Microsoft Office 2003). Two experienced neuroradiologists evaluated the data in consent concerning tumor heterogeneity by evaluating several regions of interest (ROIs) with the above mentioned methods in different morphological areas (solid appearing, edema appearing, contrast enhancing, necrotic appearing) concerning their qualities in the multimodal methods. With this method different groups within the tumors with different multimodal imaging characteristics were defined. During surgery some tissue samples were gathered according to imaging results and histological data was compared to the imaging results in some examples for low and high grade tumors by an experienced neuropathologist and a neuroradiologist with experience in neuropathology.
3. Results
Up to five areas per patient and overall 59 tumor areas were evaluable.
In low grade gliomas, four different tumor components could be described (Table 2):
In FLAIR hyperintense, “edema appearing” sites areas with normal rNAA, normal Cho/Cr ratio and decreased rCBV (a), and areas with decreased rNAA, tumor suspect increased Cho/Cr ratio and decreased rCBV (b) were found. Two tumor components were seen both in FLAIR hyperintense, “edema appearing” and in FLAIR inhomogeneous “tumor appearing” sites of low grade gliomas: areas with decreased rNAA, slightly increased Cho/Cr ratio and rCBV (c); and areas with decreased rNAA, tumor suspect increased Cho/Cr ratio and rCBV (d). By a comparison between imaging results and some histological stains of two patients with different grade II astrocytomas these different tumor components were considered (Figure 2).

Figure 1. Example of a high grade glioma: “Morphological” MRI (a) with 3D spectroscopy voxel; 3D MR spectroscopy (b) and rCBV (c). The arrows mark the regions of interest in this patient.
Table 2. Total number of different tumor components in low grade gliomas with characteristic rNAA, Cho/Cr ratio and rCBV values.
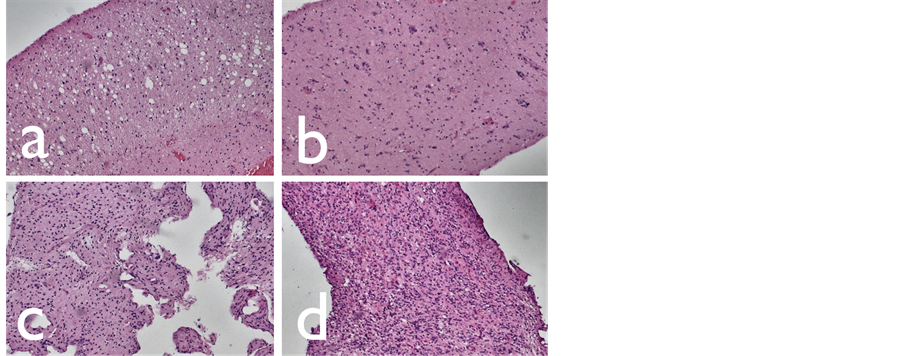
Figure 2. Hematoxylin-eosin stainings of low grade gliomas: edema (a), cellular infiltration (b), cellular proliferation (c), tumor (d).
Within the high grade gliomas six different tumor components could be delineated (Table 3): In FLAIR hyperintense, “edema appearing” sites areas with decreased rNAA, decreased Cho/Cr ratio and decreased rCBV (a), areas with normal rNAA, slightly increased Cho/Cr ratio but decreased rCBV (b), areas with increased rNAA, normal Cho/Cr ratio but tumor suspect increased rCBV (c) and areas with decreased rNAA, slightly increased Cho/Cr ratio and a tumor suspect increase in rCBV (d) were found. In FLAIR inhomogeneous or contrast enhancing “tumor appearing” sites of high grade gliomas areas with decreased rNAA, tumor suspect Cho/Cr ratio and rCBV (e) and areas with decreased rNAA, a tumor suspect increase in Cho/Cr ratio and with decreased rCBV (f) were seen. As in the low grade, the imaging results for high grade tumours were compared with histological results in some samples of glioblastomas and the existing tumor heterogeneity was confirmed with our findings of tumor heterogeneity in gliomas (Figure 3).
4. Discussion
The presented imaging and evaluation concept is able to indicate different tumor components in low and high grade gliomas.
In low grade gliomas, the areas “edema”, “cellular infiltration”, “cellular proliferation” and “tumor”, in high grade gliomas, the areas “edema”, “cellular infiltration”, “vascular proliferation”, “cellular proliferation”, “tumor” and “necrosis” were defined ...
Already in the early 1990s, MRS was described as a useful method for glioma imaging and differentiation to other processes [15] [16] by evaluating the metabolites Cho, Cr and NAA. In addition, it was shown that the metabolite lactate and lipids play a role in tumor grading [17] . MR-spectroscopy was shown to be able to distinguish gliomas from cerebral ischemia [18] or demyelinating lesions [19] , residual tumors from radiation necrosis
Table 3. Total number of different tumor components in high grade gliomas with characteristic rNAA, Cho/Cr ratio and rCBV values.

Figure 3. Hematoxylin-eosin stainings of high grade gliomas: edema (a), cellular proliferation (b), vascular proliferation (c), cellular infiltration (d), tumor (e), necrosis (f).
[20] or high grade glioma from metastatic disease [21] . In addition, a significant difference of Cho/Cr ratios between low and high grade gliomas was described [22] [23] . In low grade gliomas, areas with both high Cho/ NAA-ratio and contrast enhancement are assumed to be predictive for a tumor relapse after radiation therapy [24] . In addition, MRS was described to estimate prognosis by identifying aggressive tumor growth components in low grade gliomas [25] or more proliferative areas in high grade gliomas [11] .
With rCBV measurement, it is possible to differentiate between low and high grade oligodendrogliomas [26] and gliomas [13] [27] -[29] , between different tumor entities or between tumor and inflammation [13] [30] [31] . Furthermore, rCBV is used to differentiate between recurrent tumor and radionecrosis after radiation therapy [32] . Prior multimodal imaging approaches were already able to detect different tumor components: Di Costanzo et al. [11] described that low and high grade tumors edema, as well as edema and infiltration zone could be distinguished with a combination of MRS, perfusion weighted imaging (PWI) and diffusion weighted imaging (DWI). Furthermore perienhancing areas could be differentiated in “tumor” with high Cho/Cr ratio, low apparent diffusion coefficient (ADC) signal and high rCBV; “edema” with normal Cho/Cr ratio, high ADC signal and low rCBV; and “tumor/edema” with high Cho/Cr ratio and intermediate ADC signal and rCBV. In a multimodal study, comparing PWI and MRS areas with maximum increase of CBV were found to be different from the areas with maximum Cho/Cr ratio [33] , which underlines the present theory of differentiating “vascular proliferation” from “cellular infiltration or proliferation”. In addition, there are approaches for evaluation of multimodal MRI concerning the estimation of the risk of malignant transformation [34] . With a multimodal combination of MRS, PWI and DWI, an increase in sensitivity and specifity for diagnosis and differentiation of low and high grade gliomas could be achieved [35] . With a combination of MRS and PWI, an increase in sensitivity and specifity to the differentiation between tumor and therapy associated changes [36] . A combination of morphological MRI, MRS and PWI increased sensitivity and specifity for the prediction of areas with anaplastic transformation in low grade gliomas [34] and a combination of MRS, PWI and DWI increased sensitivity and specifity for the differentiation of tumor heterogeneity [11] .
There are new promising approaches using other than the mentioned metabolites such as glycine or myoinositol for glioma grading [37] or using MRS as a method for evaluate therapy response imgliomas [38] -[40] . In addition, the inclusion of other than the mentioned methods, such as diffusion weighted imaging seems to be a useful tool in tumor grading [41] .
Limitations of the present study are that data have only proven by some histological data. Further studies with a larger amount of patients and localized, serial biopsies have to further prove the underlying histology of the described tumor components. Better knowledge of tumor heterogeneity can be an option to individualize further diagnostic and therapeutic procedures such as the determination of optimal biopsy areas, the adaption of resection borders or “dose painting” at radiation borders.
References
- De Angelis, L.M. (2001) Brain Tumors. The New England Journal of Medicine, 344, 114-123. http://dx.doi.org/10.1056/NEJM200101113440207
- Stupp, R., Mason, W.P., van den Bent, M.J., et al. (2005) Radiotherapy plus Concomitant and Adjuvant Temozolomide for Glioblastoma. The New England Journal of Medicine, 352, 987-996. http://dx.doi.org/10.1056/NEJMoa043330
- Pouratian, N. and Schiff, D. (2010) Management of Low-Grade Glioma. Current Neurology and Neuroscience Reports, 10, 224-231. http://dx.doi.org/10.1007/s11910-010-0105-7
- Sartor, K. (1999) MR Imaging of the Brain: Tumors. European Radiology, 9, 1047-1054. http://dx.doi.org/10.1007/s003300050790
- Watanabe, M., Tanaka, R. and Takeda, N. (1992) Magnetic Resonance Imaging and Histopathology of Cerebral Gliomas. Neuroradiology, 34, 463-469. http://dx.doi.org/10.1007/BF00598951
- Simmons, M.L., Frondoza, C.G. and Coyle, J.T. (1991) Immunocytochemical Localization of N-Acetyl-Aspartate with Monoclonal Antibodies. Neuroscience, 45, 37-45. http://dx.doi.org/10.1016/0306-4522(91)90101-S
- Michaelis, T., Merboldt, K.D., Bruhn, H., et al. (1993) Absolute Concentrations of Metabolites in the Adult Human Brain in Vivo: Quantification of Localized Proton MR Spectra. Radiology, 187, 219-227.
- Herminghaus, S., Pilatus, U., Moller-Hartmann, W., et al. (2002) Increased Choline Levels Coincide with Enhanced Proliferative Activity of Human Neuroepithelial Brain Tumors. NMR in Biomedicine, 15, 385-392. http://dx.doi.org/10.1002/nbm.793
- Soares, D.P. and Law, M. (2009) Magnetic Resonance Spectroscopy of the Brain: Review of Metabolites and Clinical Applications. Clinical Radiology, 64, 12-21. http://dx.doi.org/10.1016/j.crad.2008.07.002
- Di Costanzo, A., Scarabino, T., Trojsi, F., et al. (2008) Proton MR Spectroscopy of Cerebral Gliomas at 3 T: Spatial Heterogeneity, and Tumour Grade and Extent. European Radiology, 18, 1727-1735. http://dx.doi.org/10.1007/s00330-008-0938-5
- Di Costanzo, A., Scarabino, T., Trojsi, F., et al. (2006) Multiparametric 3T MR Approach to the Assessment of Cerebral Gliomas: Tumor Extent and Malignancy. Neuroradiology, 48, 622-631. http://dx.doi.org/10.1007/s00234-006-0102-3
- Cha, S., Knopp, E.A., Johnson, G., et al. (2002) Intracranial Mass Lesions: Dynamic Contrast-Enhanced Susceptibility-Weighted Echo-Planar Perfusion MR Imaging. Radiology, 223, 11-29. http://dx.doi.org/10.1148/radiol.2231010594
- Hakyemez, B., Erdogan, C., Bolca, N., et al. (2006) Evaluation of Different Cerebral Mass Lesions by Perfusion-Weighted MR Imaging. Journal of Magnetic Resonance Imaging, 24, 817-824. http://dx.doi.org/10.1002/jmri.20707
- Arvinda, H.R., Kesavadas, C., Sarma, P.S., et al. (2009) Glioma Grading: Sensitivity, Specificity, Positive and Negative Predictive Values of Diffusion and Perfusion Imaging. Journal of Neuro-Oncology, 94, 87-96. http://dx.doi.org/10.1007/s11060-009-9807-6
- Arnold, D.L., Shoubridge, E.A., Villemure, J.G., et al. (1990) Proton and Phosphorus Magnetic Resonance Spectroscopy of Human Astrocytomas in Vivo. Preliminary Observations on Tumor Grading. NMR in Biomedicine, 3, 184-189. http://dx.doi.org/10.1002/nbm.1940030407
- Ott, D., Hennig, J. and Ernst, T. (1993) Human Brain Tumors: Assessment with in Vivo Proton MR Spectroscopy. Radiology, 186, 745-752.
- Yamasaki, F., Takaba, J., Ohtaki, M., Abe, N., Kajiwara, Y., Saito, T., Yoshioka, H., Hama, S., Akimitsu, T., Sugiyama, K., Arita, K. and Kurisu, K. (2005) Detection and Differentiation of Lactate and Lipids by Single-Voxel Proton MR Spectroscopy. Neurosurgical Review, 28, 267-277. http://dx.doi.org/10.1007/s10143-005-0398-1
- Felber, S.R. (1993) 1H Magnetic Resonance Spectroscopy in Intracranial Tumors and Cerebral Ischemia. Der Radiologe, 33, 626-632.
- De Stefano, N., Caramanos, Z., Preul, M.C., Francis, G., Antel, J.P. and Arnold, D.L. (1998) In Vivo Differentiation of Astrocytic Brain Tumors and Isolated Demyelinating Lesions of the Type Seen in Multiple Sclerosis Using 1H Magnetic Resonance Spectroscopic Imaging. Annals of Neurology, 44, 273-278. http://dx.doi.org/10.1002/ana.410440222
- Dowling, C., Bollen, A.W., Noworolski, S.M., McDermott, M.W., Barbaro, N.M., Day, M.R., Henry, R.G., Chang, S.M., Dillon, W.P., Nelson, S.J. and Vigneron, D.B. (2001) Preoperative Proton MR Spectroscopic Imaging of Brain tumors: Correlation with Histopathologic Analysis of Resection Specimens. AJNR. American Journal of Neuroradiology, 22, 604-612.
- Ishimaru, H., Morikawa, M., Iwanaga, S., Kaminogo, M., Ochi, M. and Hayashi, K. (2001) Differentiation between High-Grade Glioma and Metastatic Brain Tumor Using Single-Voxel Proton MR Spectroscopy. European Radiology, 11, 1784-1791. http://dx.doi.org/10.1007/s003300000814
- Chen, J., Huang, S.L., Li, T. and Chen, X.L. (2006) In Vivo Research in Astrocytoma Cell Proliferation with 1H-Magnetic Resonance Spectroscopy: Correlation with Histopathology and Immunohistochemistry. Neuroradiology, 48, 312- 318. http://dx.doi.org/10.1007/s00234-006-0066-3
- Shimizu, H., Kumabe, T., Tominaga, T., Kayama, T., Hara, K., Ono, Y., Sato, K., Arai, N., Fujiwara, S. and Yoshimoto, T. (1996) Noninvasive Evaluation of Malignancy of Brain Tumors with Proton MR Spectroscopy. AJNR. American Journal of Neuroradiology, 17, 737-747.
- Laprie, A., Catalaa, I., Cassol, E., et al. (2008) Proton Magnetic Resonance Spectroscopic Imaging in Newly Diagnosed Glioblastoma: Predictive Value for the Site of Postradiotherapy Relapse in a Prospective Longitudinal Study. International Journal of Radiation Oncology * Biology * Physics, 70, 773-781. http://dx.doi.org/10.1016/j.ijrobp.2007.10.039
- McKnight, T.R., Lamborn, K.R., Love, T.D., Berger, M.S., Chang, S., Dillon, W.P., Bollen, A. and Nelson, S.J. (2007) Correlation of Magnetic Resonance Spectroscopic and Growth Characteristics within Grades II and III Gliomas. Journal of Neurosurgery, 106, 660-666. http://dx.doi.org/10.3171/jns.2007.106.4.660
- Spampinato, M.V., Smith, J.K., Kwock, L., Ewend, M., Grimme, J.D., Camacho, D.L.A. and Castillo, M. (2007) Cerebral Blood Volume Measurements and Proton MR Spectroscopy in Grading of Oligodendroglial Tumors. AJR. American Journal of Roentgenology, 188, 204-212. http://dx.doi.org/10.2214/AJR.05.1177
- Hakyemez, B., Erdogan, C., Ercan, I., Ergin, N., Uysal, S. and Atahan, S. (2005) High-Grade and Low-Grade Gliomas: Differentiation by Using Perfusion MR Imaging. Clinical Radiology, 60, 493-502. http://dx.doi.org/10.1016/j.crad.2004.09.009
- Aronen, H.J. and Perkio, J. (2002) Dynamic Susceptibility Contrast MRI of Gliomas. Neuroimaging Clinics of North America, 12, 501-523. http://dx.doi.org/10.1016/S1052-5149(02)00026-6
- Ludemann, L., Grieger, W., Wurm, R., Budzisch, M., Hamm, B. and Zimmer, C. (2001) Comparison of Dynamic Contrast-Enhanced MRI with WHO Tumor Grading for Gliomas. European Radiology, 11, 1231-1241. http://dx.doi.org/10.1007/s003300000748
- Ludemann, L., Hamm, B. and Zimmer, C. (2000) Pharmacokinetic Analysis of Glioma Compartments with Dynamic Gd-DTPA-Enhanced Magnetic Resonance Imaging. Magnetic Resonance Imaging, 18, 1201-1214. http://dx.doi.org/10.1016/S0730-725X(00)00223-X
- Ludemann, L., Grieger, W., Wurm, R., et al. (2005) Quantitative Measurement of Leakage Volume and Permeability in Gliomas, Meningiomas and Brain Metastases with Dynamic Contrast-Enhanced MRI. Magnetic Resonance Imaging, 23, 833-841. http://dx.doi.org/10.1016/j.mri.2005.06.007
- Sugahara, T., Korogi, Y., Tomiguchi, S., Shigematsu, Y., Ikushima, I., Kira, T., Liang, L., Ushio, Y. and Takahashi, M. (2000) Posttherapeutic Intraaxial Brain Tumor: The Value of Perfusion-Sensitive Contrast-Enhanced MR Imaging for Differentiating Tumor Recurrence from Nonneoplastic Contrast-Enhancing Tissue. AJNR. American Journal of Neuroradiology, 21, 901-909.
- Wagner, M., Nafe, R., Jurcoane, A., Pilatus, U., Franz, K., Rieger, J., Steinbach, J.P. and Hattingen, E. (2011) Heterogeneity in Malignant Gliomas: A Magnetic Resonance Analysis of spatial Distribution of Metabolite Changes and Regional Blood Volume. Journal of Neuro-Oncology, 103, 663-672. http://dx.doi.org/10.1007/s11060-010-0443-y
- Hlaihel, C., Guilloton, L., Guyotat, J., Streichenberger, N., Honnorat, J. and Cotton, F. (2010) Predictive Value of Multimodality MRI Using Conventional, Perfusion, and Spectroscopy MR in Anaplastic Transformation of Low-Grade Oligodendrogliomas. Journal of Neuro-Oncology, 97, 73-80. http://dx.doi.org/10.1007/s11060-009-9991-4
- Chawalparit, O., Sangruchi, T., Witthiwej, T., Sathornsumetee, S., Tritrakarn, S., Piyapittayanan, S., Chaicharoen, P., Direksunthorn, T. and Charnchaowanish, P. (2013) Diagnostic Performance of Advanced MRI in Differentiating HighGrade from Low-Grade Gliomas in a Setting of Routine Service. Journal of the Medical Association of Thailand = Chotmaihet Thangphaet, 96, 1365-1373.
- Yang, I. and Aghi, M.K. (2009) New Advances that Enable Identification of Glioblastoma Recurrence. Nature Reviews Clinical Oncology, 6, 648-657. http://dx.doi.org/10.1038/nrclinonc.2009.150
- Candiota, A.P., Majos, C., Julia-Sape, M., Cabañas, M., Acebes, J.J., Moreno-Torres, A., Griffiths, J.R. and Arús, C. (2011) Non-Invasive Grading of Astrocytic Tumours from the Relative Contents of Myo-Inositol and Glycine Measured by in Vivo MRS. JBR-BTR, 94, 319-329.
- Kim, H., Catana, C., Ratai, E.M., Andronesi, O.C., Jennings, D.L., Batchelor, T.T., Jain, R.K. and Sorensen, A.G. (2011) Serial Magnetic Resonance Spectroscopy Reveals a Direct Metabolic Effect of Cediranib in Glioblastoma. Cancer Research, 71, 3745-3752. http://dx.doi.org/10.1158/0008-5472.CAN-10-2991
- Guillevin, R., Menuel, C., Taillibert, S., Capelle, L., Costalat, R., Abud, L., Habas, C., De Marco, G., Hoang-Xuan, K., Chiras, J. and Vallée, J.N. (2011) Predicting the Outcome of Grade II Glioma Treated with Temozolomide Using Proton Magnetic Resonance Spectroscopy. British Journal of Cancer, 104, 1854-1861. http://dx.doi.org/10.1038/bjc.2011.174
- Murphy, P.S., Viviers, L., Abson, C., Rowland, I.J., Brada, M., Leach, M.O. and Dzik-Jurasz, A.S.K. (2004) Monitoring Temozolomide Treatment of Low-Grade Glioma with Proton Magnetic Resonance Spectroscopy. British Journal of Cancer, 90, 781-786. http://dx.doi.org/10.1038/sj.bjc.6601593
- Zou, Q.G., Xu, H.B., Liu, F., Guo, W., Kong, X.C. and Wu, Y. (2011) In the Assessment of Supratentorial Glioma Grade: The Combined Role of Multivoxel Proton MR Spectroscopy and Diffusion Tensor Imaging. Clinical Radiology, 66, 953-960. http://dx.doi.org/10.1016/j.crad.2011.05.001
NOTES

*Corresponding author.