Journal of Power and Energy Engineering
Vol.05 No.02(2017), Article ID:74305,26 pages
10.4236/jpee.2017.52006
An Isothermal Study of the Electrochemical Performance of Intermediate Temperature Solid Oxide Fuel Cells
O. O. Ighodaro1,2*, K. Scott2, L. Xing3
1Department of Mechanical Engineering, University of Benin, Benin City, Nigeria
2School of Chemical Engineering and Advanced Materials, Newcastle University, Newcastle upon Tyne, UK
3School of Chemical Engineering, University of Birmingham, Birmingham, UK

Copyright © 2017 by authors and Scientific Research Publishing Inc.
This work is licensed under the Creative Commons Attribution International License (CC BY 4.0).
http://creativecommons.org/licenses/by/4.0/


Received: January 26, 2017; Accepted: February 20, 2017; Published: February 23, 2017
ABSTRACT
A two-dimensional along the channel micro-scale isothermal model of a SOFC is developed and validated against experimental data and other simulated results from literature. The steady state behaviour of the cell was determined by numerical solution of the combined transport, continuity and kinetic equations. An important characteristic of the model is the consideration of the triple phase boundary as a distinct layer. The model is capable of predicting the cell performance including polarisation behaviour and power output. The model is used to study the effect of the support structure, geometric parameters and the effect of operating conditions on cell performance. Several parametric studies include the effect of operating conditions and geometric parameters on cell performance with a view to optimising the cell. The simulation results showed that the anode supported SOFC displayed the best performance with the activation and ohmic overpotentials being responsible for most of the voltage losses in the cell.
Keywords:
Isothermal, Overpotential, Solid Oxide Fuel Cell, Anode Support

1. Introduction
Solid oxide fuel cells (SOFCs) are promising candidates for energy conversion systems because of their huge potentials for power generation in stationary, portable and transport applications and their high energy conversion efficiency when compared to other fuel cells [1] [2] [3] [4] . In addition, internal reforming of hydrocarbons can be carried out in the anode and they have significantly lower emissions of sulphur oxides, nitrogen oxides and carbon dioxide compared to conventional power generation devices [5] [6] [7] .
Although there have been significant advances with respect to development of new materials with improved properties and better fabrication processes in the last two decades [8] , some barriers still hamper the development and commercialisation of SOFCs. The high operating temperature is the major limiting factor to using SOFCs. In order to overcome this limitation and achieve stability and economy, recent efforts are geared towards intermediate temperature SOFCs (IT-SOFCs) [9] [10] ; these may be achieved by either reducing the thickness of the electrolyte which reduces its ohmic resistance [11] [12] [13] , developing new electrodes with improved catalytic activities which reduce overpotential [14] [15] [16] [17] or improving the electrode microstructure which increases the electrochemical reaction area [3] [18] [19] .
To compensate for the reduced cell performance associated with operating at intermediate temperatures through any of the three routes mentioned above, the use of thin film micro SOFCs is investigated [20] [21] [22] [23] . Amongst them, the technique of thin electrolyte is widely used for intermediate temperature SOFCs. Furthermore Yittra stabilised zirconia (YSZ) which is normally used as electrolyte for high temperature SOFCs can be used at intermediate temperatures by reducing its thickness.
Quite a number of existing micro models found in literature are modelled with the traditional SOFC geometric structure i.e. without the electrochemical reaction layers [3] [24] - [32] whereby the consumption and generation of gaseous species are carried out at the interfaces and the governing equations are coupled only by the boundary conditions. For micro-SOFCs modelled with a distinct reaction layer, the electrochemical active layers extend from the electrode/electrolyte interfaces to the reaction layer. The gaseous species are consumed and generated within the reaction layer and the governing equations are coupled not only by the boundary conditions but also by the source or sink terms. Consequently, it is only recently that a few authors are considering micro- SOFCs with distinct reaction layers in their models [33] [34] [35] [36] [37] .
This study investigates the electrochemical performance of an isothermal planar SOFC model by characterising the overpotentials. The concentration dependent Butler-Volmer equation is used in describing the activation and concentration overpotentials, with the exchange current densities dependent on the operating temperature. The ohmic overpotential depends of the thickness of the individual cell components while the ionic and electronic conductivities relate to the operating temperature. The cells electrochemical performance is used in comparing the performance of three different support structures and to study the effect of operating conditions and geometric parameters of the micro-scale SOFC model in which the reaction layer is modelled as a distinct layer.
2. Model Description
2.1. Computational Domain and Assumptions
A two-dimensional representation of the computational domain for the anode supported SOFC unit is shown in Figure 1, which includes the gas flow channels, gas diffusion layers and reaction layers on both the anode and cathode sides and a thin electrolyte layer sandwiched between the reaction layers. The model considers seven sub-domains; anode channel (ACH), anode diffusion layer (ADL), anode reaction layer (ARL), electrolyte, cathode reaction layer (CRL), cathode diffusion layer (CDL) and cathode channel (CCH). The ARL is composed of a mixture of equally sized Ni and YSZ particles while the CRL is made of a mixture of equally sized LSM and YSZ particles. The ADL is composed of Ni particles while the CDL is made up of LSM particles.
The simulation is carried out with the following assumptions:
・ The temperature and total pressure are constant and uniform throughout the cell.
・ Additional resistance due to the presence of interconnector are not considered.
・ The reactant gases at both the anode and cathode are introduced by plug flow.
・ Co-flow mode of reactant gases into the flow channels is applied.
・ The electrode layers are made up of binary spherical particles that are randomly packed.
・ The spherical particles are equal sizes.
・ The electrochemical reactions occur only in the reaction layers.
・ The flow in the channels is treated as laminar and incompressible.
・ No slip boundary condition is applied on the cell walls.
・ Species transport at channel outlet is by convective flux only.
2.2. Modelling Equations
The cell voltage of SOFC,  , is expressed as the combination of the open circuit voltage (OCV),
  , overall anode overpotential,
  , overall cathode overpotential,
  and the ohmic loss in the electrolyte,
 .
.
 (1)
(1)
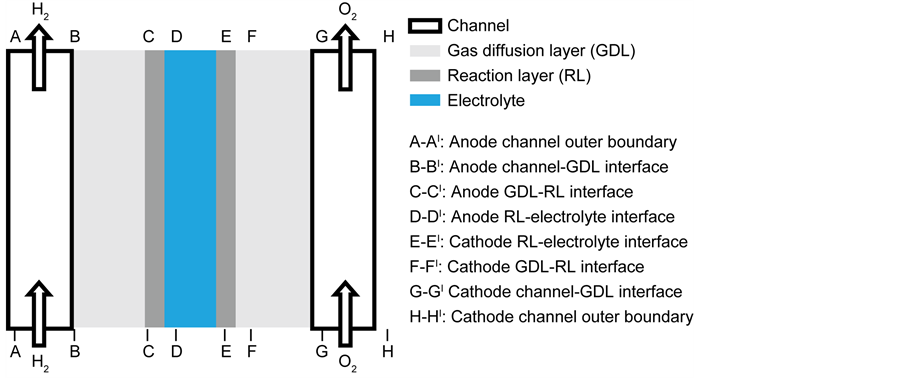
Figure 1. Computational domain and boundary conditions for SOFC model.
 (2)
(2)
 (3)
(3)
 (4)
(4)
where  is the resistance of the layer and
  the volumetric current density.
2.3. Electrochemical Reaction Kinetics
The volumetric current densities of both the anode and cathode are often represented by the non-linear Butler-Volmer equation. However, in SOFCs, the mass and charge transfer phenomena occur at comparable rates, thus the Butler- Volmer equations need to be corrected [38] , the corrected equations are given as:
 (5)
(5)
 (6)
(6)
where ,
,  and
and  are the reference concentrations of hydrogen, water and oxygen,
  is the number of electrons transferred in the single elementary rate limiting reaction step,
  is the actual reactive surface area per unit volume,
  the charge transfer coefficient and
  is the polarisation. The subscripts
  or
or  refers to the anode and cathode respectively. The electrochemical parameters used in the model are listed in Table 3.
The polarisation terms  expressed in Equation (1) are defined as
 (7)
(7)
 (8)
(8)
where  is the electronic phase potential,
  is the ionic phase potential and
  is the concentration polarisation. The electrochemical parameters used in developing the model are listed in Table 1.
The governing and constitutive equations for each layer used in developing this model are defined in Table 2 and Table 3 respectively. The developed model is based on the conservation of mass, species, momentum and electric charge coupled with the appropriate constitutive laws. The mass and species conservation equations solves for the molar diffusive fluxes of the species in the respective layers in which the modified Maxwell-Stefan equation including the Knudsen diffusion is used in calculating the diffusive flux. The momentum conservation which solves the Darcy-Brinkman equation sums the molar fluxes due to fluid flow. The conservation of charge solves the volumetric current density term, this is calculated by imposing  at the bottom of the ADL and
  at the top of the CDL.
Boundary conditions are applied at particular locations in the cell in order to solve the governing equations. These locations are illustrated in Figure 1. The external boundaries are treated as solid walls with no-slip conditions, the composition of the gaseous species are specified at channel inlets AI-BI and GI-HI.  at B-BI and
  at G-GI were imposed to calculate the electrical potential. The boundary conditions between the diffusion and reaction layers (C-CI and F-FI) are continuous flux for gaseous species and electronic potential but insulated for the ionic potential. At locations D-DI and E-EI between the reaction layers and electrolyte, diffusion flux and electronic current density are insulated while the ionic current density is continuous. The pressure at the inlet and outlet was set to ambient conditions at 1atm. The detailed boundary conditions are listed in Table 4.
3. Numerical Procedure
The finite element commercial software COMSOL Multiphysics (version 4.3a) is used to solve the non-linear system of governing equations and boundary conditions described above. The software is designed to solve sets of coupled algebraic and differential equations. The computational geometry consists of 333,742 degrees of freedom and 120,196 elements, the distance between each element is known as a step. At each step, the equations accounting for each phenomenon are fully coupled and computed as shown in the schematic in Figure 2. The convergence of the numerical solutions was judged by the relative tolerance criteria of 1 × 10⁻³.

Table 1. Electrochemical parameters.
Table 2. Governing equations.
Table 3. Constitutive equations and parameters used in the simulation.
Table 4. Boundary conditions.
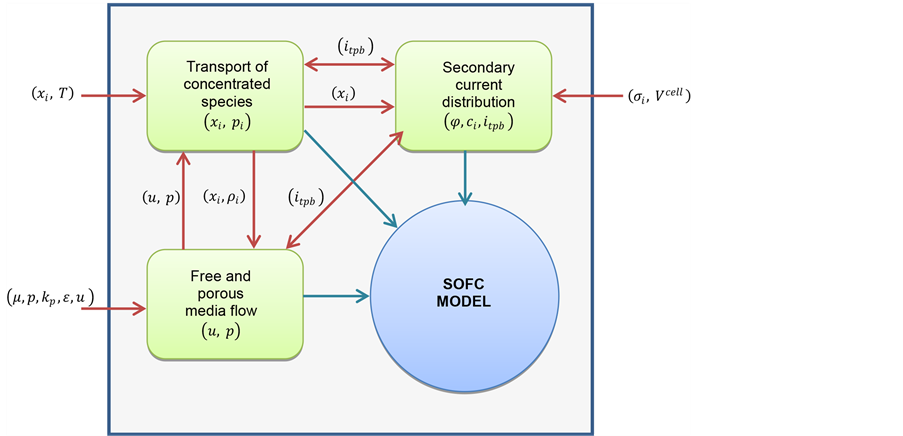
Figure 2. Schematic of computational process.
4. Cell Performance Validation
The range of validity and accuracy of the hydrogen fed, isothermal SOFC model is determined by comparing experimental data with the numerically developed cell performance result.
To carry out the validation, experimental data from the paper “Effect of cathode current-collecting layer on unit-cell performance of anode-supported solid oxide fuel cells” by Jung et al. [42] and the numerical simulation studies carried out by Jeon [36] titled “A comprehensive CFD model of anode-supported solid oxide fuel cells” is used.
Numerical Approach
Figure 3 compares this model simulation with that simulated by Jeon et al. [36] and that obtained from the above experimental data [42] at 1073 K. The parameters used for the model simulation are listed in Table 5. Most of the parameters used in validating the model were obtained from Jung et al. [42] , other parameters not provided by the experimental report were obtained from literature.
This present model predictions gives better agreement with the experimental results than those obtained by Jeon’s et al. model [36] . The tortuosity value is varied to obtain the best fit between the experimental results and those from the simulation.
5. Results and Discussion
The simulated model aims at analysing the electrochemical performance of the cell by studying the effect of design and operating conditions on the predicted SOFC performance under isothermal conditions. In order to characterise the cell’s performance, the overpotentials in the different components of the cell are first determined. The model predicts the activation and ohmic overpotential in the electrodes and electrolyte as well as the concentration overpotentials in the electrodes.
The role of support structures and the influence of key operating parameters on SOFC performance are investigated. Three basic support structure approaches
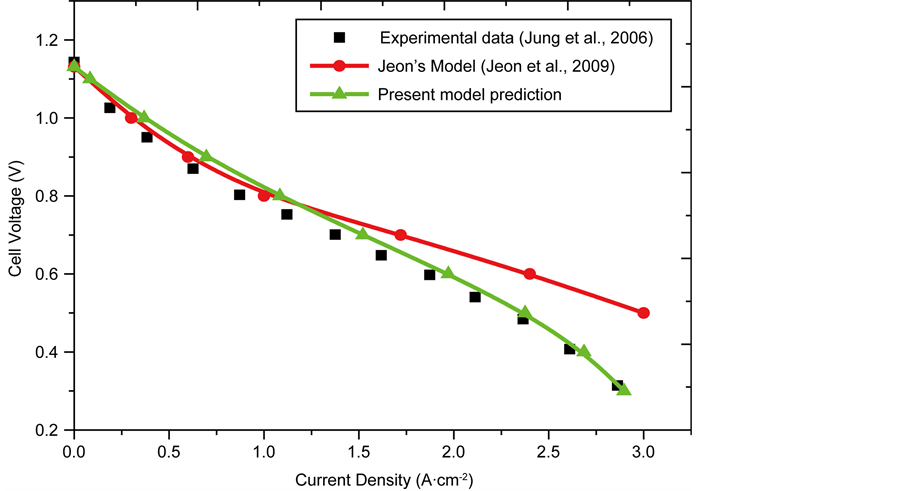
Figure 3. Comparison between model predictions and experimental results.
Table 5. Parameters used in validating the model.
are proposed in the development of planar SOFCs [39] : the anode-supported, cathode-supported and electrolyte supported SOFCs.
The results obtained from the 2-D simulation of the three support structures are presented initially. After which, parametric analysis on key design parameters is carried out.
5.1. Role of Support Structures
5.1.1. Anode-Supported SOFC
In the anode-supported SOFC, the anode is the thickness component, while the cathode and electrolyte are very thin. The thick anode layer helps in decreasing the ohmic resistance as thin electrolyte layers can now be used, this makes them more suited for operations at lower temperatures (873 - 1073 K) since the expected high ohmic overpotential at low temperatures will be minimised by the thin electrolyte layer. Due to the reduced operating temperatures, cheaper materials such as stainless steel can be used for the interconnectors instead of the expensive high chrome alloys or oxides, resulting in reduced material and manufacturing costs [34] .
The operating conditions and geometric parameters used in the simulation of the anode supported SOFC are listed in Table 6. The other design parameters used are listed in Table 1. The simulated performance of the anode supported cell is shown in Figure 4.
The performance characteristics of an anode-supported SOFC operating under isothermal conditions are shown in Figure 4. The figure illustrates the cell voltage and power density as a function of current density at 1073 K. The cell voltage decreases with increasing current density as a result of irreversible resistances (overpotentials) in the cell. The overpotentials are represented by the dashed lines in the figure. The overpotentials on the electrodes (anode and cathode) include activation overpotentials which is due to the resistance to the charge transfer reactions, concentration overpotentials which is due to the resistance to the flow of reactant species through the pores to the reaction sites and ohmic overpotentials due to the resistance to the flow of ions and electrons in the reaction layers and the resistance to the flow of electrons in the diffusion
Table 6. Base case parameters used in simulating an anode-supported SOFC.
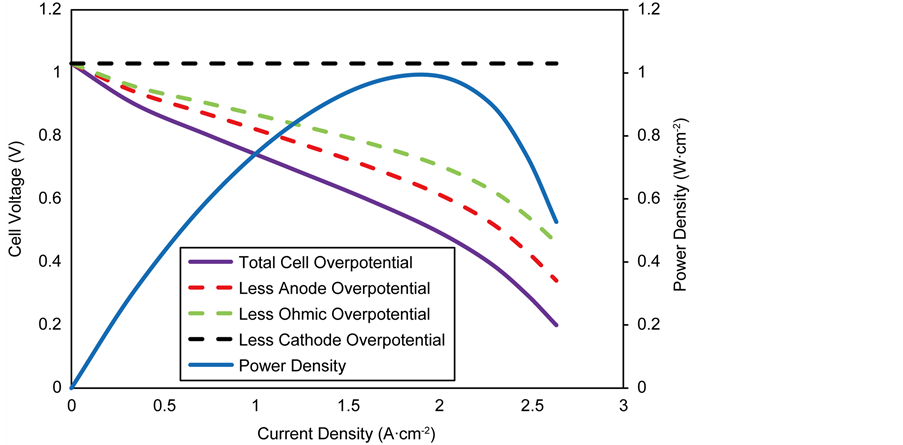
Figure 4. Base case performance of an anode-supported SOFC at 1073 K.
layers. The electrolyte ovepotential include only the ohmic overpotentials due to the resistance to the flow of ions in the electrolyte.
The power density is observed to increase to a maximum of 0.63 W∙cm−2 at a current density of 1.48 A∙cm−2 and a cell voltage of 0.44 V, after which it begins to decrease towards zero. SOFC’s are usually designed to operate at 0.7 V [43] thus based on Figure 4, the best operating point for the cell would be at current density of 0.9 A∙cm−2 leading to a power density of 0.58 W∙cm−2.
The activation overpotential is the single largest contributor to the overall anode overpotential, followed by the concentration overpotential which is due to the thick electrode diffusion layer. A thick electrode layer inhibits the diffusion process by slowing down the diffusion of H2 gas to the reaction sites which leads to a decrease in its partial pressure at the site. However, the generation of H2O at the reaction sites increases its partial pressure, leading to increased concentration overpotentials at high current densities. In contrast, the cathode concentration overpotential is negligible; this is due to the very thin cathode electrode layer. Nonetheless, the contributions of the activation overpotential is significantly higher than that on the anode due to its lower exchange current density and as a result of the sluggish resistance of the oxygen ion transfer reaction.
5.1.2. Cathode-Supported SOFC
In cathode-supported SOFCs, the cathode electrode layer is the thickest component while the other layers are very thin. Cathode supported cells are considered advantageous because of the reduced risk of carbon poisoning in thin anode layers when hydrocarbon fuel is used [44] , furthermore, the risk of Ni oxidation by water is reduced in thin anode layers [45] , in addition to the ohmic polarisation as a result of the thin electrolyte thickness.
The operating conditions and geometric parameters used in the simulation of the cathode supported SOFC are listed in Table 7. The other design parameters used are listed in Table 1. The simulated performance of the cathode supported cell is shown in Figure 9.
The performance of the cathode-supported SOFC is shown in Figure 5. The curve is seen to exhibit activation and concentration overpotential regions at low current densities and high current densities respectively. It can also be seen that the maximum power density obtained from the cathode-supported SOFC is 0.52 W∙cm−2, at a current density of 0.95 A∙cm−2. The most significant contributor to cell voltage loss is the cathode overpotential, which accounts for 66.7% of the total overpotential at current density of 1.00 A∙cm−2, the cathode concentration overpotential remains relatively small compared to the other overpotentials even though it is a cathode-supported cell.
5.1.3. Electrolyte-Supported SOFC
In electrolyte-supported SOFCs, the electrolyte is the thickest component while the other layers are very thin. The thick electrolyte layer usually results in high
Table 7. Base case parameters used in simulating a cathode-supported SOFC.
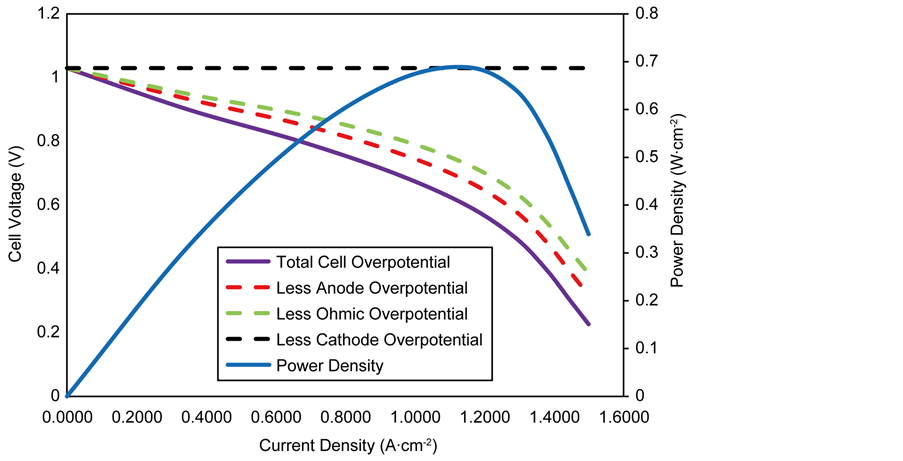
Figure 5. Base case performance of a Cathode-supported SOFC at 1073 K.
ohmic resistance. Thus, more effort is focussed on high temperature operation for electrolyte-supported SOFCs in a bid to reduce the ohmic resistance [39] .
The base case parameters used in simulating the electrolyte-supported SOFC are listed in Table 8, while other design parameters used are same as those used for the other support structure models and listed in Table 1.
The performance of the electrolyte supported SOFC is shown in Figure 6 illustrating the cell voltage and power density against the current density. It can be seen that the cell performance exhibits only ohmic overpotentials at regions of low and high current densities, indicating negligible contributions of activation and concentration overpotentials in electrolyte supported SOFC’s.
It is observed that the maximum power density obtained from an electrolyte supported SOFC operating at 1073 K is 0.048 W∙cm−2 at current density of 0.1 A∙cm−2. Furthermore, it can be seen that the largest contributor to cell voltage loss is the ohmic overpotential in the electrolyte; whereas the anode and cathode overpotentials are totally negligible in the overall cell performance.
The extremely high ohmic overpotential in the electrolyte which accounts for about 98.3% of the total cell overpotential can be attributed to the temperature dependent ionic conductivity in the electrolyte, hence the need to operate electrolyte-supported SOFC at high operating temperature so as to reduce the ionic conductivity and consequently the ohmic overpotential.
5.2. Performance Comparison with Different Support Structures
Figure 7 shows the performance comparison with the different support structures (anode, cathode and electrolyte supported). As seen in the figure, the anode-supported SOFC’s performance is much better than those of the cathode- supported and electrolyte supported. The anode supported cell has higher power densities and its current density range is wider than the others, this implies that
Table 8. Base case parameters used in simulating an electrolyte-supported SOFC.
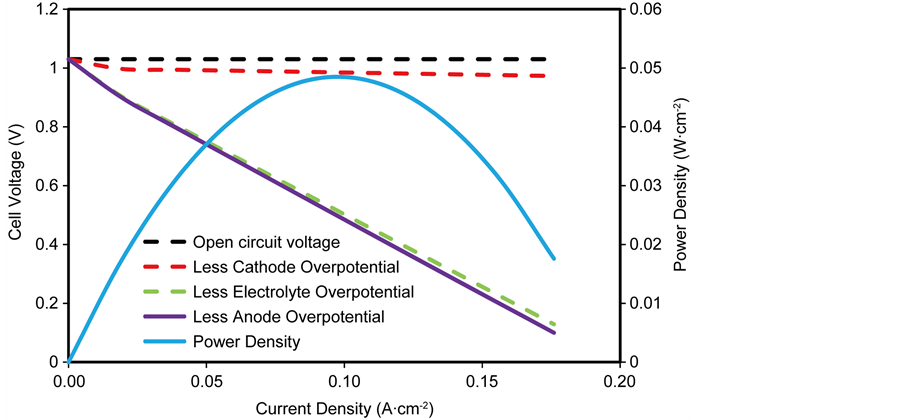
Figure 6. Base case performance of an electrolyte-supported SOFC.
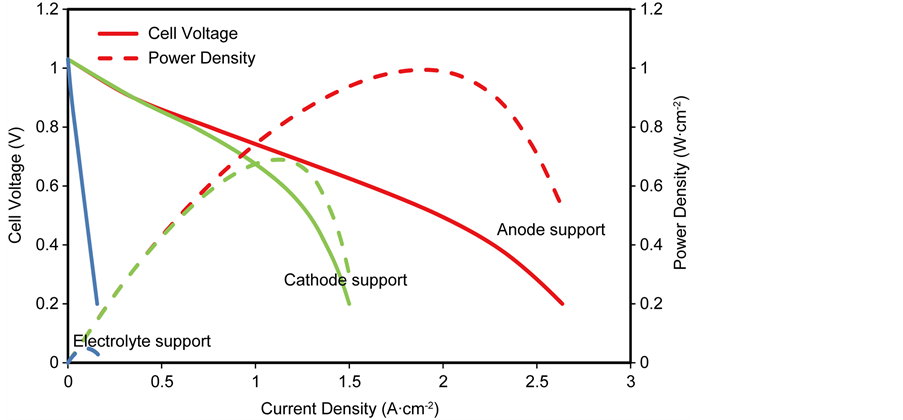
Figure 7. Performance comparison of the different support structures.
a smaller cell area will be required compared to the others with the subsequent reduction in manufacturing cost.
From simulation results expressed in Figure 7, it can be seen that the electrode-supported SOFCs displays better performance than electrolyte supported, in addition, the electrolyte-supported SOFCs are usually operated at high operating temperature in other to reduce its high ohmic overpotentials which consequently means it requires expensive alloys as interconnectors, thereby increasing material and manufacturing cost. On the other hand, the anode supported SOFCs exhibits the best performance at reduced operating temperature. Operating SOFC’s at reduced temperature allows many of the material-related problems to be resolved. Thus, anode supported design of SOFCs holds more potentials for the commercialisation process for planar SOFCs. Therefore, the next section further investigates the effect of key geometric and operating parameters on the performance of an anode-supported SOFC.
5.3. Parametric Studies
A parametric analysis is carried out in order to investigate the sensitivity of the simulated model, this is done by studying the effect of varying operating conditions and geometric features on the performance of the simulated model.
5.3.1. Effect of Temperature
The characteristic curve of cell voltage and power density for an anode supported SOFC at different operating temperatures is shown in Figure 8. Anode supported SOFCs are usually operated at temperatures between 873 K and 1073 K, described as the intermediate temperature operation, as such, this temperature range will be used in examining its effect on cell performance. Furthermore, all other operating and design conditions used in the simulation are kept constant in accordance to the base parameters.
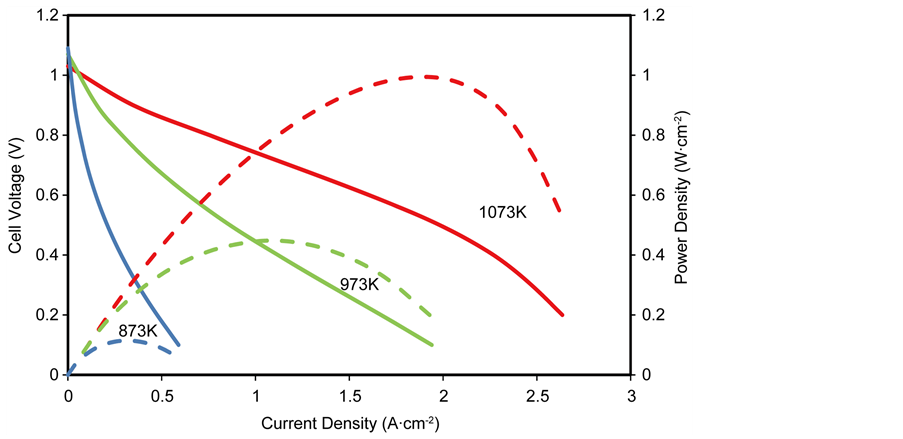
Figure 8. Effect of inlet operating temperature on cell performance.
It is seen that the cell performance improves significantly when the operating temperature is increased, with the maximum power density increasing from 0.049 W∙cm−2 at 873 K (at a current density of 0.1 A∙cm−2 and a cell voltage of 0.5 V) to 0.51 W∙cm−2 at 973 K (at a current density of 0.55 A∙cm−2 and a cell voltage of 0.55 V) and to 0.63 W∙cm−2 at 1073 K (at a current density of 1.35 A∙cm−2 and a cell voltage of 0.51 V). The increasing operating temperature leads to a reduction of the open circuit voltage (i.e. the cell voltage at zero current density) and increases the limiting current density (i.e. the current density at zero cell voltage).
The improved cell performance at increased operating temperature is not only due to the enhanced rate of electrochemical reaction at the reaction sites, but also due to the effect of temperature dependence of the individual overpotentials in the cell as shown in Figures 9(a)-(c).
The ohmic polarisation is temperature dependent due to the thermally activated dependence of the YSZ ionic conductivity in both the electrode reaction layers and the electrolyte; as a result, the higher the temperature, the higher the conductivity which in turn reduces the ohmic overpotentials and consequently improves cell performance as shown in Figure 9(c).

 (a) (b)
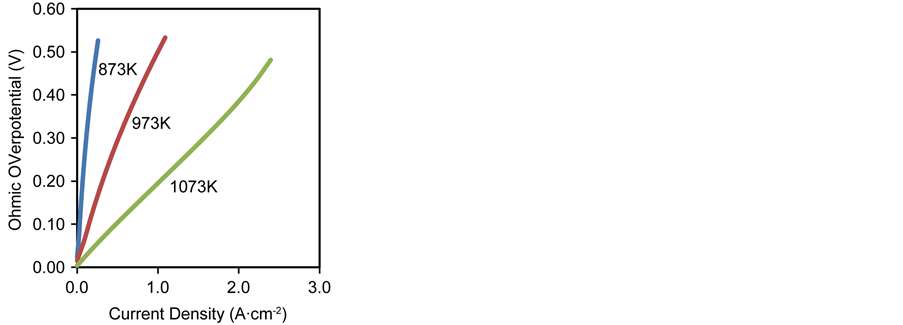 (c)
(c)
Figure 9. Effect of inlet operating temperature on (a) activation overpotential (b) concentration overpotential (c) ohmic overpotential.
The activation overpotential is also thermally activated, this is reflected in the exchange current density which is temperature dependent, as such the higher the operating temperature, the lower the activation overpotential. This reduces the contribution of the activation overpotential to the overall cell overpotential which in turn improves cell performance, this is shown in Figure 9(a).
On the other hand, the concentration overpotential is weakly dependent on the operating temperature; this is reflected through the temperature dependence of the partial pressures of the reactant gases H2 and O2 at the reaction sites as well as through the effective diffusivities. The binary diffusion coefficients are proportional to  using the Chapman-Enskogg relationship (see Table 1) this reduces the resistance to mass transport in the thick anode and therefore slightly increases the concentration overpotential with increasing temperature as seen in Figure 9(b).
Thus, the improvement on cell performance of the anode-supported SOFC at increasing temperature is primarily due to the reduced ohmic and activation overpotentials.
As earlier discussed, there are many advantages to reducing the operating temperature of SOFCs in terms of cost and ease of manufacturing, however, a reduction in cell performance is reported when this is done, thus the need to enhance the ionic conductivity in the electrodes and electrolyte in order to effectively operate SOFCs below 1073 K.
5.3.2. Effect of Pressure
The effect of operating pressure on cell voltage and power density is shown in Figure 10, in which the operating pressure is varied from 0.5 atm to 3 atm while all other operating and design parameters are kept at base conditions.
It is observed from Figure 10 that increasing the operating pressure improves the performance of the anode-supported SOFC, this is due to increased reactant concentration at the reaction sites as a result of the ease with which the fuel and oxidant diffuses, this subsequently increases the rate of electrochemical reaction
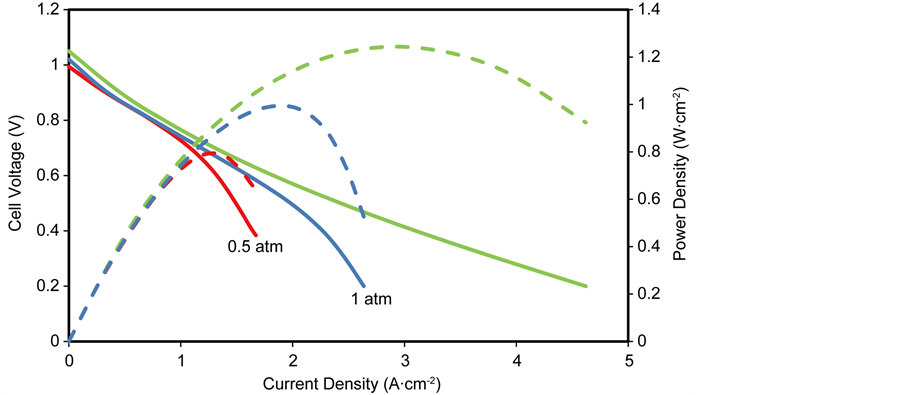
Figure 10. Effect of operating pressure on cell performance.
and rate of mass transport, resulting in reduced concentration overpotential hence enhanced cell performance. Also, at high operating pressures, the open circuit voltage increases, resulting in the minimisation of the activation overpotential which also results in improved cell performance.
Increasing the operating pressure of anode-supported SOFCs may seem a viable option to increasing its performance, however it also results in a number of constraints such as material selection limitations, gas sealing problems and issues with mechanical strength [1] ; these have to be taken into consideration before increased pressure could be an option.
5.4. Effect of SOFC Geometric Parameters on Overpotentials
The impact of the individual cell component thickness on overpotential is analysed here. Figure 11 shows the variation of the anode side overpotential with the ARL thickness (Larl) at 0.7V when all the other geometric parameters are kept constant. Significant reduction in anode overpotential is observed when Larl is increased from 5 µm to 14 µm, this may be attributed to the increase in the reactive surface area, which enhances the electrochemical reaction rate and consequently reduces the overpotential. However, the anode overpotential is seen to increase with further increases in the ARL thickness. This is due to the increase in concentration and ohmic polarisation which sets in due to the thicker ARL. Also, at thicker diffusion layers, a reduction in concentration of the species are expected, this leads to higher activation polarisation. Thus the optimum thickness of the ARL is set at 14 µm.
The relationship between anode overpotential and the anode diffusion layer thickness (Ladl) is presented in Figure 12 for diffusion layer thickness ranging between 500 and 3000 µm while all the other geometric parameters are kept constant. The profound effect of the thickness on polarisation is clearly seen in Figure 11. Increased thickness increases the resistance of the gaseous species through the diffusion layer resulting in increased concentration polarisation. It is thus important to make the layer as thin as possible, although from the view
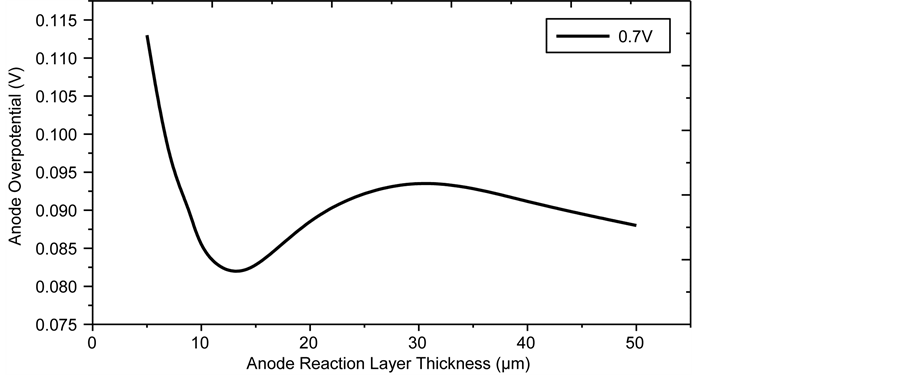
Figure 11. Effect of Anode reaction layer thickness on anode overpotential.
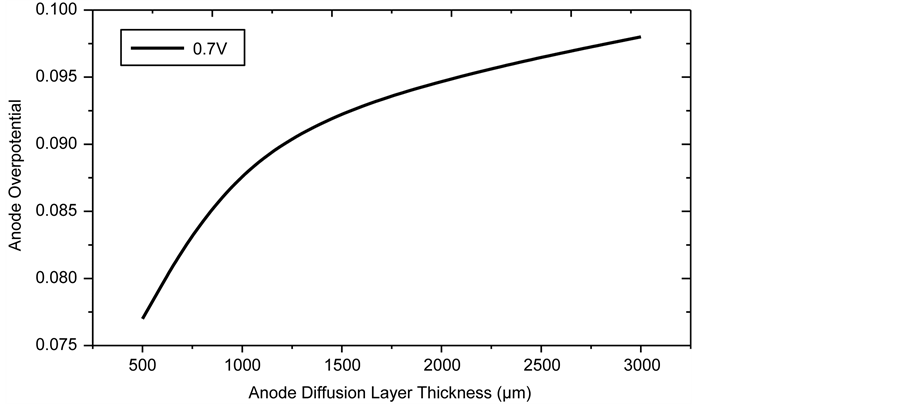
Figure 12. Effect of Anode diffusion layer thickness on anode overpotential.
point of cell support and mechanical ruggedness, the lower limit of 500 µm is suitable.
The cathode overpotential is probably the most important component of the total SOFC overpotential as it accounts for about 60% of the total overpotential at large current densities (see Figure 4). The CRL thickness is an important factor affecting the overpotential. Figure 13 shows the variation of the cathode overpotential with the CRL thickness (Lcrl). A reduction in the overpotential is observed when the Lcrl is increased from 5 to 10 µm, further increases in LCRL increases the overpotential. This is because of an increase in the activation overpotential resulting from the reduced concentration of O2 at the layer and the increased ohmic overpotential due to the thicker layer. Therefore, the optimum Lcrl is set at 10 µm.
Figure 14 shows the effect on cathode overpotential of cathode diffusion layer thickness between 20 and 200 µm, increasing the thickness does not have any significant effect on overpotential as it remains constant, based on the insignificant contribution of concentration overpotential even at the higher limit of 200 µm. The optimum thickness is arbitrarily set at 85 µm.
The impact of electrolyte thickness on the electrolyte overpotential is presented in Figure 15. The electrolyte thickness is varied from 5 - 50 µm while all other geometric parameters are kept constant. The profound effect of electrolyte layer thickness on the overpotential is clearly seen. This is due to the increased ohmic overpotential as the thickness is increased, thus making the electrolyte layer as thin as possible is important, although from the viewpoint of ease of fabrication, probably the lower limit is about 10 µm.
5.5. The Optimised Cell
A comparison of the base case simulated cell and the optimised cell based on geometric parameters is presented in Figure 16. The optimised geometric parameters are tabulated in Table 9.

Figure 13. Effect of cathode reaction layer thickness on cathode overpotential.
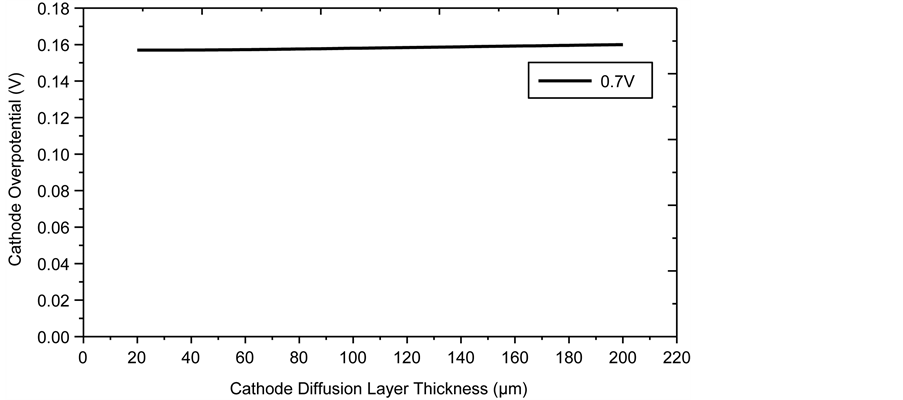
Figure 14. Effect of cathode diffusion layer thickness on cathode overpotential.
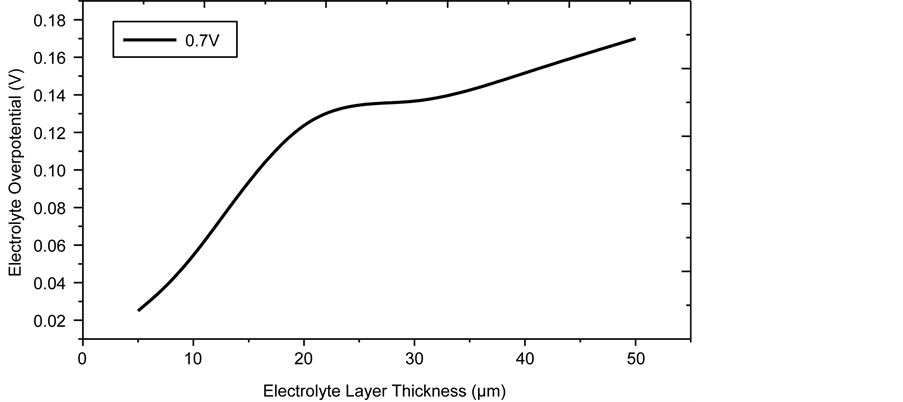
Figure 15. Effect of electrolyte layer thickness on electrolyte overpotential.
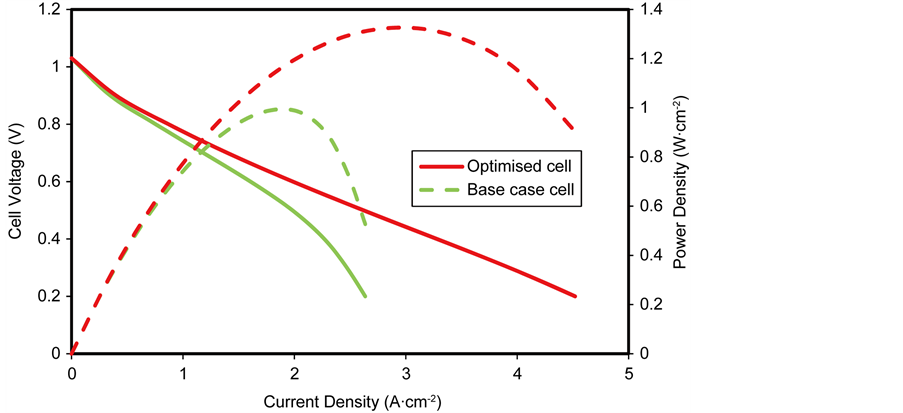
Figure 16. Performance comparison of optimised cell and base case cell.
Table 9. Optimised geometric parameters used in simulating an anode-supported SOFC.
The optimised cell exhibits a maximum power density of 1.32 W∙cm−2 while that of the base case simulated cell exhibited a maximum power density of 0.99 W∙cm−2, signifying a 20% reduction in the total cell overpotential compared to the base case at a current density of 2.4 A∙cm−2. However, it should be noted that it was only the geometric parameters that were varied to optimise the cell. Clearly further performance gains are to be expected when the microstructural parameters are varied.
6. Conclusions
The solution obtained from the numerical implementation of the two-dimen- sional, along the channel, microscale, steady state, isothermal SOFC model is presented. The electrochemical model is first validated with measured experimental data and simulated data published in literature by measuring the cell performance. The developed model is then used to predict the performance of three different support structures, namely anode-supported, cathode supported and electrolyte supported. At intermediate temperature conditions, it was found that the anode supported SOFC exhibits the best electrical performance amongst all three support structures.
Considering the individual cell voltage losses, for the anode-supported SOFC, it was found that the cathode ohmic overpotential was the single largest contributor, followed by the cathode activation and the electrolyte ohmic overpotentials. On the other hand, the cathode activation overpotential is the largest contributor in the cathode-supported SOFC while the electrolyte ohmic overpotential was the overwhelming largest contributor for the electrolyte supported SOFC, accounting for 98% of the total cell overpotential.
Following, the two-dimensional anode-supported SOFC developed was used to examine the effect of key operating condition and design conditions on the performance of cell, with the aim of probing the robustness of the model as an optimisation tool. It was found that reducing the operating temperature of the model below 1073 K results in a significant drop in the SOFC performance while at the same time reducing the material cost and ease of manufacturing. Increasing the operating pressure was observed to increase the SOFC performance considerably; however a number of constraints such as material selection and mechanical rigidity could limit this. In addition, the effect of varying geometric parameters on SOFC performance was studied; it was found that the individual layer thickness has profound effect on the overpotentials. Optimum values were obtained for each layer thickness with a view to optimising the cell.
Finally, the optimised layer thicknesses obtained were then used to simulate the optimised SOFC performance. It was found that the optimised cell was considerably better than the base case cell accounting for a 20% reduction in the overall cell overpotential.
Cite this paper
Ighodaro, O.O., Scott, K. and Xing, L. (2017) An Isothermal Study of the Electrochemical Performance of Intermediate Temperature Solid Oxide Fuel Cells. Journal of Power and Energy Engineering, 5, 97-122. https://doi.org/10.4236/jpee.2017.52006
References
- 1. Singhal, S.C. and Kendall, K. (2003) High-Temperature Solid Oxide Fuel Cells: Fundamentals, Design, and Applications. Elsevier Advanced Technology, New York, 16, 405 p.
- 2. Larminie, J. and Dicks, A. (2003) Fuel Cell Systems Explained. 2nd Edition, Wiley, Chichester, 22, 406 p.
https://doi.org/10.1002/9781118878330 - 3. Chinda, P., Chanchaona, S., Brault, P. and Wechsatol, W. (2010) Mathematical Modelling of a Solid Oxide Fuel Cell with Nearly Spherical Shaped Electrode Particles. Journal of Sustainable Energy and Environment, 1, 181-184.
- 4. Dyer, C.K. (1999) Replacing the Battery in Portable Electronics. Scientific American, 281, 88-93.
https://doi.org/10.1038/scientificamerican0799-88 - 5. Andersson, M., Yuan, J. and Sundén, B. (2012) SOFC Modeling Considering Electrochemical Reactions at the Active Three Phase Boundaries. International Journal of Heat and Mass Transfer, 55, 773-788.
https://doi.org/10.1016/j.ijheatmasstransfer.2011.10.032 - 6. Staniforth, J. and Ormerod, R.M. (2002) Implications for Using Biogas as a Fuel Source for Solid Oxide Fuel Cells: Internal Dry Reforming in a Small Tubular Solid Oxide Fuel Cell. Catalysis Letters, 81, 19-23.
https://doi.org/10.1023/A:1016000519280 - 7. Yakabe, H., Ogiwara, T., Hishinuma, M. and Yasuda, I. (2001) 3-D Model Calculation for Planar SOFC. Journal of Power Sources, 102, 144-154.
https://doi.org/10.1016/S0378-7753(01)00792-3 - 8. Ormerod, R.C. (2003) Solid Oxide Fuel Cells. Chemical Society Reviews, 32, 17-28.
https://doi.org/10.1039/b105764m - 9. Brett, D.J.L., Atkinson, A., Brandon, N.P. and Skinner, S.J. (2008) Intermediate Temperature Solid Oxide Fuel Cells. Chemical Society Reviews, 37, 1568-1578.
https://doi.org/10.1039/b612060c - 10. Ralph, J.M., Schoeler, A.C. and Krumpelt, M. (2001) Materials for Lower Temperature Solid Oxide Fuel Cells. Journal of Materials Science, 36, 1161-1172.
https://doi.org/10.1023/A:1004881825710 - 11. Yuan, J., Rokni, M. and Sunden, B. (2003) Three Dimensional Computational Analysis of Gas and Heat Transport Phenomena in Ducts Relevant for Anode Supported Solid Oxide Fuel Cells. International Journal of Heat and Mass Transfer, 46, 809-821.
https://doi.org/10.1016/S0017-9310(02)00357-5 - 12. Yuan, J. and Sundén, B. (2005) Analysis of Intermediate Temperature Solid Oxide Fuel Cell Transport Processes and Performance. Journal of Heat Transfer, 127, 1380-1390.
https://doi.org/10.1115/1.2098847 - 13. Steele, B.C.H. and Heinzel, A. (2001) Materials for Fuel-Cell Technologies. Nature, 414, 345-352.
https://doi.org/10.1038/35104620 - 14. Huang, K., Wan, J.-H. and Goodenough, J.B. (2001) Increasing Power Density of LSGM-Based Solid Oxide Fuel Cells Using New Anode Materials. Journal of the Electrochemical Society, 148, A788-A794.
https://doi.org/10.1149/1.1378289 - 15. Murray, E.P., Tsai, T. and Barnett, S.A. (1999) A Direct-Methane Fuel Cell with a Ceria-Based Anode. Nature, 400, 649-651.
https://doi.org/10.1038/23220 - 16. Huijsmans, J.P.P., van Berkel, F. and Christie, G.M. (1998) Intermediate Temperature SOFC— A Promise for the 21st Century. Journal of Power Sources, 71, 107-110.
https://doi.org/10.1016/S0378-7753(97)02789-4 - 17. Sun, C. and Stimming, U. (2007) Recent Anode Advances in Solid Oxide Fuel Cells. Journal of Power Sources, 171, 247-260.
https://doi.org/10.1016/j.jpowsour.2007.06.086 - 18. McIntosh, S. and Gorte, R.J. (2004) Direct Hydrocarbon Solid Oxide Fuel Cells. Chemical Reviews, 104, 4845-4866.
https://doi.org/10.1021/cr020725g - 19. Peters, C., Weber, A. and Ivers-Tiffée, E. (2008) Nanoscaled (La0.5Sr0.5)CoO3-δ Thin Film Cathodes for SOFC Application at 500℃ < T< 700℃. Journal of the Electrochemical Society, 155, B730-B737.
https://doi.org/10.1149/1.2909552 - 20. Takagi, Y., Lai, B.-K., Kerman, K. and Ramanathan, S. (2011) Low Temperature Thin Film Solid Oxide Fuel Cells with Nanoporous Ruthenium Anodes for Direct Methane Operation. Energy & Environmental Science, 4, 3473-3478.
https://doi.org/10.1039/c1ee01310f - 21. Kwon, C.-W., Son, J.-W., Lee, J.-H., Kim, H.-M., Lee, H.-W. and Kim, K.-B. (2011) High-Performance Micro-Solid Oxide Fuel Cells Fabricated on Nanoporous Anodic Aluminum Oxide Templates. Advanced Functional Materials, 21, 1154-1159.
https://doi.org/10.1002/adfm.201002137 - 22. Ko, C., Kerman, K. and Ramanathan, S. (2012) Ultra-Thin Film Solid Oxide Fuel Cells Utilising Undoped Nanostructured Zirconia Electrolytes. Journal of Power Sources, 213, 343-349.
https://doi.org/10.1016/j.jpowsour.2012.04.034 - 23. Chen, X., Wu, N.J., Smith, L. and Ignatiev, A. (2004) Thin-Film Heterostructure Solid Oxide Fuel Cells. Applied Physics Letters, 84, 2700-2702.
https://doi.org/10.1063/1.1697623 - 24. Khaleel, M.A., Lin, Z., Singh, P., Surdoval, W. and Collin, D. (2004) A Finite Element Analysis Modeling Tool for Solid Oxide Fuel Cell Development: Coupled Electrochemistry, Thermal and Flow Analysis in MARC. Journal of Power Sources, 130, 136-148.
https://doi.org/10.1016/j.jpowsour.2003.11.074 - 25. Nam, J.H. and Jeon, D.H. (2006) A Comprehensive Micro-Scale Model for Transport and Reaction in Intermediate Temperature Solid Oxide Fuel Cells. Electrochimica Acta, 51, 3446-3460.
https://doi.org/10.1016/j.electacta.2005.09.041 - 26. Chan, S.H., Chen, X.J. and Khor, K.A. (2004) Cathode Micromodel of Solid Oxide Fuel Cell. Journal of the Electrochemical Society, 151, A164-A172.
https://doi.org/10.1149/1.1630036 - 27. Ota, T., Koyama, M., Wen, C., Yamada, K. and Takahashi, H. (2003) Object-Based Modeling of SOFC System: Dynamic Behavior of Micro-Tube SOFC. Journal of Power Sources, 118, 430-439.
https://doi.org/10.1016/S0378-7753(03)00109-5 - 28. Ni, M., Leung, M.K.H. and Leung, D.Y.C. (2007) Micro-Scale Modeling of a Functionally Graded Ni-YSZ Anode. Chemical Engineering & Technology, 30, 587-592.
https://doi.org/10.1002/ceat.200600385 - 29. Costamagna, P., Costa, P. and Antonucci, V. (1998) Micro-Modelling of Solid Oxide Fuel Cell Electrodes. Electrochimica Acta, 43, 375-394.
https://doi.org/10.1016/S0013-4686(97)00063-7 - 30. Lin, Z., Stevenson, J.W. and Khaleel, M.A. (2003) The Effect of Interconnect Rib Size on the Fuel Cell Concentration Polarization in Planar SOFCs. Journal of Power Sources, 117, 92-97.
https://doi.org/10.1016/S0378-7753(02)00726-7 - 31. Liu, S., Song, C. and Lin, Z. (2008) The Effects of the Interconnect Rib Contact Resistance on the Performance of Planar Solid Oxide Fuel Cell Stack and the Rib Design Optimization. Journal of Power Sources, 183, 214-225.
https://doi.org/10.1016/j.jpowsour.2008.04.054 - 32. Golbert, J., Adjiman, C.S. and Brandon, N.P. (2008) Microstructural Modeling of Solid Oxide Fuel Cell Anodes. Industrial & Engineering Chemistry Research, 47, 7693-7699.
https://doi.org/10.1021/ie800065w - 33. Liu, S., Kong, W. and Lin, Z. (2009) A Microscale Modeling Tool for the Design and Optimisation of Solid Oxide Fuel Cells. Energies, 2, 427-444.
https://doi.org/10.3390/en20200427 - 34. Hussain, M.M., Li, X. and Dincer, I. (2006) Mathematical Modeling of Planar Solid Oxide Fuel Cells. Journal of Power Sources, 161, 1012-1022.
https://doi.org/10.1016/j.jpowsour.2006.05.055 - 35. Ho, T.X., et al. (2009) Numerical Analysis of a Planar Anode-Supported SOFC with Composite Electrodes. International Journal of Hydrogen Energy, 34, 3488-3499.
https://doi.org/10.1016/j.ijhydene.2009.02.016 - 36. Jeon, D.H. (2009) A Comprehensive CFD Model of Anode-Supported Solid Oxide Fuel Cells. Electrochimica Acta, 54, 2727-2736.
https://doi.org/10.1016/j.electacta.2008.11.048 - 37. Kenney, B. and Karan, K. (2007) Engineering of Microstructure and Design of a Planar Porous Composite SOFC Cathode: A Numerical Analysis. Solid State Ionics, 178, 297-306.
https://doi.org/10.1016/j.ssi.2006.12.009 - 38. Aguiar, P., Adjiman, C.S. and Brandon, N.P. (2004) Anode-Supported Intermediate Temperature Direct Internal Reforming Solid Oxide Fuel Cell. I: Model-Based Steady-State Performance. Journal of Power Sources, 138, 120-136.
https://doi.org/10.1016/j.jpowsour.2004.06.040 - 39. Patcharavorachot, Y., Arpornwichanop, A. and Chuachuensuk, A. (2008) Electrochemical Study of a Planar Solid Oxide Fuel Cell: Role of Support Structures. Journal of Power Sources, 177, 254-261.
https://doi.org/10.1016/j.jpowsour.2007.11.079 - 40. Todd, B. and Young, J.B. (2002) Thermodynamic and Transport Properties of Gases for Use in Solid Oxide Fuel Cell Modelling. Journal of Power Sources, 110, 186-200.
https://doi.org/10.1016/S0378-7753(02)00277-X - 41. Jeon, D.H., Nam, J.H. and Kim, C.-J. (2006) Microstructural Optimization of Anode-Supported Solid Oxide Fuel Cells by a Comprehensive Microscale Model. Journal of the Electrochemical Society, 153, A406-A417.
https://doi.org/10.1149/1.2139954 - 42. Jung, H.Y., et al. (2006) Effect of Cathode Current-Collecting Layer on Unit-Cell Performance of Anode-Supported Solid Oxide Fuel Cells. Journal of Power Sources, 155, 145-151.
https://doi.org/10.1016/j.jpowsour.2005.05.015 - 43. Aguiar, P., Adjiman, C.S. and Brandon, N.P. (2005) Anode-Supported Intermediate-Temperature Direct Internal Reforming Solid Oxide Fuel Cell: II. Model-Based Dynamic Performance and Control. Journal of Power Sources, 147, 136-147.
https://doi.org/10.1016/j.jpowsour.2005.01.017 - 44. Liu, M., et al. (2008) High-Performance Cathode-Supported SOFCs Prepared by a Single-Step Co-Firing Process. Journal of Power Sources, 182, 585-588.
https://doi.org/10.1016/j.jpowsour.2008.04.039 - 45. Yamahara, K., et al. (2005) Catalyst-Infiltrated Supporting Cathode for Thin-Film SOFCs. Solid State Ionics, 176, 451-456.
https://doi.org/10.1016/j.ssi.2004.09.023