Journal of Materials Science and Chemical Engineering
Vol.1 No.6(2013), Article ID:39494,13 pages DOI:10.4236/msce.2013.16006
Optimization of Microwave Assisted Alkaline Extraction of Xylan from Birch Wood Using Response Surface Methodology
1Department of Chemical Engineering and Applied Chemistry, University of Toronto, Toronto, Canada
2Centre for Biomaterials and Biocomposite Processing, Faculty of Forestry,
University of Toronto, Toronto, Canada
Email: *s.panthapulakkl@utoronto.ca, m.sain@utoronto.ca
Copyright © 2013 Suhara Panthapulakkal, Mohini Sain. This is an open access article distributed under the Creative Commons Attribution License, which permits unrestricted use, distribution, and reproduction in any medium, provided the original work is properly cited.
Received August 2, 2013; revised September 2, 2013; accepted September 9, 2013
Keywords: Biomass; Optimization; Microwave Extraction; Hemicelluloses; Xylan
ABSTRACT
The main purpose of this study was to optimize microwave assisted alkaline extraction of the hemicellulose, xylan, from birch wood. The simultaneous effects of process variables such as time (10 - 30 minutes), concentration of sodium hydroxide solution (4 - 8 wt%), solid to liquid ratio (1:8 to 1:20, g:mL), and sample size (5 - 10 g) on the temperature of the wood slurry, wood dissolution, and yield of extraction were evaluated. A central composite design (CCD) and response surface methodology (RSM) were used for the optimization of the extraction process. Based on the CCD, quadratic models were developed to correlate the extraction process variables with the responses such as temperature of wood slurry, wood dissolution, and yield of xylan and the models were analyzed using appropriate statistical methods (ANOVA). Statistical analysis showed that all the models developed were found to be adequate for the prediction of the respective responses. Optimization of the process was performed using a numerical optimization available in the software to maximize the yield of xylan and the optimum process variables for the maximum yield of xylan was found to be: 10 g of wood fibres, 8 wt% of NaOH solution, 1:10 solid to liquid ratio (g:mL) and 25 minutes of irradiation time. About 72.5% of the xylan present in the birch wood was extracted using the optimized extraction parameters.
1. Introduction
Hemicelluloses, the heterogeneous polysacharides, are the second most abundant polysacharides in plant biomass [1]. The versatility of these polymers and the numerous possibilities of their structural modification result into their use for various industrial applications such as production of bulk or fine chemical, bio-polymers such as polyesters, hydro-gels and pharmacological products [2-6]. Structure of hemicelluloses varies with the source of the biomass. For example, woody biomass contains hemicelluloses with both pentoses and hexoses, whereas non-wood biomass contains hemicelluloses mainly with pentoses [7]. About 15 - 35 wt% of the overall mass of most plant materials, including forest and agricultural residues, belongs to these polysaccharides [7,8]. Xylan, β-(1→4)-linked D-xylopyranoside, is the common hemicelluloses found in hardwood. The application potential of these polymers has been reported elsewhere [3,4,6,9,10]. Different methods, including acid or alkaline extraction, auto hydrolysis, steam explosion, and pressurized extraction, have been used to separate these polymers from the plant biomass for further processing [5,11-14].
Alkaline extraction is known to be the most suitable method for extraction of these polymers, as it causes less degradation of the polymer compared to the other methods of extraction [14,15]. During alkaline extraction hydrolysis of the ester linkages between hemicelluloses and lignin leads to the dissolution of the polysacharides, as oligomers, along with lignin. The efficiency of extraction depends on the strength of the alkaline solution used, temperature, and duration of extraction. Higher alkali loading, and lower temperatures for extraction were reported as the preferred conditions for the extraction of high molecular weight oligomers [16]. However, low temperature needs prolonged duration for considerable extraction of hemicelluloses [17,18]. Microwave heating technology is known to be a cleaner and efficient alternative to the conventional heating mode to accelerate chemical reactions and has been widely used in various applications such as synthesis of polymers, curing of rubbers or polymers, liquefaction of wood etc [19-22]. This technology has been gaining much attention in the biorefinery industry and has been used for pre-treatment of the lignocellulosics for their downstream processing [23-26].
Though there are many literatures available for the microwave assisted pre-treatment of the biomass and extraction of hemicelluloses from biomass using high temperature and/or pressure [13,23-29], only very few literatures are available on microwave assisted extraction of hemicelluloses under mild conditions [30,31]. The high temperature/pressure extractions hamper the economic feasibility of the process, as the process requires expensive equipments compared to the low temperature extractions. Further, under these conditions hemicelluloses undergo degradation and results into lower molecular mass hemicelluloses. On the other hand, shortterm extraction under mild conditions can alleviate these disadvantages. Recently, Obermeir et al. reported that low temperature microwave assisted extraction can dissolve up to 73% of hemicelluloses from wheat straw [31]. However, no available literature to-date reported the optimization of a microwave assisted extraction of xylan from birch wood under mild conditions of temperature and pressure. Our research focused on the development of microwave assisted extraction of xylan using mild reaction conditions such as temperature and power input under atmospheric pressure and preliminary studies indicated that low power input microwave assisted extraction can be used as an efficient alternative to the conventional extraction [32]. We found that a 10 minute microwave extraction of xylan from woody biomass at a low power input leads to a similar extraction yield that obtained at a 90 minutes of extraction at 90˚C using the conventional method. However, the process has to be optimized further with respect to sample size, alkali loading, time of irradiation, and concentration of alkali, as these are the parameters affecting the efficiency of the microwave extraction. In this study, our objective was the optimization of the microwave assisted alkaline extraction using statistical design of experiments.
Studies on the effect of one-factor at a time on the microwave assisted extraction can hardly provide the relationship between all the experimental input parameters (factors) and the output responses, as the results are valid only for the fixed experimental conditions and the prediction of other conditions are vague. Design of experiments (DOE) using response surface methodology (RSM), where several factors can be varied simultaneously, and each factor may be evaluated independently, can be a better alternative to study and establish the relationship between all the factors studied on the output responses [33]. Advantage of this method is the minimum number of experiments required for predicting the relationship between variables and responses, and hence the optimization process, rather than studying all possible combinations of the experiment. Basically, RSM is a compilation of statistical techniques for designing experiments, building models, and estimating the effect of factors on the responses and searching for the optimum conditions of factors for a particular experiment [34]. Further, this technique can quantify the relationships among one or more measured responses and the critical input factors. DOE has been widely used in the optimization applications in the bio-refinery industry [29,35-38]. In this study, we used DOE to investigate the effect four variables such as time of extraction, sample size, solid to liquid ratio, and concentration of alkali on the low power input microwaveassisted extraction of xylan from birch wood. The responses studied were solubilization of wood (wood dissolution), temperature, and yield of xylan. Finally, the extraction process was optimized to maximize the yield of xylan.
2. Experimental
2.1. Materials
The wood fibres used for extraction was prepared from birch wood logs obtained from premises near to University of Toronto. The wood logs were cut into small pieces after removing the bark and dried in an air oven at 40˚C for 4 days. The small wood blocks were then powdered using a Wiley mill with a screen size of 2 mm. The fibres passed through the screen were collected and sieved using a 0.42 mm screen to remove fines. The extractives from the wood fibres were removed following the procedure reported earlier [32] and the extractive-free wood was used for all the experiments. The dried extractivefree wood consists of 42.95% ± 1.05% glucan, 29.35% ± 0.69% xylan, 0.96% ± 0.27% mannan, 21.26% ± 0.41% acid insoluble lignin, 1.43% ± 0.13% soluble lignin, and 0.52% ± 0.04% ash content. Sodium hydroxide solutions of different concentrations used for the extraction were of reagent grade.
2.2. Microwave Assisted Extraction
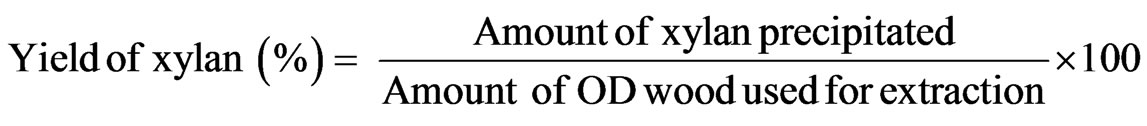
The procedure followed was reported elsewhere [32]. The wood fibre slurry with different combinations of alkali was subjected to microwave extraction using a power input of 110 W, as it was found to the best power input for getting the xylan without much degradation. Immediately after extraction, temperature of the reaction media was noted. The wood residue was separated from the liquid phase by filtration and the residue was washed to remove the alkali. Xylan was precipitated from the liquid phase by neutralizing the solution to a pH of 4.6. The precipitate was re-dissolved in sodium hydroxide and precipitated by padding 3 volumes of ethanol under stirring, washed with 95% ethanol, and then freeze-dried. Wood dissolution and yield of xylan were expressed as follows (Equations (1) and (2)).
2.3. Experimental Designing Using CCD
CCD is the standard RSM to optimize the response, estimate the second order polynomial relationship between independent variables and the dependant variables, and the interaction between the independent variables with the dependant variables [34]. In order to optimize the microwave assisted extraction, a four-factor, five-level CCD with replicates at the centre point was used. The variables studied were extraction time (A), NaOH concentration (B), solid to liquid ratio (C), and sample size (D). The variables ranges were selected based on our preliminary experiments. The number of experiments required for 4 variables CCD was calculated using the Equation (3).
 (3)
(3)
where n is the number of independent variable, first term (2n) represents the number of factorial points, second term (2n) represents the number of axial points (star points), and the third term (nc) represents the number of replicates at the centre point. The whole CCD design of this study consists of a total of 30 experiments including 16 factorial points, 8 axial points (a = 2) with 6 replicates at the centre point. The replicates of the centre point were used to determine the reproducibility and reliability of the experiments and the error occurred during the experiment. The variables were coded for statistical estimation as per Equation (4).
 (4)
(4)
where, xi is the independent coded variable, Xi is the real value of the independent variable, X0 is the real value of the independent variable at the centre point and DXi is the step value change. The range of variables and their levels studied are given in the Table 1.
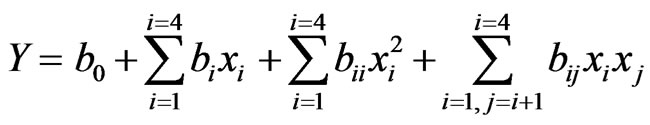
The variables coded as −1 and +1 represents the low and high levels of the variables studied, zero represents the centre point of the design and −a, and +a represents the axial or star points of the design. In the study, the value of a was fixed at 2 to make the design a rotatable one. The complete CCD design was generated using the Design Expert 8.0.7.1 (trial version, Stat-Ease Inc., Minneapolis, MN, USA) software. The complete design matrix obtained with the coded and uncoded independent variables and the corresponding responses obtained are given in the Table 2. As in any statistical designing of experiment, the experiments performed were randomized to minimize the unpredictable variations in the observed responses due to uncontrolled extraneous factors. The responses studied include dissolution of wood, yield of xylan, and temperature of the slurry. A second degree polynomial quadratic equation was used to develop the empirical model to establish the correlation between the variables and each response Y, as shown in the following Equation (5).
 (5)
(5)
where b0, bi, bii, and bij are the constant tem, regression coefficients of the individual linear effects, quadratic effects, and interaction effects between the variables respectively. These polynomial equations were used to create the surface or contour plots to visualize the relationship between the process variables and the responses studied.
2.4. Statistical Analysis and the Model Evaluation
Statistical analysis of the experimental design was carried out using the Design Expert software. Multiple linear regression analysis of the experimental data was used to evaluate the statistical significance of the model developed. Analysis of variance (ANOVA) of the model for each response was also performed to study the significance of the regression coefficient of determinations
 (1)
(1)
 (2)
(2)
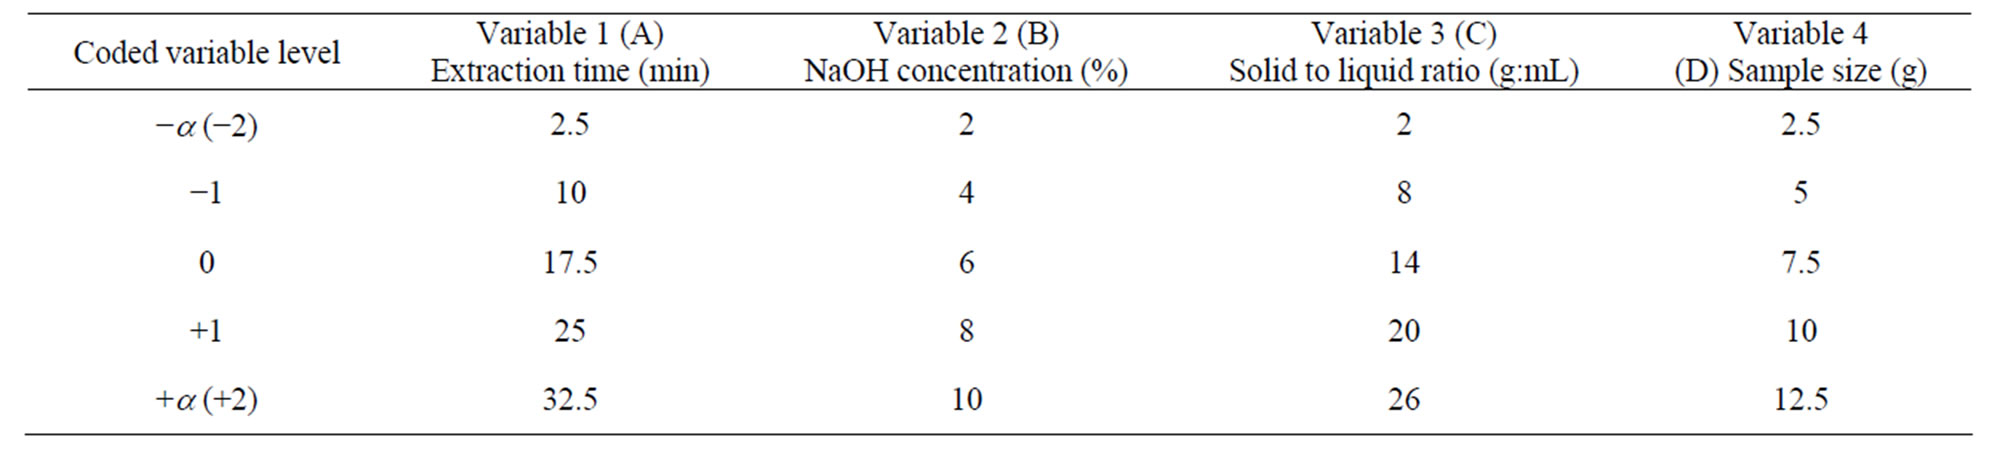
Table 1. Independent variables studied in the CCD with their coded and uncoded levels.
for each effect (linear, quadratic, and interaction) in the model, and to assess response model fit to the data (the lack of fit parameters), and hence to evaluate the significance of the models for further rationalization. The competence of the model was also evaluated using adjusted R2 and predicted R2, rather than R2 values, as the value of R2 increase with the addition of variables despite the significance of the added variables.
2.5. Optimization of the Processing Variables
The microwave extraction process was optimized using the numerical optimization approach available in the software with the objective of maximizing the yield of xylan. Four additional experiments were performed using the optimal conditions selected and the results (responses) were compared with the predicted responses to verify the validity of the surface response model developed.
3. Results and Discussion
The results of the optimization experimentation of the four variables (extraction time, concentration of alkali, solid to liquid ratio, and sample size) on the responses (wood dissolution, yield of xylan, and temperature generated) are given in the Table 2. The surface response quadratic models used to study the relationship between the independent variables and to that of the responses are shown in the Table 3. Model regression coefficients were also reported in the table for checking the adequacy of the model. The positive values in the model show the synergistic effect of the variables on the response, whereas the negative values show the antagonistic effect of the respective effect of the variables. The correlation coefficient values, standard deviation, and adequate precision (a term that measures signal to noise ratio) of the model indicate the quality of the model.
3.1. Effect of Extraction Variables on Temperature of the Wood Slurry
During microwave assisted extraction, the temperature of the wood slurry increases as a result of direct interaction with the electromagnetic radiation and the reaction media. In this case most of the radiation absorption is caused by sodium hydroxide solution, as the microwave radiation couple with the components of high loss value in a system where the components have different dielectric properties. Sodium hydroxide solution has a high loss factor (~1 - 5) [39] compared to wood (0.15 - 0.19) [40], and hence heating of the wood slurry occurs mainly through the interaction of microwave and the solution. The effect of independent variables (time of irradiation, concentration of sodium hydroxide, solid to liquid ratio and sample size) on the temperature of the reaction media was studied using the experimental design, and the results are given in the Table 2. The temperature reported here is the temperature of the slurry after particular time of irradiation. The lowest temperature reported was for the run #1 (50˚C), whereas the highest temperature was for the run #22 (99.5˚C). The lowest temperature obtained when all the variables studied except time were on the higher levels. On the other hand, the highest temperature was obtained when the variables time and sodium hydroxide concentration were on the higher levels indicating time of irradiation increases temperature of the slurry.
The surface response quadratic model using the CCD to establish the relationship between the variables and temperature of the system is given in the Table 3. The regression coefficients, R2, adjusted R2 and predicted R2 for the model are 0.9987, 0.9974, and 0.9937 respectively. The high values of R2, close to unity, indicate that the final temperature of the system can be predicted with the model suggested. Further, close agreement within these values also indicates the accuracy of the predictive model. Figure 1 shows the predicted temperature versus the actual temperature, and the strong correlation between the predicted and actual temperature indicates the significance of the model within the experimental window. Standard deviation of the model was 0.70 and the small standard deviation indicates the reproducibility of the model. Further, the adequate precision of the model reported was very high (100.489); better model will have a value greater than 4, which again indicates the suitability of the model for navigating the design space.
The ANOVA for the regression model for temperature is given in the Table 4. The coefficients with p-values
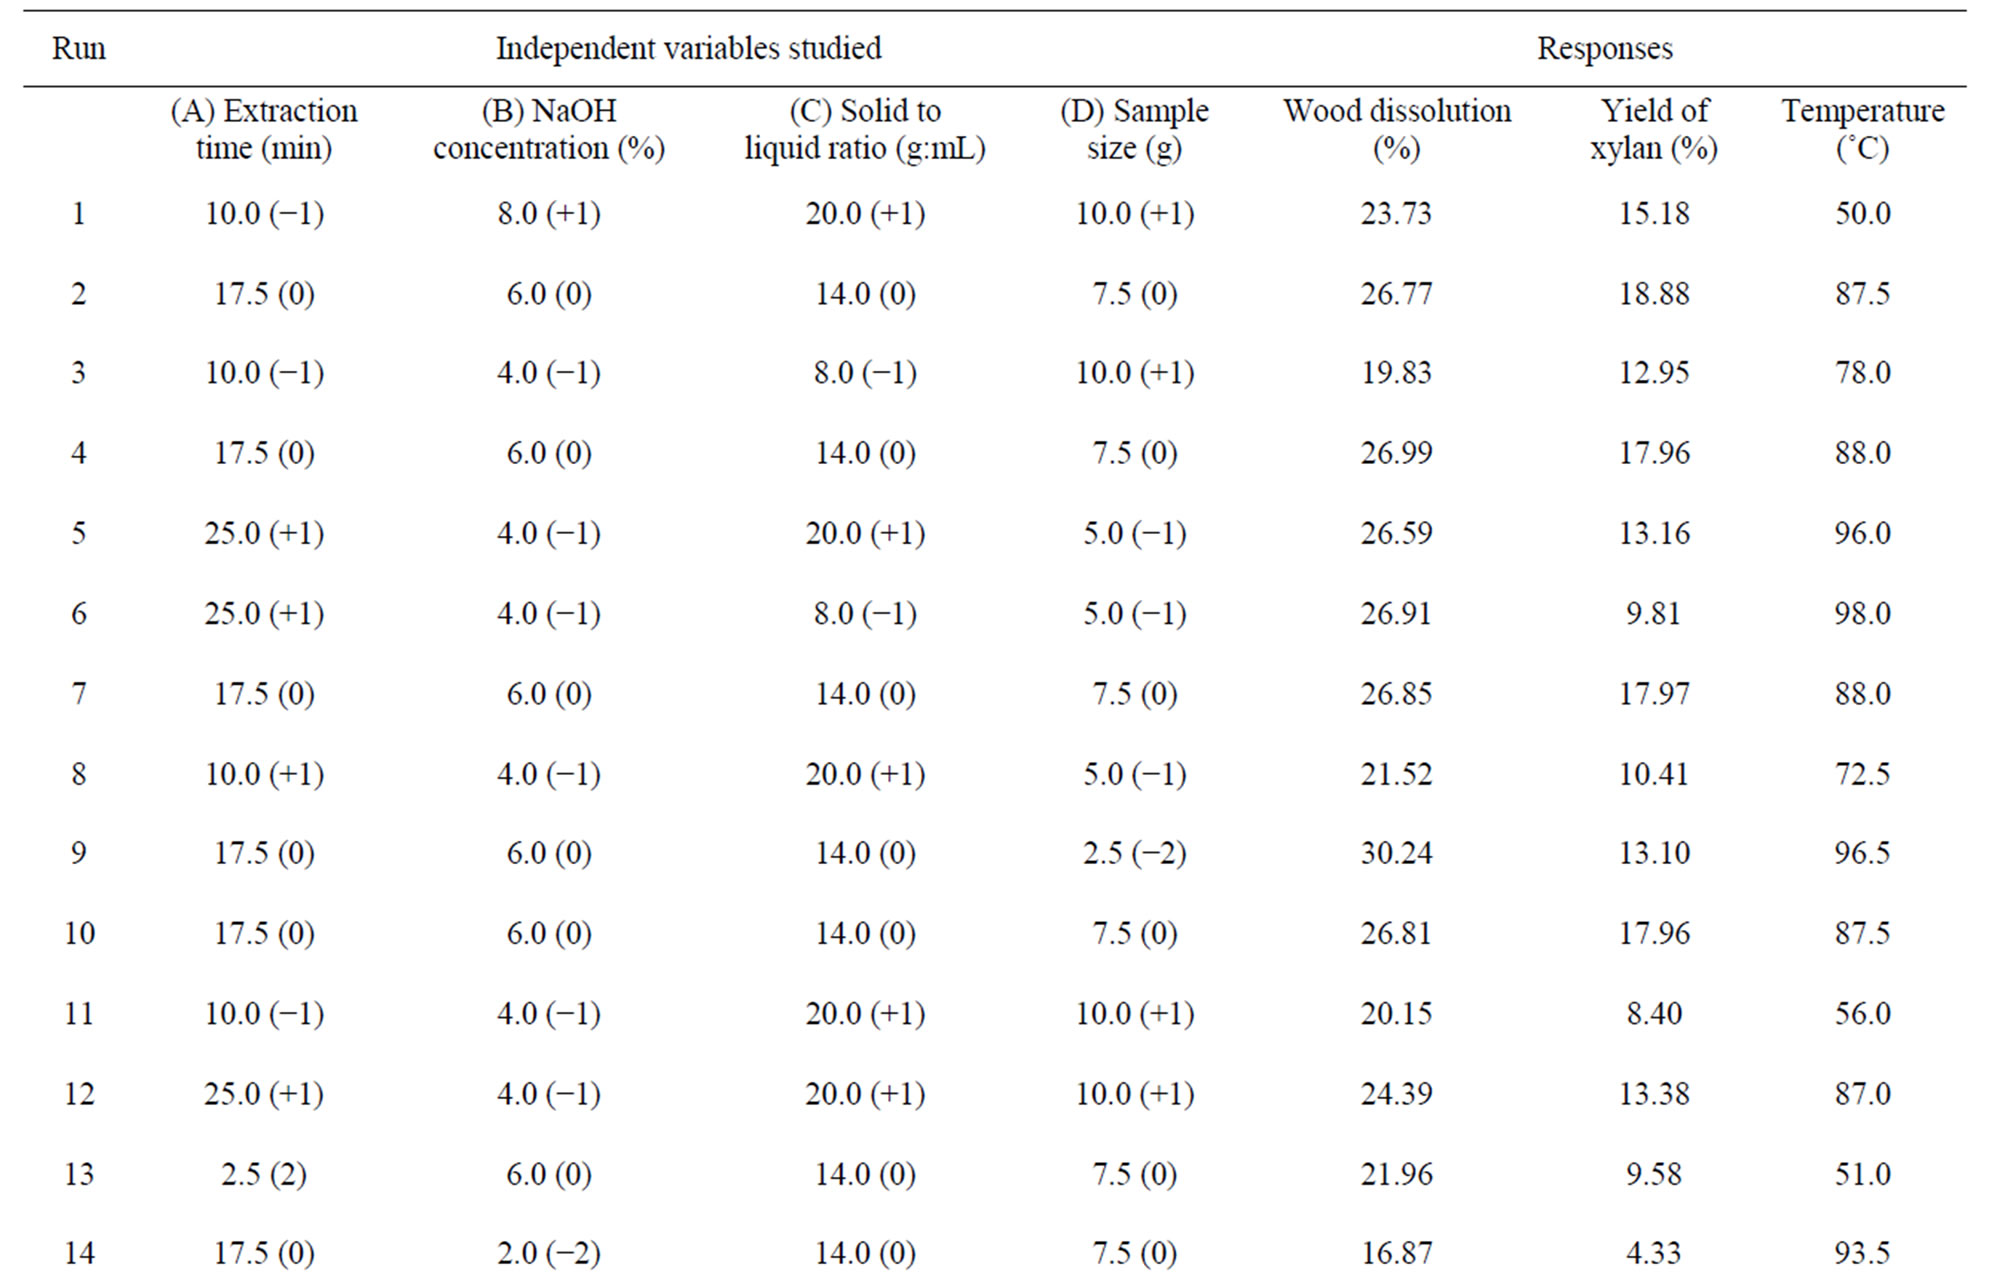
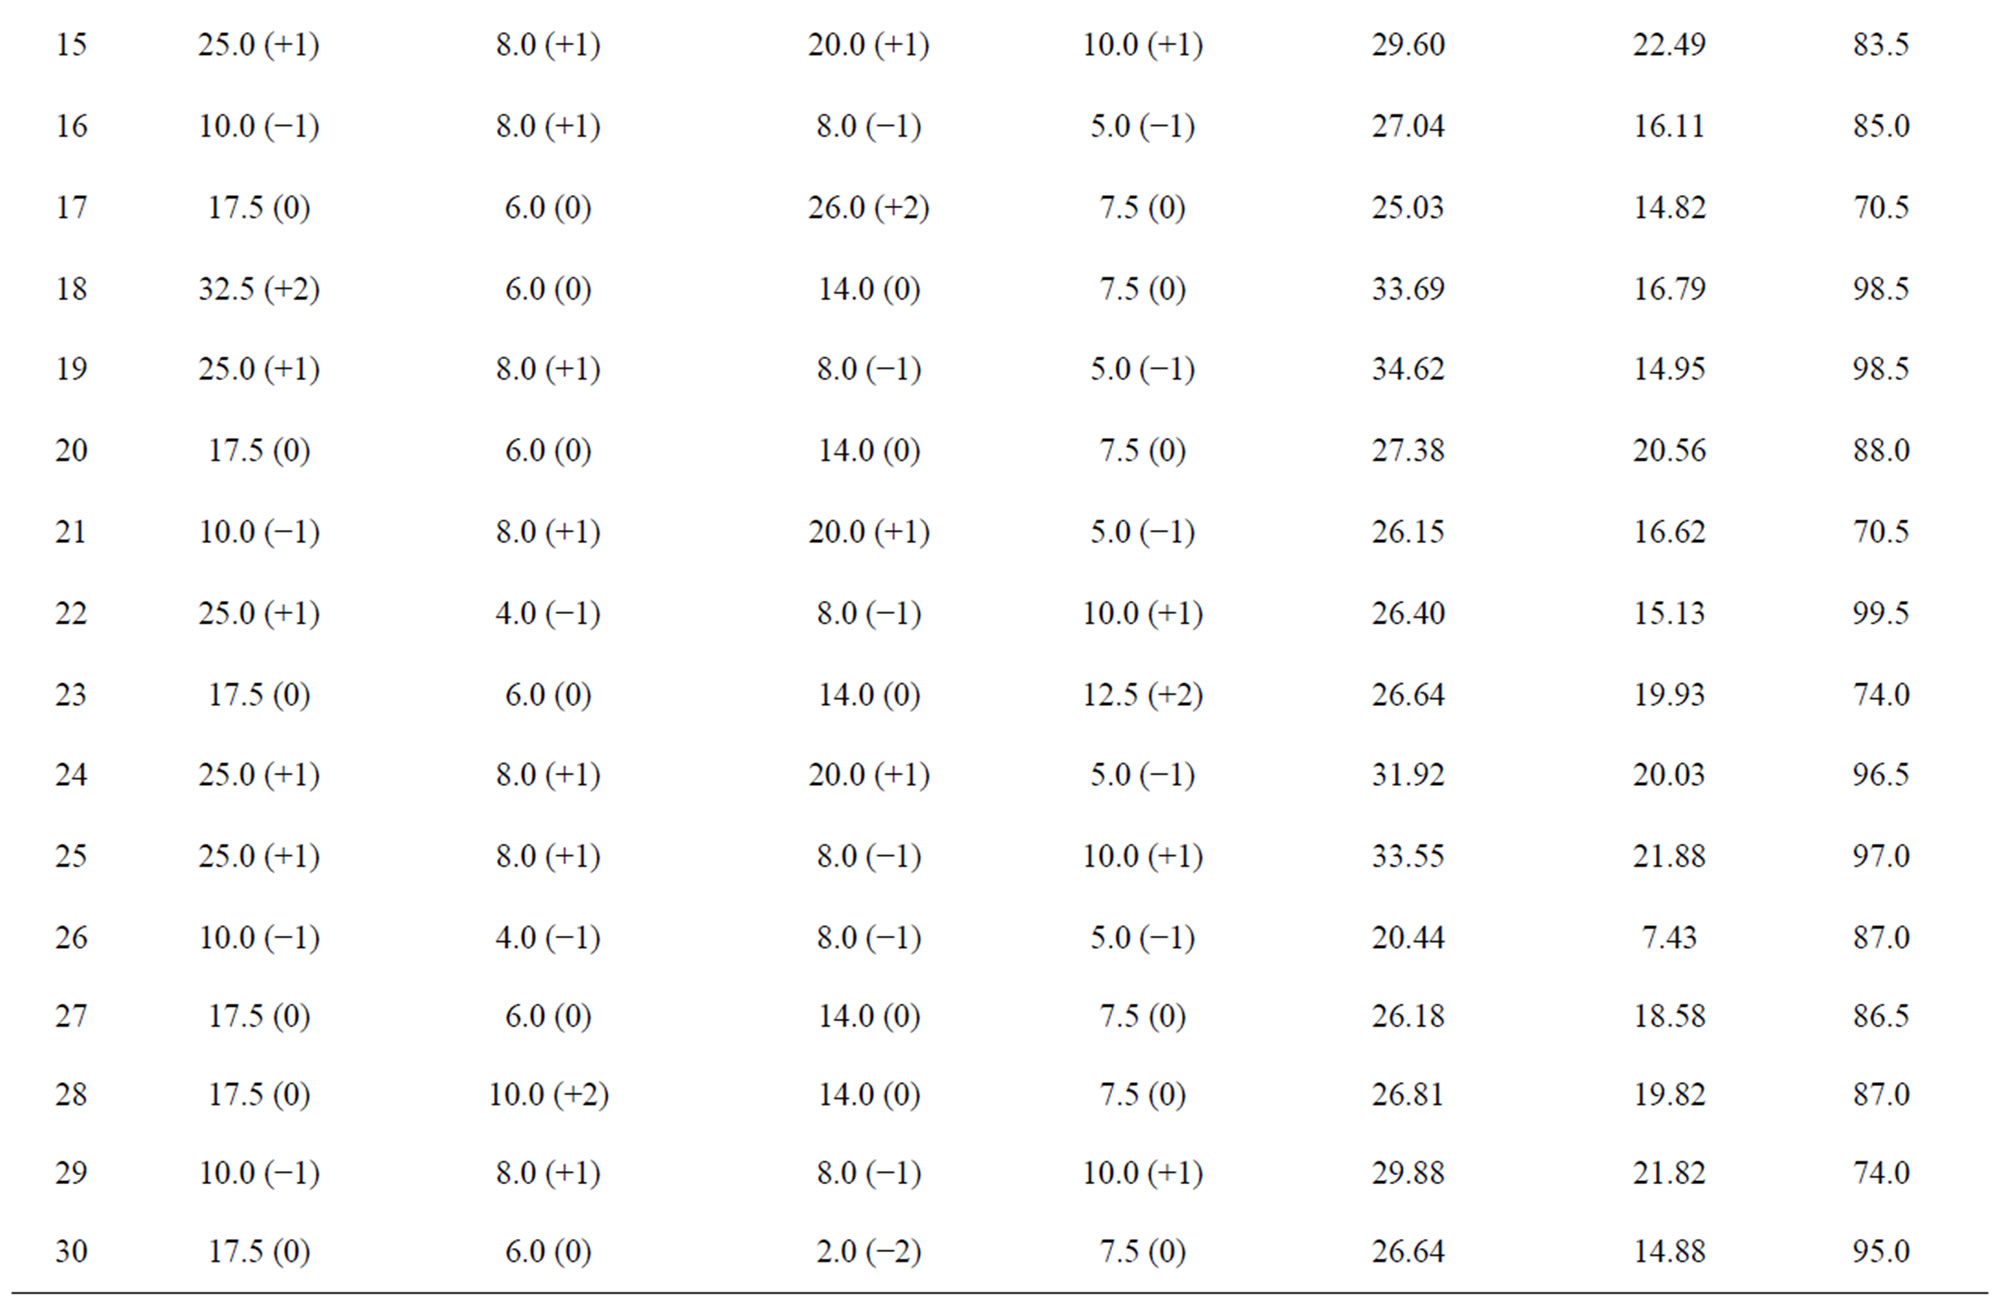
Table 2. DOE design matrix and the results.
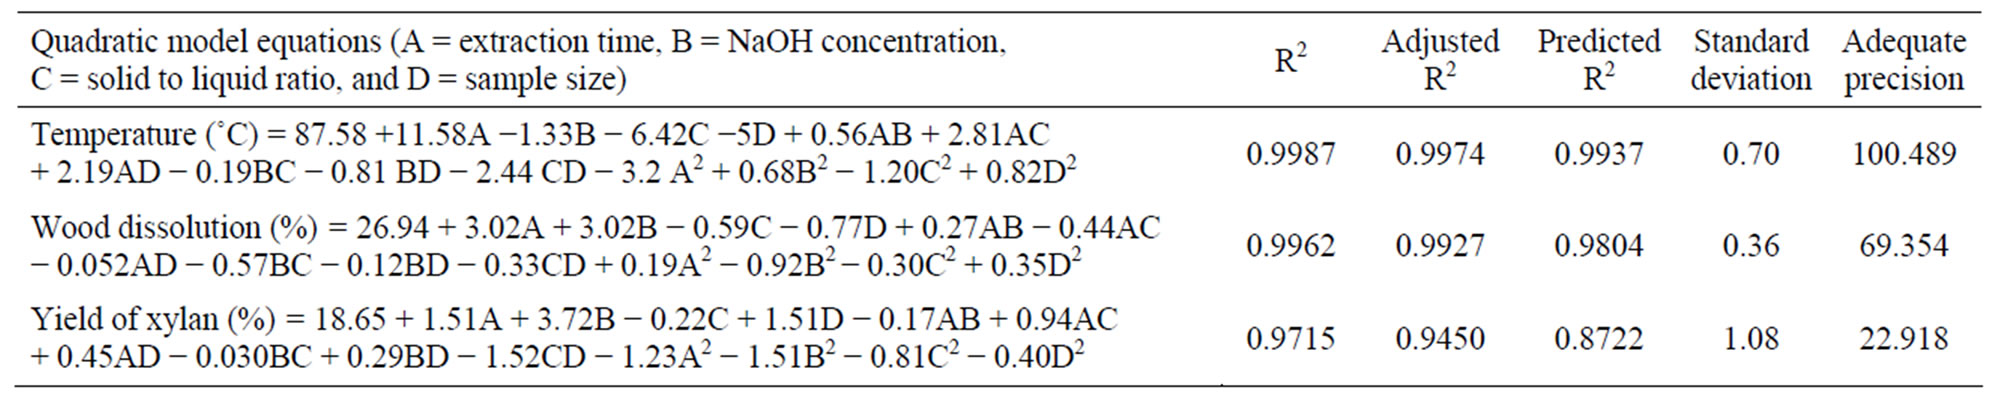
Table 3. Polynomial equations for the quadratic model and the regression coefficients.
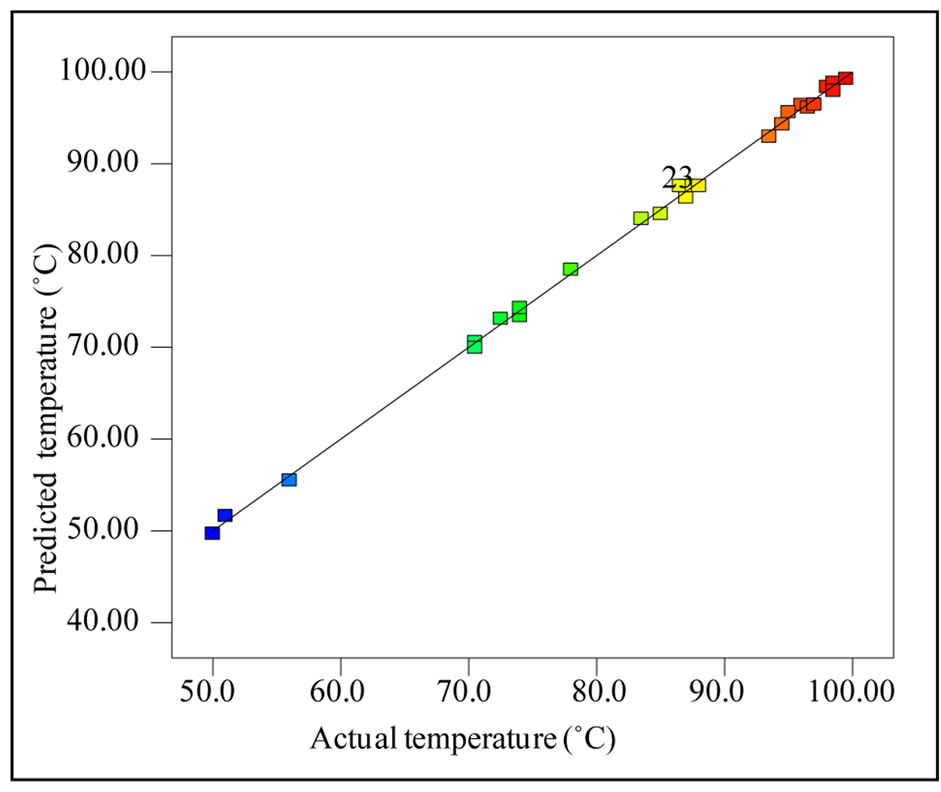
Figure 1. Actual temperature vs predicted temperature.
less than 0.05 are considered as significant effect. The p value (<0.0001) and high Fischer variance value (F-value) (281.50) for the quadratic model implied this model was significant. From the regression coefficients of the variables, it was found that the linear terms for all the variables, and interaction term between all the variables, except the interaction between sodium hydroxide concentration and solid to liquid ratio, and all the quadratic terms in the model were significant.
The effect of interaction terms between variables on the response, extent of interaction, and the nature of interaction can be obtained from the surface contour plots of the models. The response surfaces of the significant interaction effects are shown in the Figure 2. In all the figures, in order to describe the interactive effects of the independent variables on temperature, the other two variables were kept constant at their mid levels. Figure 2(a) shows that, at 4% NaOH concentration the temperature was increased from 70˚C to 98˚C when the time of irradiation increased from 10 minutes to 25 minutes, whereas at 8% NaOH concentration, the temperature was increased from 70˚C to 96˚C for the same duration of extraction. Effect of interaction between time and solid to liquid ratio on temperature shows a minimum temperature for 10 minutes of extraction at a solid to liquid ratio of 1:20, and showed a maximum temperature for 25 minutes of extraction at a solid to liquid ratio of 1:8 (Figure 2(b)). Sample size and time also had a similar effect on the temperature, and the maximum temperature was observed at longer duration of extraction and for a small sample size (Figure 2(c)). In Figure 2(e), maximum temperature was observed for a larger sample size and a lower solid to liquid ratio (10 g, 1:8 g/mL). These results indicate that irradiation time had a positive impact on the temperature, whereas sample size and the solid to liquid ratio had a negative impact under the experimental conditions studied. Figures 2(a) and (d) show the effect of interaction terms between NaOH solution concentration and time (at a constant level of sample size and solid to liquid ratio: 7.5 g, and 1:14 g/mL), and that of NaOH solution concentration and sample size (at a constant level of time and solid to liquid ratio; 17.5 minutes and 1:14 g/mL) on temperature. The NaOH concentration under these experimental conditions did not affect the temperature of the slurry. Increase in temperature leads to increased hydrolysis and leads to increased wood dissolution, and so a high yield of xylan is expected at these conditions.
3.2. Effect of Extraction Variables on Wood Dissolution
Wood dissolution during alkaline extraction occurs due to the hydrolysis of the lignin-carbohydrate linkages. The amount of wood dissolved during the experimentation (Table 2) varied from about 17 wt% (run #14) to 35% (run #19). The highest amount of wood dissolution during the microwave assisted extraction was observed at high levels of extraction time (+1, 25 minutes) and concentration of sodium hydroxide (+1, 8 wt%), and low levels of sample size (−1, 5 g) and solid to liquid ratio (−1, 1:8 g/mL). On the other hand, the lowest amount of wood dissolution occurred at a low level of sodium hydroxide (−2, 2 wt%) and mid levels of time (0, 14 minutes), solid to liquid ratio (0, 1:14 g/mL) and sample size (0, 7.5 g). It is clear that higher concentration of alkali and longer duration of extraction increased the wood dissolution. Longer duration of irradiation increases the temperature of the system (respective temperatures for the low and high dissolution of wood were 93.5˚C to
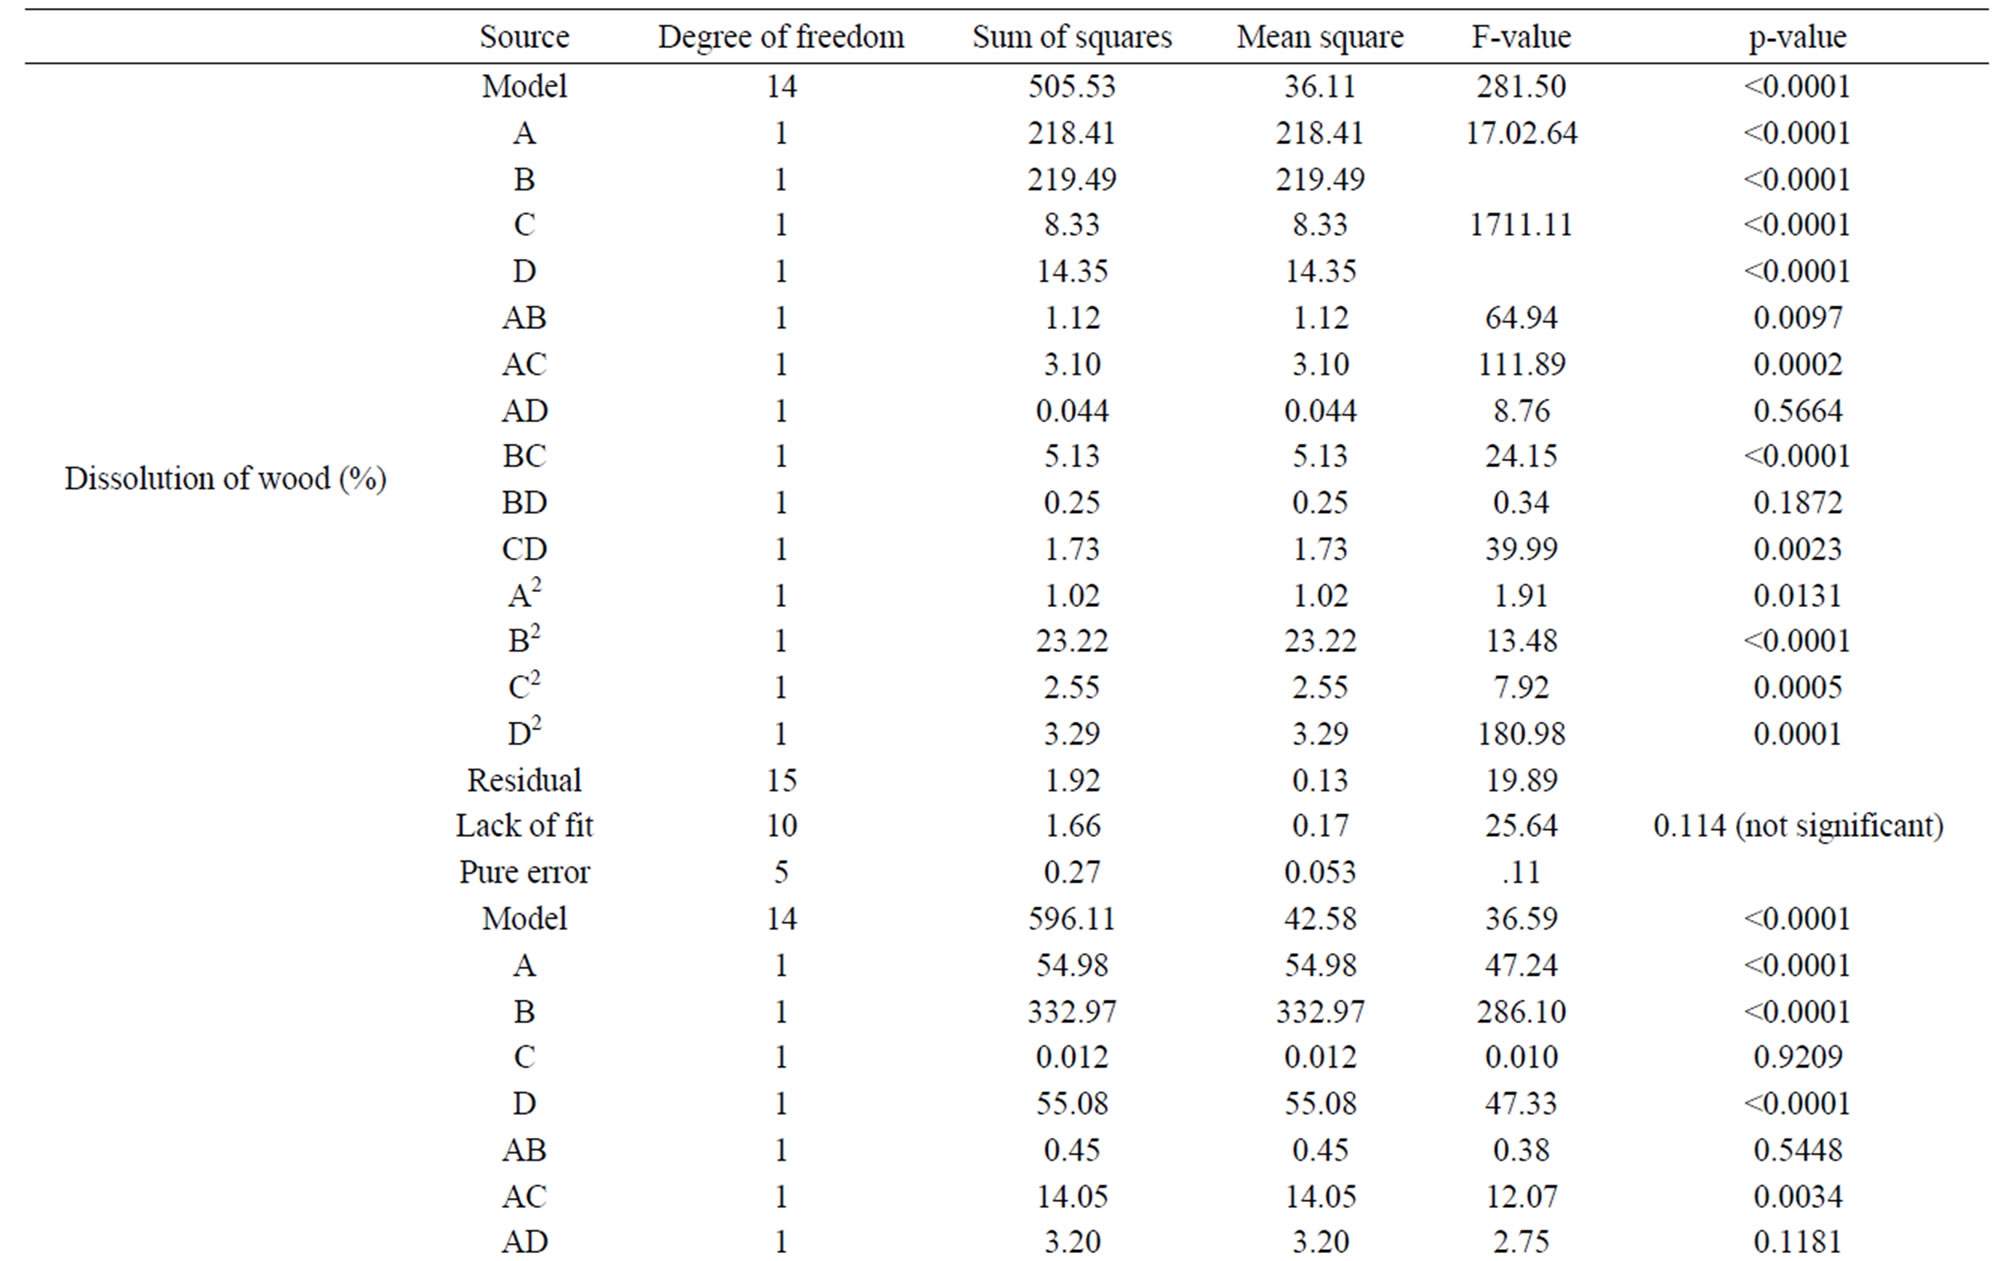
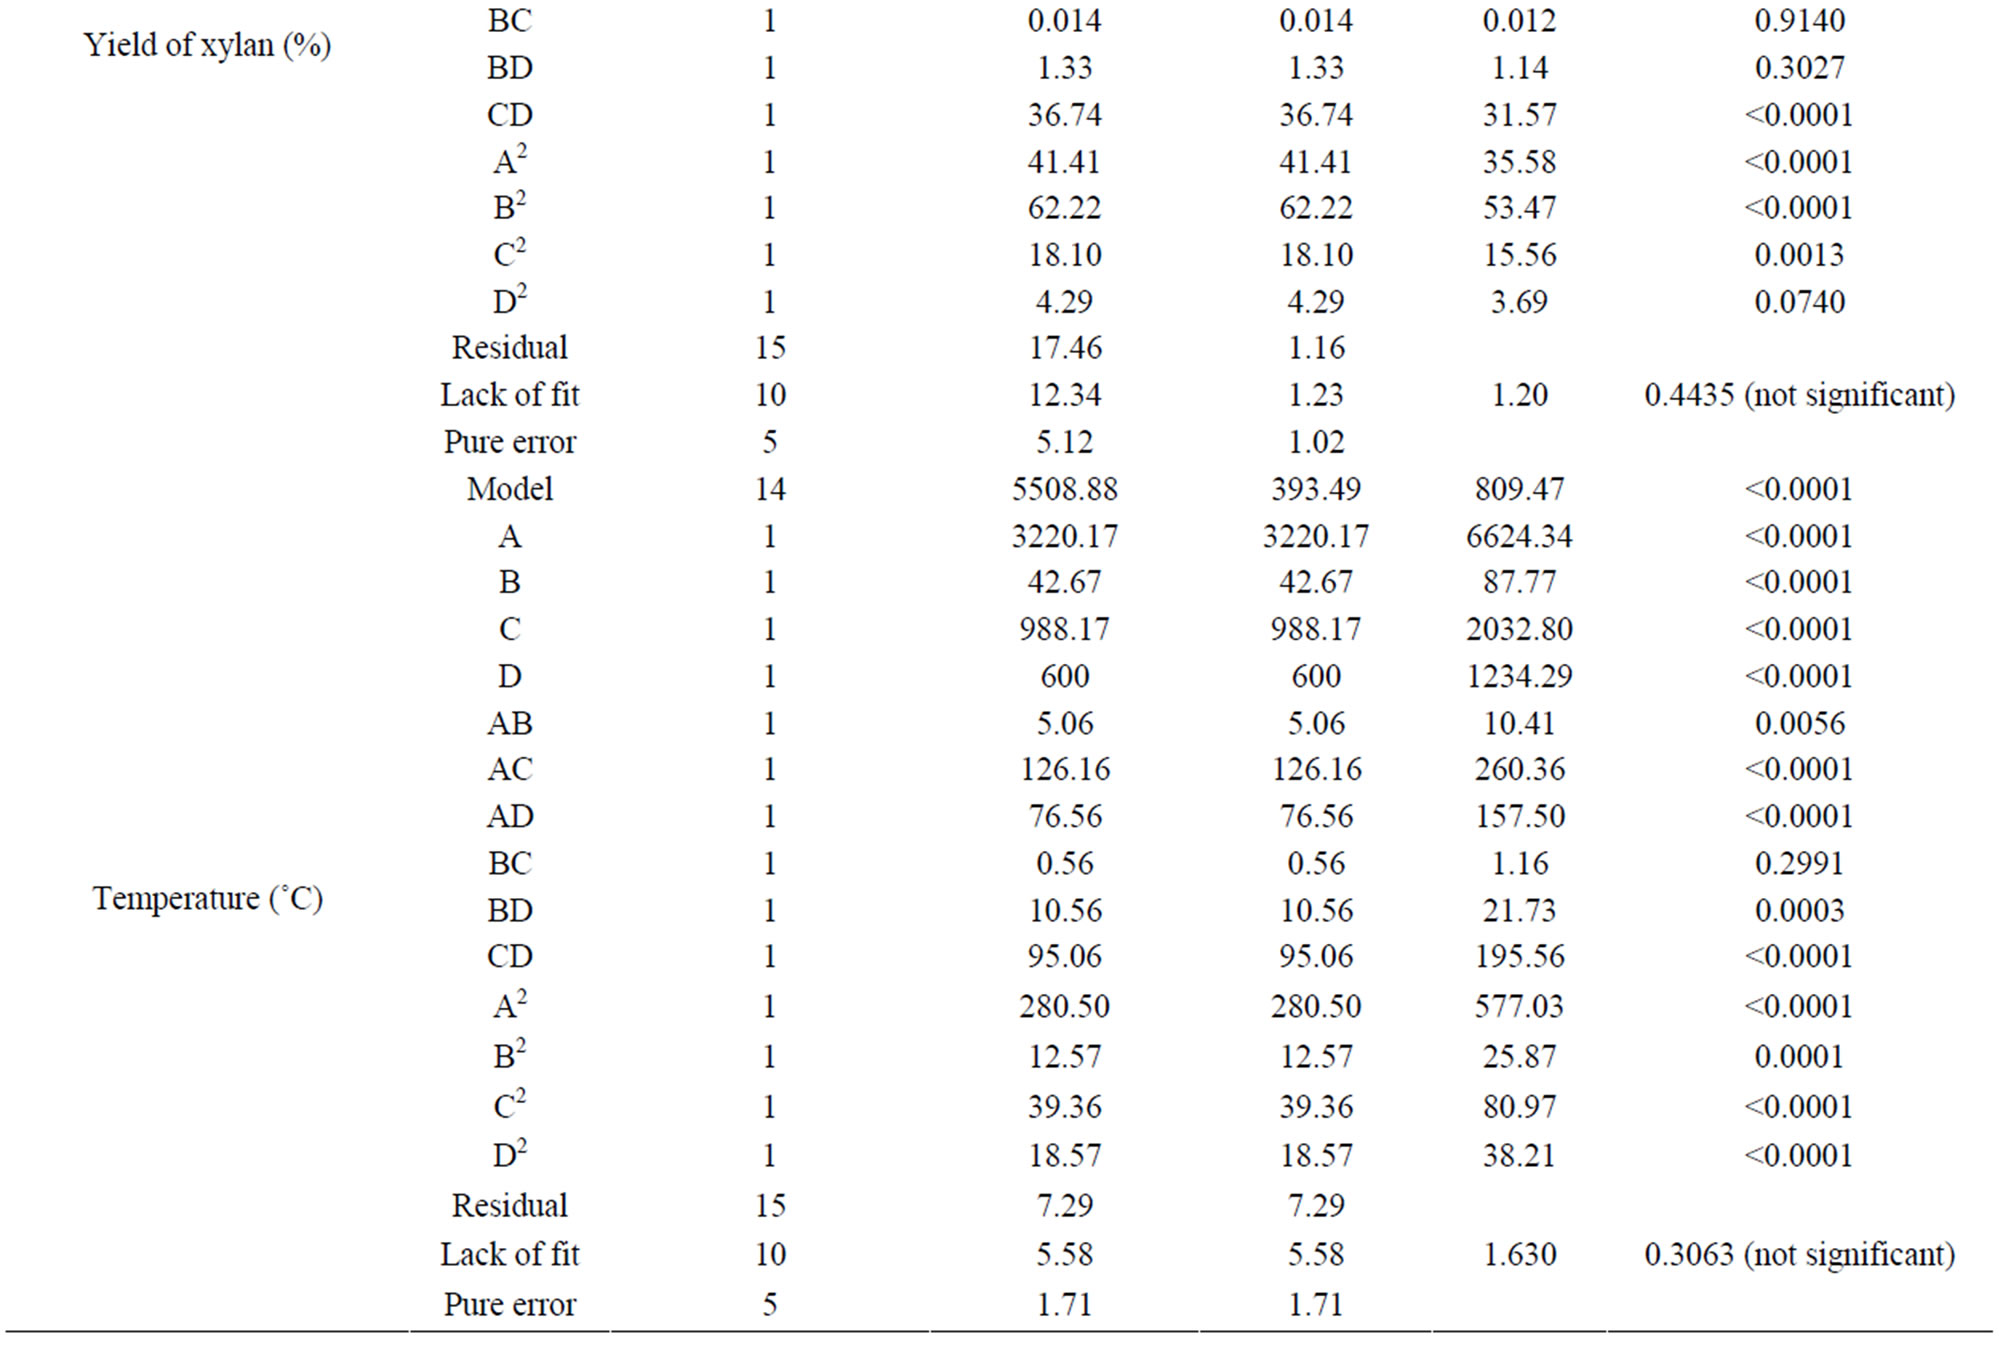
Table 4. Analysis of variance (ANOVA) for the RSM model.
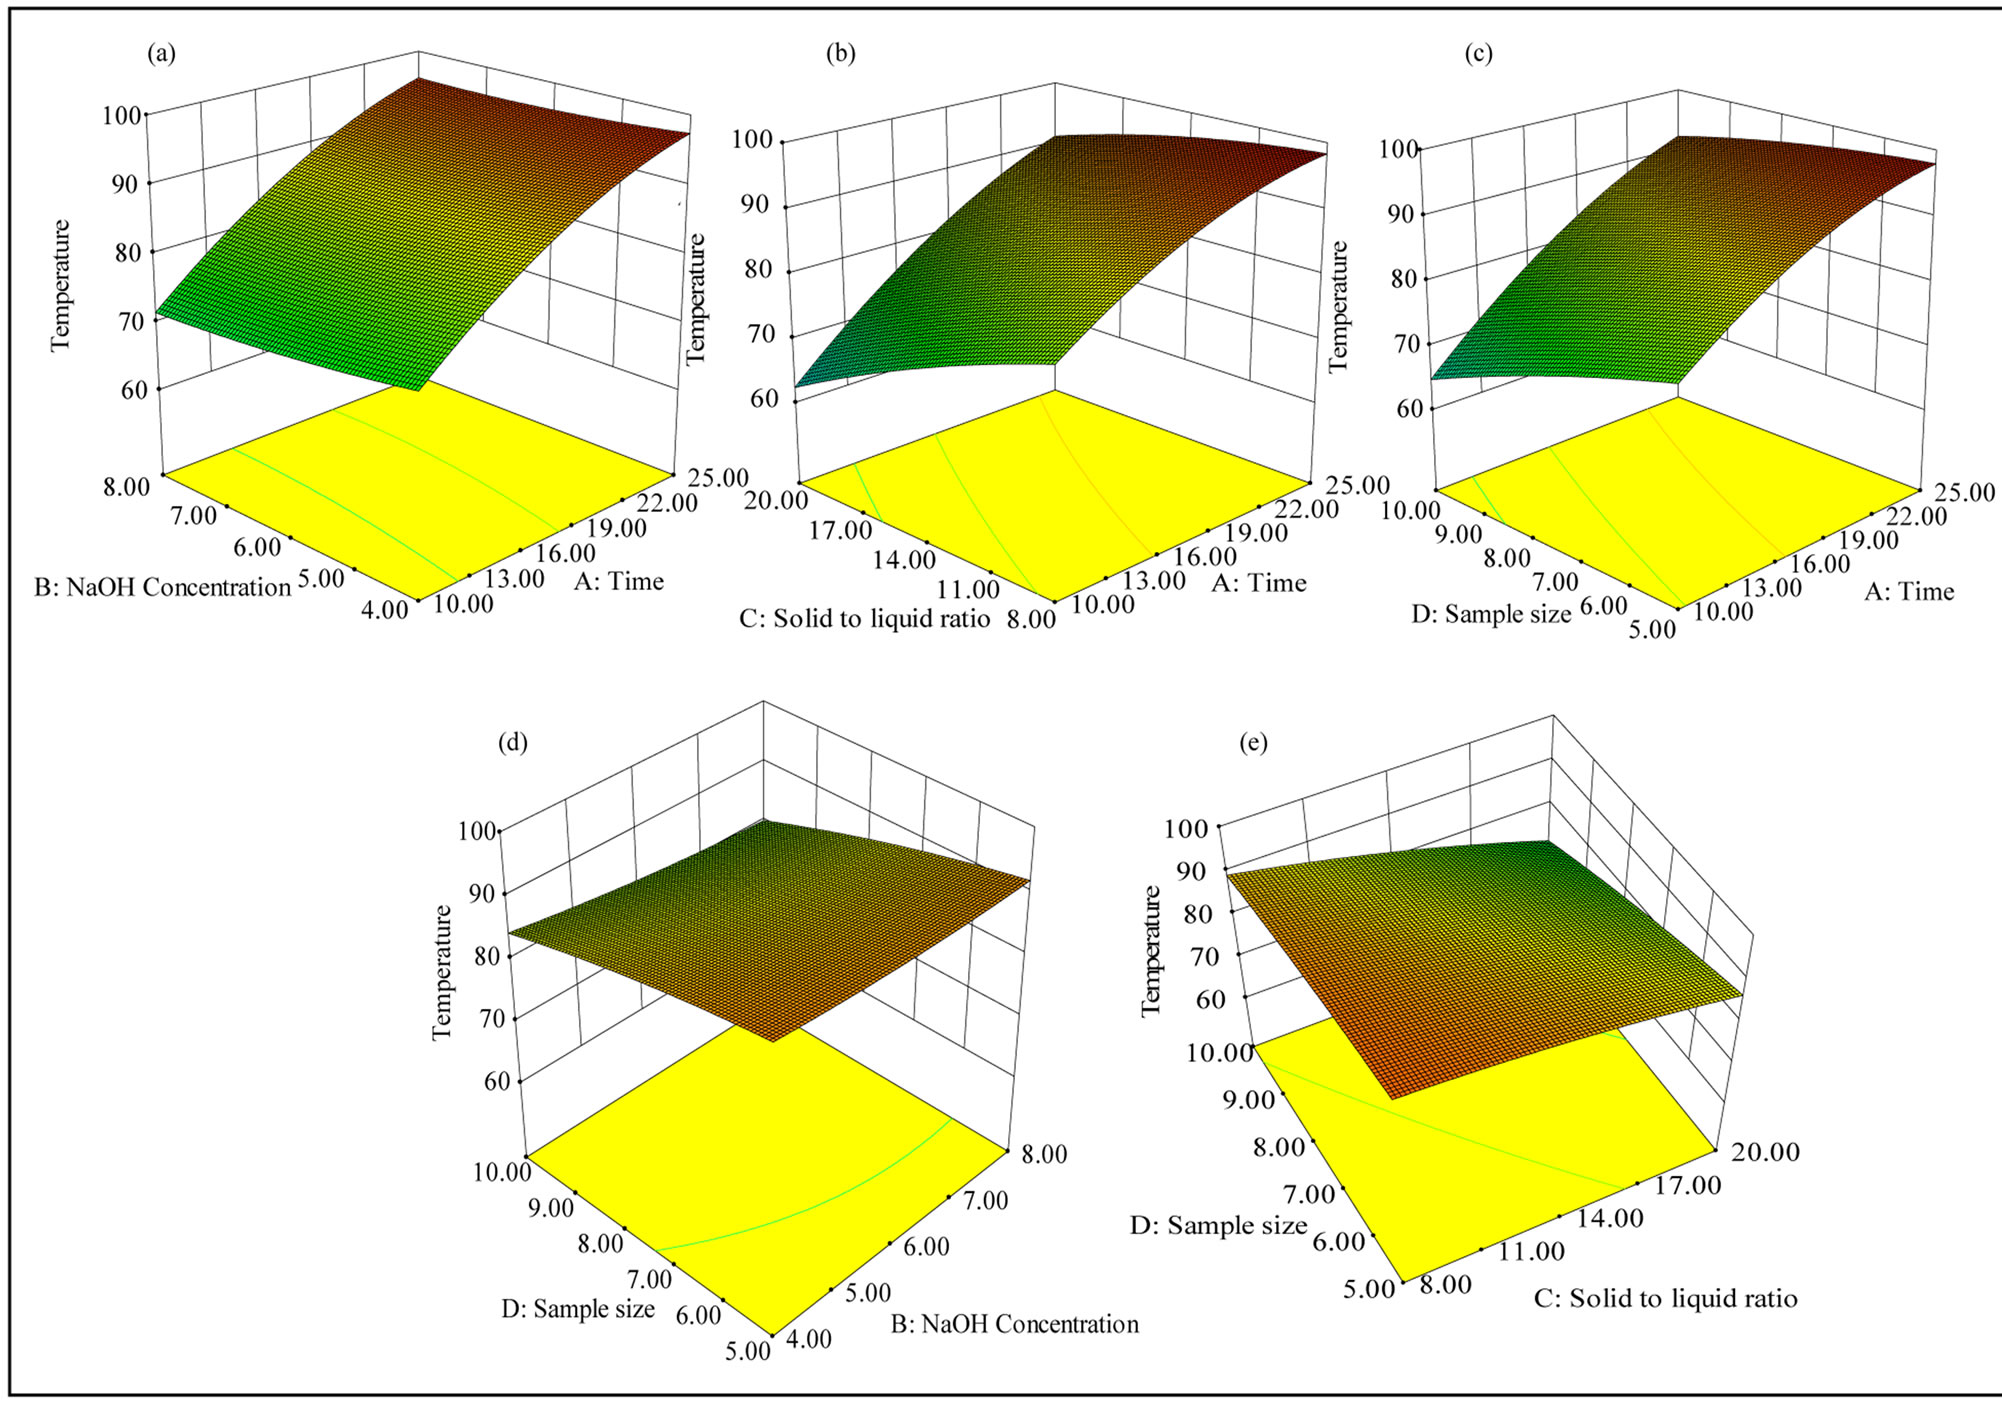
Figure 2. Response surface plots showing the interaction between the variables affecting the temperature of wood slurry: (a) Interaction between time and NaOH solution concentration; (b) Interaction between time and solid to liquid ratio; (c) Interaction between time and sample size; (d) Interaction between sample size and NaOH concentration; and (e) Interaction between sample size and solid to liquid ratio.
98.5˚C) as described in the previous section and this enhances the wood dissolution.
The simultaneous effect of the independent variables on the dissolution of wood is established by the surface response quadratic model using the CCD (Table 3). The relatively high values of R2 (0.9962) and adjusted R2 (0.9927) of the response surface model indicate that the model considers only the significant terms and so a good agreement between the experimental and the predicted responses. The predicted R2 (0.9804) was also found to be closer to the adjusted R2 values indicating the adequacy of the model. Relatively smaller standard deviations of the model (0.36) used for the prediction of wood dissolution indicated the better reproducibility of the results. Further, adequate precision for the wood dissolution model was reported to be 69.30, which is well above the required value of 4. The higher values of R2, smaller standard deviation and high value of adequate precision of the model demonstrated the suitability of the model for the prediction of the real relationship among the variables studied to the wood dissolution. Figure 3
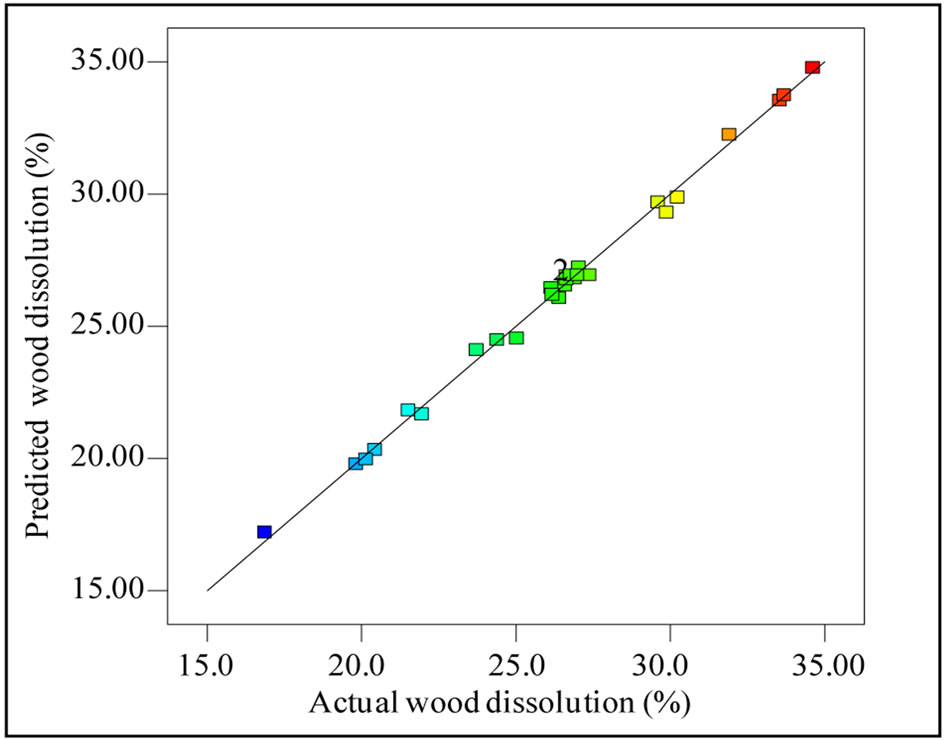
Figure 3. Actual wood dissolution vs predicted wood dissolution.
demonstrates the strong correlation between the predicted and observed wood dissolution during microwave assisted extraction of xylan.
The ANOVA for the response surface quadratic models for wood dissolution are given in the Table 4. The p-value for the quadratic model for the wood dissolution (<0.0001) and high F-value (281.50) implied that this model is significant. From the regression coefficients of the variables, it is clear that the linear terms of all the variables studied, interaction terms between variables except the two interaction terms (time and sample size; and NaOH solution concentration and sample size) and the quadratic terms were significant. Significance of the interaction terms between time and NaOH solution concentration (F value, 8.76, p-value 0.0097), and that of solid to liquid ratio and sample size (F-value 13.48, p-value 0.0023) are less significant than the interaction terms between time and solid to liquid ratio (F-value 24.15, p-value 0.0002), and NaOH concentration and solid to liquid ratio (F-value 39.99, p-value < 0.0001).
The response surfaces of the significant interaction effects on the wood dissolution are shown in Figure 4. The percentage of wood dissolution affected by different NaOH concentration and extraction time was shown in Figure 4(a), where solid to liquid ratio and sample size were kept constant at 1:14 (g/mL) and 7.5 (g) respectively. Extraction time and NaOH concentration time exhibited a positive impact on the wood dissolution and the wood dissolution increased with the increase of time of extraction and sodium hydroxide concentration. Maximum the wood dissolution at a constant level of NaOH solution (6 wt%) and sample size (7.5 g). The figure indicated that maximum wood dissolution ocurred for 25 minutes of extraction at a solid to liquid ratio of 1:8 g/mL. Effect of interaction terms of NaOH solution concentration and solid to liquid ratio on the wood dissolution is shown in Figure 4(c). The extractions were performed using 7.5 g of wood sample for 17.5 minutes. The wood dissolution increased as the level of NaOH concentration increased and a maximum of about 30 wt% was observed when the NaOH concentration was at 8 wt%, and the solid to liquid ratio was 1:8 g/mL. Increase in the sample size and solid to liquid ratio has a negative impact on the wood dissolution (Figure 4(d)), when the extraction was performed for 17.5 minutes using 6 wt%
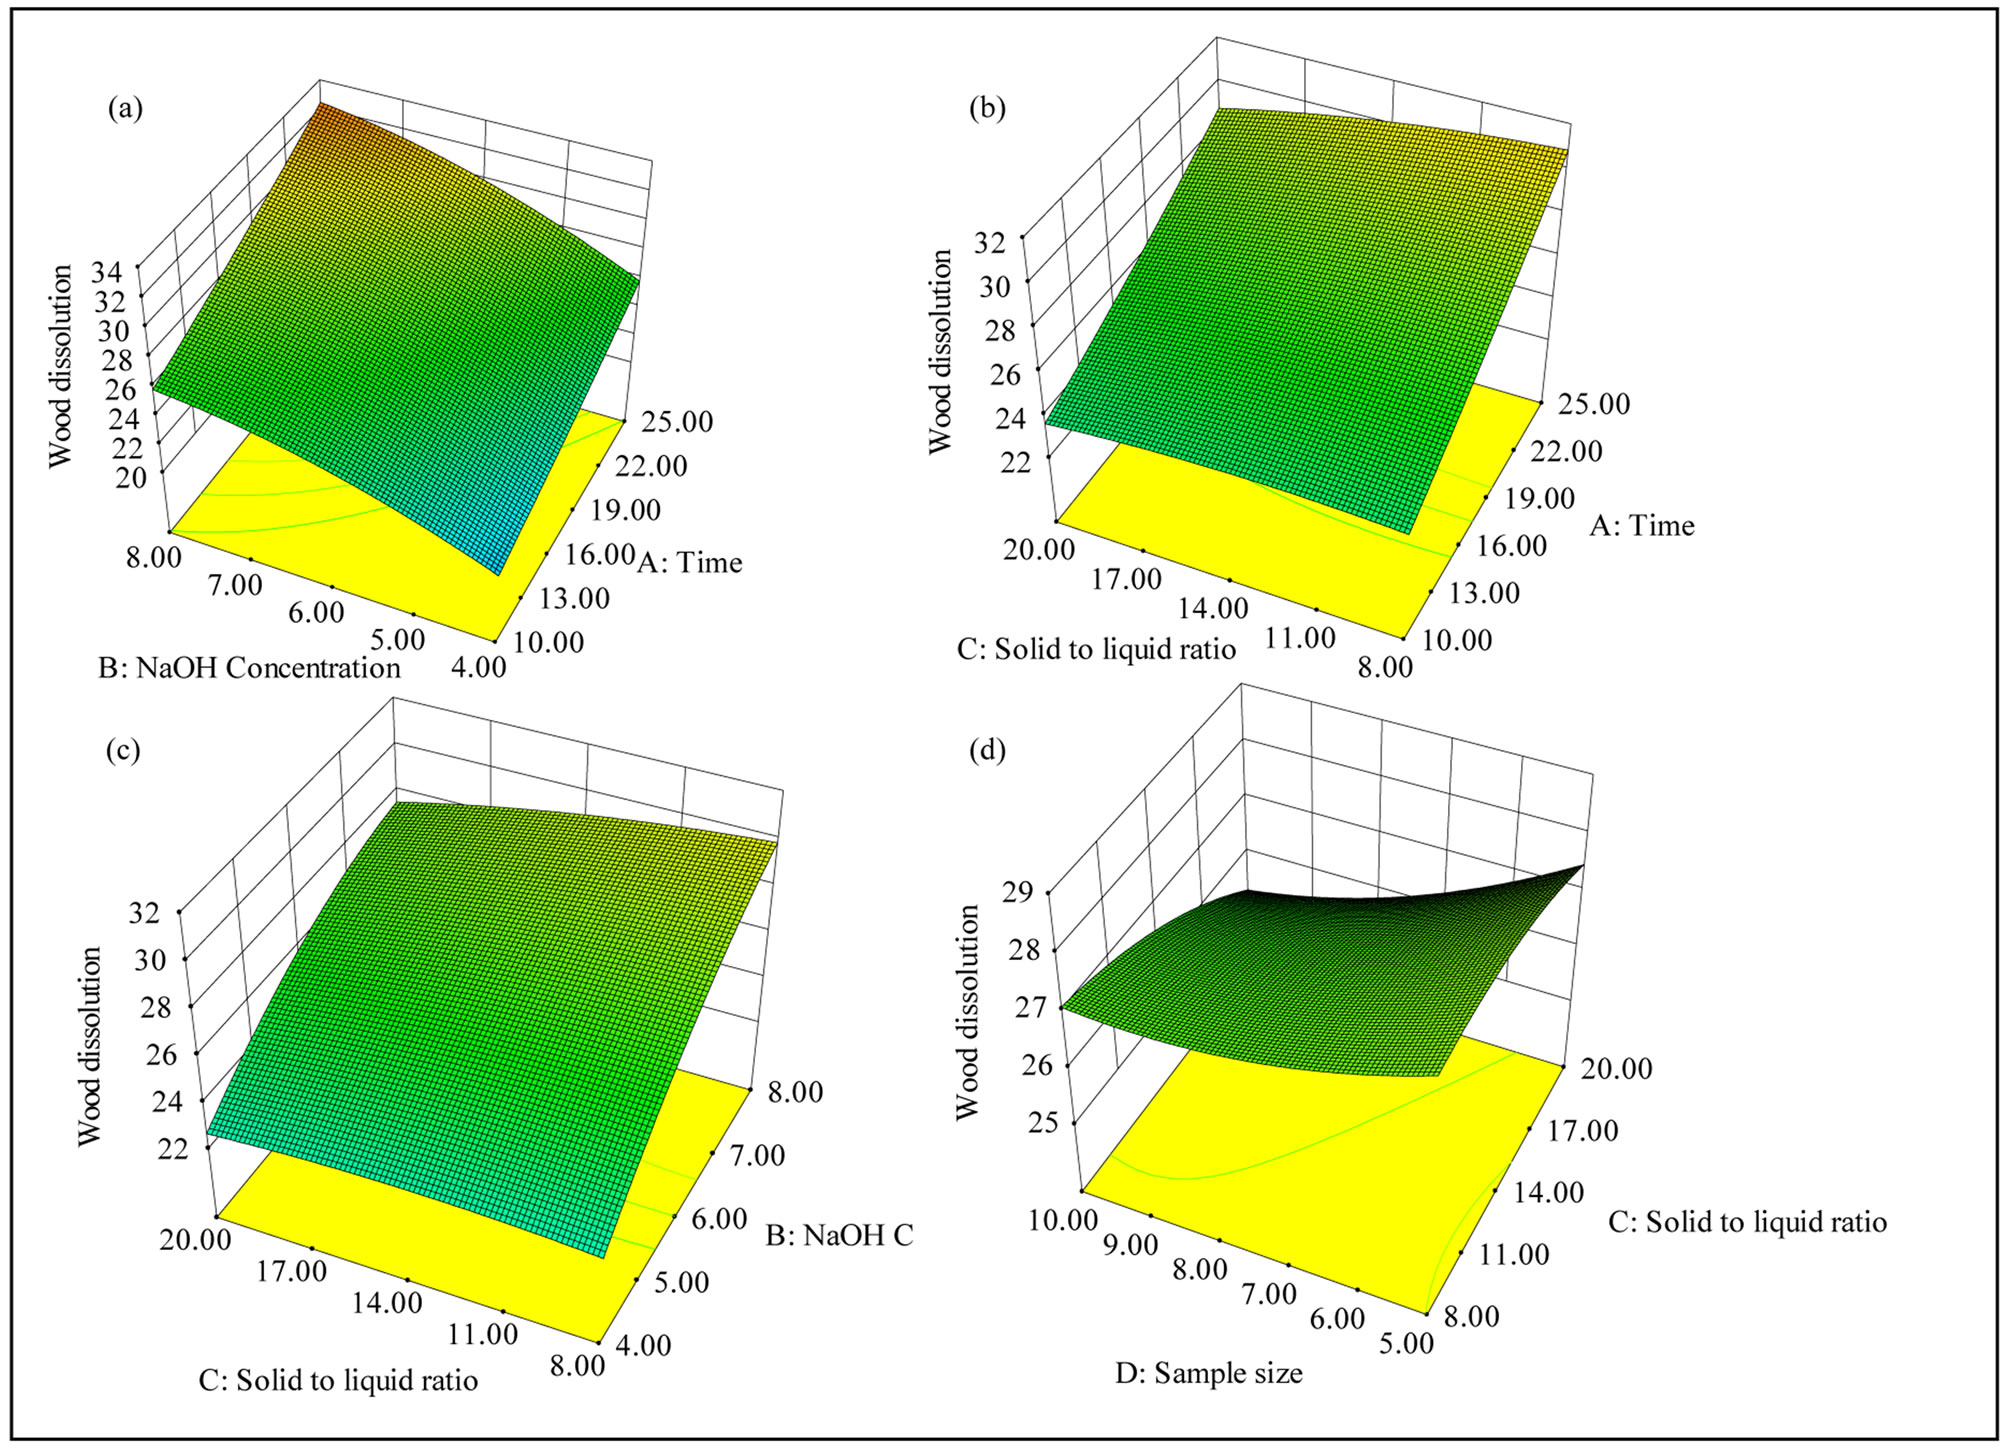
Figure 4. Response surface plots showing the interaction between the variables affecting the wood dissolution: (a) Interaction between time and NaOH solution concentration; (b) Interaction between time and solid to liquid ratio; (c) Interaction between solid to liquid ratio and NaOH concentration; (d) Interaction between solid to liquid ratio and sample size.
NaOH. Hence, 25 minutes of microwave irradiation of the slurry using 8 wt% of NaOH solution at a solid to liquid ratio of 1:8 (g/mL) is expected to provide a maximum amount of wood dissolution.
3.3. Effect of Extraction Variables on Yield of Xylan
The yield of xylan (based on oven dry wood) obtained in the CCD design are given in the Table 2. The lowest and highest yields of xylan obtained in the design space were 4.33% and 22.49% respectively (run #14 and #15). Lowest yield of xylan observed for the experiment corresponds to the lowest amount of wood dissolution where the levels of independent variables were: sodium hydroxide (−2, 2 wt%), time (0, 14 minutes), solid to liquid ratio (0, 1:14 g/mL) and sample size (0, 7.5 g). Contrary to the maximum wood dissolution (run #19), the highest yield of xylan (run #15) was obtained when all the independent variables are at the higher levels; extraction time (+1, 25 minutes), concentration of sodium hydroxide (+1, 8 wt%), solid to liquid ratio (+1, 1:20 g/mL), and sample size (+1, 10 g). The yield of xylan obtained for run #19, where maximum wood dissolution was observed, was 14.9%. The variation in yield can be attributed to the rise in temperature of the wood slurry. The temperature of the slurry after run #19 was 98.5˚C, whereas that of run #15 was 83.5˚C. High wood dissolution is expected at higher temperature, as the hydrolysis rate and dissolution of the hydrolyzed components (hemicelluloses and lignin) increase with the temperature. The high temperature generated might lead to the degradation of the hemicelluloses resulting in a low yield of xylan.
The effect of independent variables on the yield of xylan was studied using the surface response quadratic model given in the Table 3. The model was found to be significant from the values of regression coefficients (R2 = 0.9715 and adjusted R2 = 0.9450). The predicted R2 (0.8722) was closer to the adjusted R2 and would give a good fit to the statistical model used. The observed small standard deviation of the model (1.08) and the high adequate precision value (22.91) also indicates the reproducibility and applicability of the quadratic model for the prediction of yield of xylan. Figure 5 shows the predicted and actual yield of xylan obtained during the experimental design studied and the strong correlation observed (R2 = 0.9856) indicates the accuracy of the model.
The response surface contour plots of the significant interaction terms are shown in Figure 6. Figure 6(a) depicts effect of the interaction between time and solid to liquid ratio on the yield of xylan (NaOH concentration and sample size was kept at 6 wt% and 7.5 g respectively), whereas Figure 6(b) shows the effect of interaction between solid to liquid ratio and sample size (NaOH
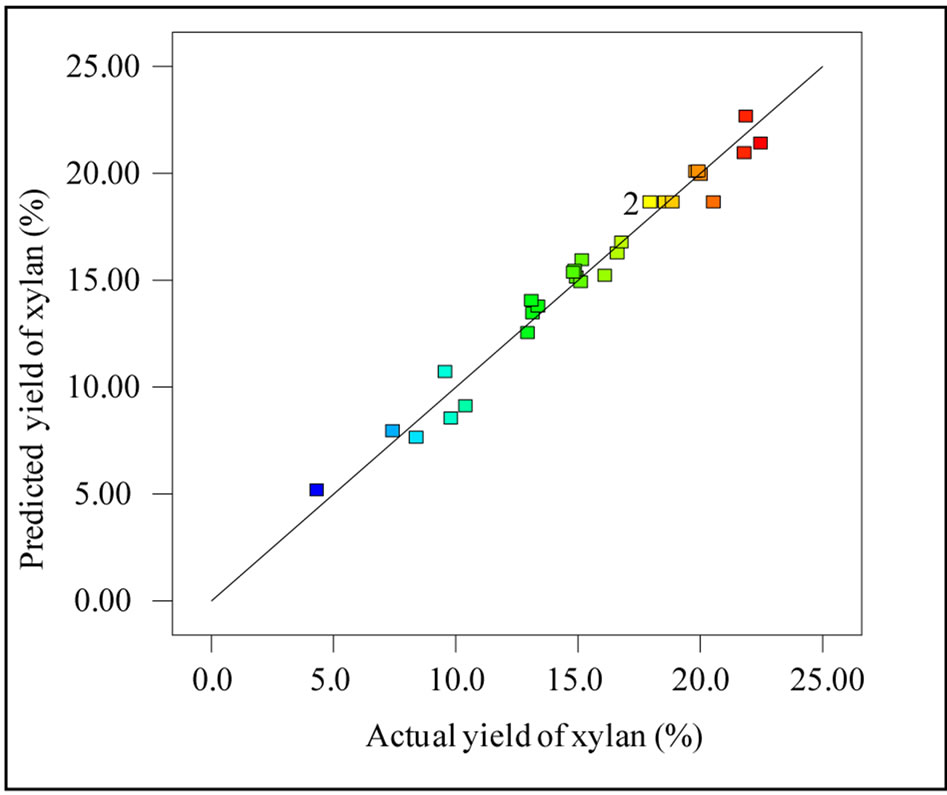
Figure 5. Actual yield of xylan vs predicted yield of xylan.
concentration and time of extraction was kept at a constant level of 6 wt% and 17.5 minutes respectively) on the yield of xylan. Larger sample size and smaller solid to liquid ratio resulted in a higher yield of xylan (Figure 6(b)), where as longer extraction time and larger solid to liquid ratio resulted comparatively higher yield. It is clear from all these results that larger sample size, higher concentration of NaOH, longer irradiation time, and smaller solid to liquid ratio would lead to a higher yield of xylan.
3.4. Optimization of Microwave Assisted Extraction of Xylan and Validation of the Model
The objective of the study was to find the microwave assisted extraction conditions that result in the highest yield of xylan from birch wood. The optimal extraction conditions for obtaining the highest yield of xylan were extracted by the Design Expert software using a numerical optimization. Several potential solutions were provided by the software, and based on the experimental feasibility, the following optimum operating settings were selected for obtaining a higher yield of xylan: time (A) = 25 minutes, NaOH concentration (B) = 8 wt%, solid to liquid ratio (C) = 1:8 g/mL, and sample size (D = 10 g. Four replicates of the extraction were performed at this optimal extraction conditions. The results of the extraction with the respective predicted values are given in the Table 5.
Based on the numerical optimization condition selected, the maximum yield predicted was 22.66% (OD wood basis) with a standard deviation of 1.08. The predicted wood dissolution, and temperature at this point were 33.53% (standard deviation 0.36) and 96.46˚C (standard deviation 0.69) respectively. The yield of xylan, wood dissolution, and temperature of the slurry obtained
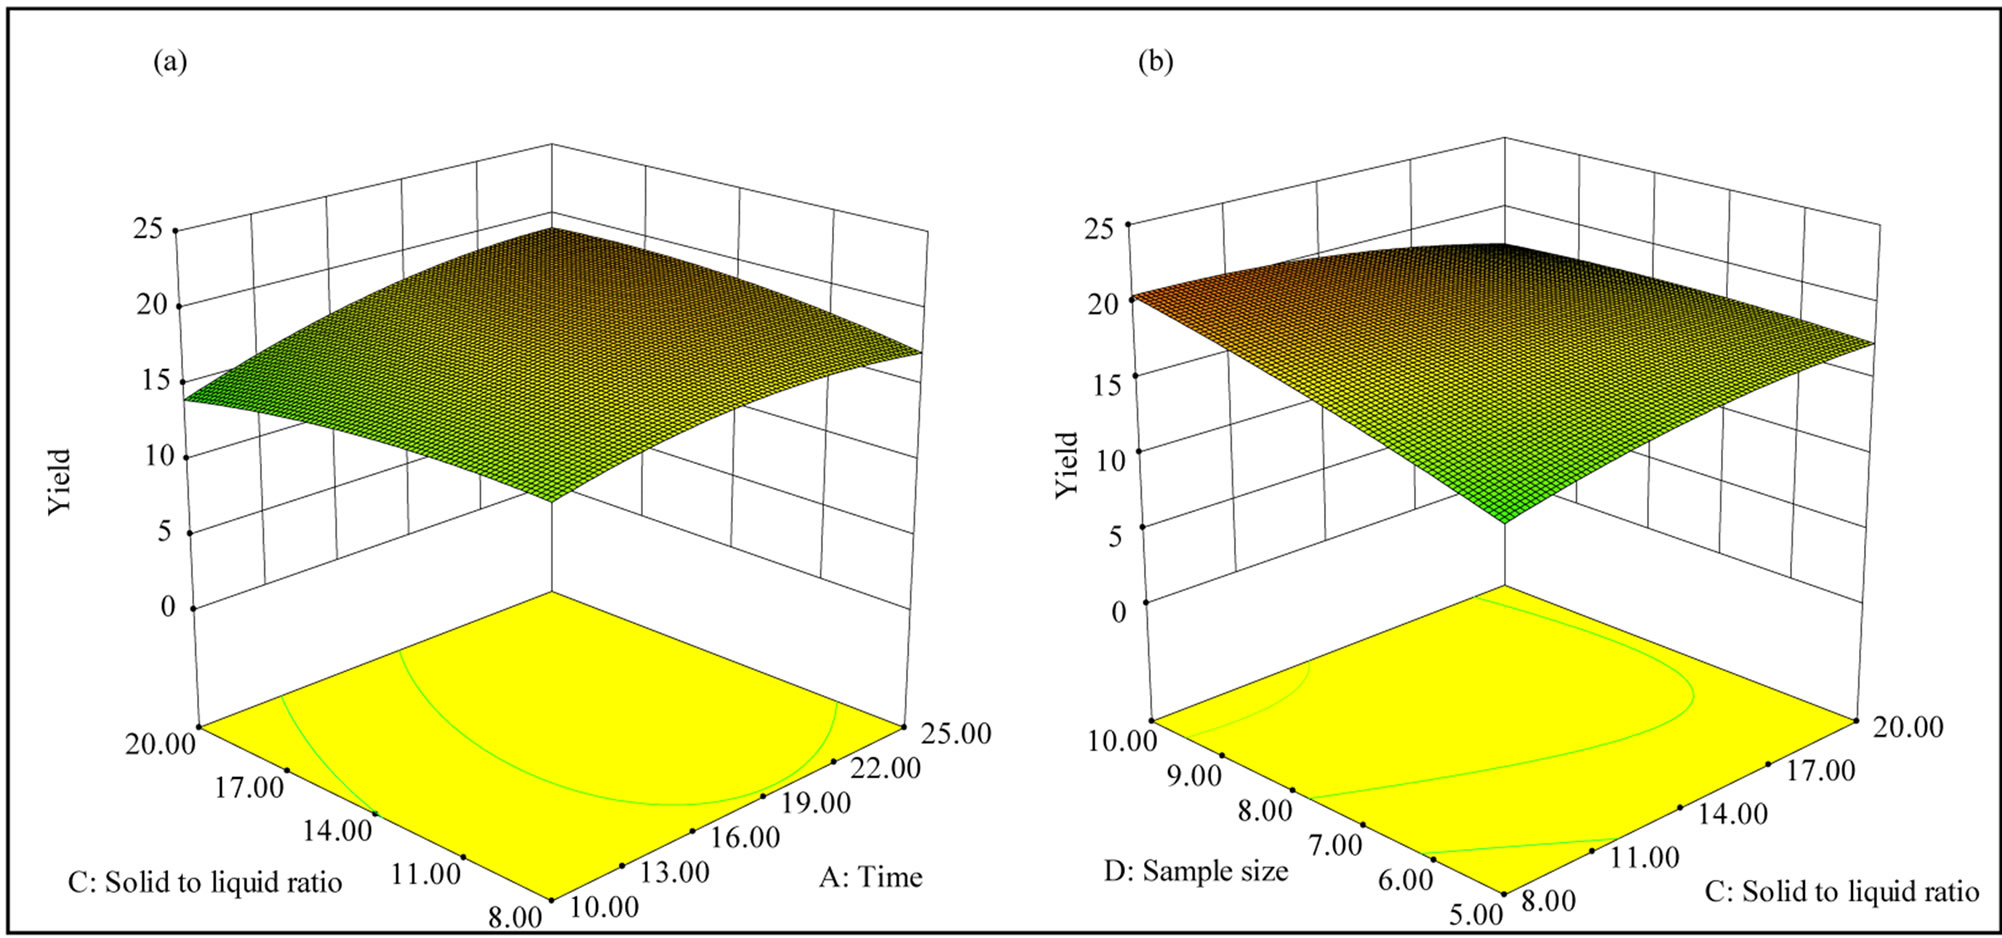
Figure 6. Response surface plots showing the interaction between the variables affecting the yield of xylan: (a) Interaction between time and solid to liquid ratio; (b) Interaction between solid to liquid ratio and sample size.
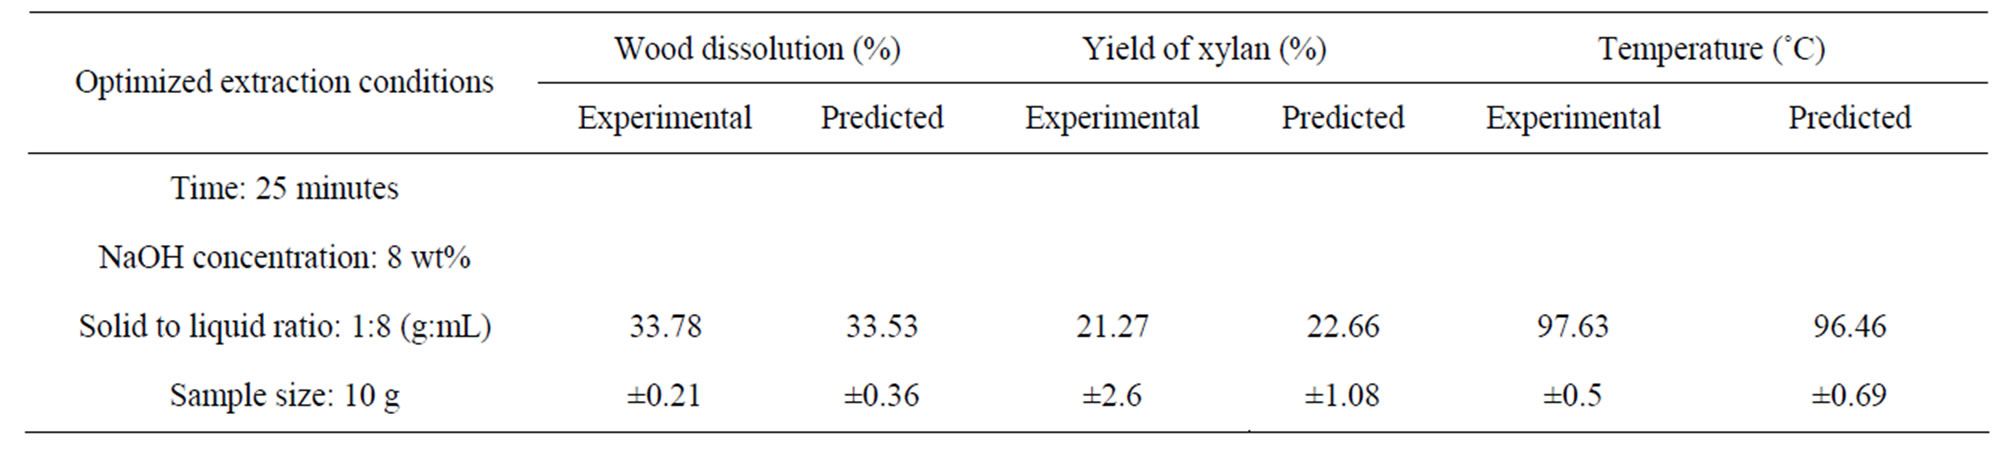
Table 5. Experimental and predicted values of wood dissolution, yield of xylan, and temperature at the optimum extraction conditions used for the alkaline extraction of xylan.
were 21.27% ± 2.65%, 33.78% ± 0.21%, and 97.67% ± 0.47% respectively. The experimental values obtained were found to be in good agreement with the values calculated from the models suggesting that the quadratic surface models were adequate for the optimization of microwave assisted extraction under study. Wood used for this study contained 29.35% of xylan. Conversion of the yield of xylan obtained based on oven dry basis of wood to that of original xylan present in wood indicated that about 72.5% of the xylan present in birch wood can be extracted by 25 minutes of low temperature microwave assisted extraction. Though there is no available literature for direct comparison, Sun et al. [17] reported that a low temperature alkaline extraction of wheat provided 76.4% of xylan, when wheat straw was treated with 1.5% NaOH at solid loading of 2.5% dry matter for 144 hours at room temperature. It is clear that great reduction in the extraction time can be obtained using microwave assisted extraction for a similar yield of xylan. In a recent study [31] using microwave assisted alkaline extraction, a similar type of xylan yield (73.6%) was reported in the supernatant obtained from wheat straw extraction. The respective reaction conditions reported were 5% NaOH solution at a temperature of 140˚C with 10 minutes preheating time and 10 minutes of residence time for 3.5 g of wheat straw with a solid to liquid ratio of 1:10 using an input power of 265 W. A total of 14 g of samples were used for extraction in a single batch. The energy input for the extraction can calculated as the multiple of the power input into the reaction chamber and the sum of the preheating and residence time in seconds. The energy calculated for this extraction was 318 kJ and the energy input per g of wheat straw calculated as 22.7 kJ/g. In our study, the energy input at the optimized extraction conditions for getting maximum yield of xylan was calculated as 66 kJ and the energy input per g of wood fibres was 6.6 kJ/g. Though it is not appropriate to compare two different raw materials, it is clear that optimization of the reaction conditions are necessary to obtain maximum yield of xylan with lower input of energy.
4. Conclusion
Central composite design and surface response methodology were employed to optimize the low-temperature microwave assisted alkaline extraction of xylan from birch wood. The effect of four extraction parameters (time, alkali concentration, solid to liquid ratio and sample size) on the temperature of the wood slurry, wood dissolution, and yield of xylan were studied. Three quadratic polynomial models were developed to correlate the extraction variables with the three responses. Analysis of variance (ANOVA) of the models developed indicated the statistical significance of the models for the prediction of each response studied. Temperature of the slurry, and wood dissolution were significantly influenced by all the four extraction parameters, whereas the yield of extraction was not affected by the linear effect of solid to liquid ratio. Process optimization was conducted to maximize the yield of xylan and the experimental values obtained for the respective yield of xylan, wood dissolution and temperatures were found to agree satisfactorily with the quadratic model used for xylan extraction. Optimum conditions used for the maximum extraction of xylan from birch wood under microwave irradiation were: 10 g of wood fibres, 8 wt% of NaOH solution, 1:10 solid to liquid ratio (g:mL) and 25 minutes of irradiation time. 22 wt% of xylan (OD) was obtained from about 34% of the dissolved wood at the optimal extraction conditions.
5. Acknowledgements
The authors acknowledge the financial assistance provided by the Ontario Research Fund-Research Excellence (ORE-RE) for conducting this research.
REFERENCES
- G. O. Aspinall, “Structural Chemistry of the Hemicelluloses,” In: M. L. Wolfrom and R. S. Tipson, Eds., Advances in Carbohydrate Chemistry, Academic Press, London, 1959, pp. 429-468.
- F. Carvalheiro, L. C. Duarte and F. M. Girio, “Hemicelluloses Biorefineries: A Review on Bio-Mass Pre-Treatments,” Journal of Scientific and Industrial Research, Vol. 67, No. 11, 2008, pp. 849-864.
- A. Ebringerova, “Structural Diversity and Application Potential of Hemicelluloses,” Macromolecuar Symposia, Vol. 232, No. 1, 2006, pp. 1-12. http://dx.doi.org/10.1002/masy.200551401
- N. M. L. Hansen and D. Plackett, “Sustainable Films and Coatings from Hemicelluloses: A Review,” Biomacromolecules, Vol. 9, No. 6, 2008, pp. 1493-1505. http://dx.doi.org/10.1021/bm800053z
- I. Gabrielii, P. Gatenholm, W. G. Glasser and R. K. Jain, “Separation, Characterization and Hydrogel Formation of Hemicelluloses from Aspen Wood,” Carbohydrate Polymers, Vol. 43, No. 4, 2000, pp. 367-374. http://dx.doi.org/10.1016/S0144-8617(00)00181-8
- S. Daus and T. Heinze, “Xylan Based Nanoparticles: Pro-Drug for Ibuprofen Release,” Macromolecular Bioscience, Vol. 10, No. 2, 2010, pp. 211-220. http://dx.doi.org/10.1002/mabi.200900201
- D. Fengel and G. Wegener, “Wood: Chemistry, Ultrastructures, Reactions,” W. De Gruyter, Berlin, New York, 1984.
- E. Sjostrom, “Wood Chemistry Fundamentals and Applications,” 2nd Edition, Academy Press Inc., San Diego, 1993.
- A. Ebringerova and T. Heinze, “Xylan and Xylan Derivatives—Biopolymers with Valuable Properties, 1. Naturally Occurring Xylans Structures, Isolation Procedures and Properties—A Review,” Macromolecular. Rapid Communications, Vol. 21, No. 9, 2000, pp. 542-556. http://dx.doi.org/10.1002/1521-3927(20000601)21:9<542::AID-MARC542>3.0.CO;2-7
- F. B. Sedlmeyer, “Xylan as By-Product of Biorefineries: Characteristics and Potential Use for Food Applications,” Food Hydrocolloids, Vol. 25, No. 8, 2011, pp. 1891- 1898. http://dx.doi.org/10.1016/j.foodhyd.2011.04.005
- L. Ramos, “Chemistry Involved in the Steam Treatment of Lignocellulosic Materials,” The Química Nova, Vol. 26, No. 6, 2003, pp. 863-871. http://dx.doi.org/10.1590/S0100-40422003000600015
- G. Garrote, M. A. Kabel, H. A. Schols, E. Falque, H. Dominguez and J. C. Parajo, “Effects of Eucalyptus Globulus Wood Autohydrolysis Conditions on the Reaction Products,” Journal of Agriculture and Food Chemistry, Vol. 55, No. 22, 2007, pp. 9006-9013. http://dx.doi.org/10.1021/jf0719510
- A. U. Buranov and G. Mazza, “Extraction and Characterization of Hemicelluloses from Flax Shives by Different Methods,” Carbohydrate Polymers, Vol. 79, No. 1, 2010, 17-25. http://dx.doi.org/10.1016/j.carbpol.2009.06.014
- W. G. Glasser, W. E. Kaar, R. K. Jain and J. E. Sealey, “Isolation Options for Non-Cellulosic Heteropolysaccharides,” Cellulose, Vol. 7, No. 3, 2000, pp. 299-317. http://dx.doi.org/10.1023/A:1009277009836
- P. Kumar, D. M. Barret, M. J. Delwiche and P. Stroeve, “Methods for Pretreatment of Lignocellulosic Biomass for Efficient Hydrolysis and Biofuel Production,” Industrial Engineering and Chemistry Research, Vol. 48, No. 8, 2009, pp. 3713-3729. http://dx.doi.org/10.1021/ie801542g
- T. Persson, J. L. Ren, E. Joelsson and A. S. Jonsson, “Fractionation of Wheat and Barley Straw to Access High-Molecular-Mass Hemicelluloses Prior to Ethanol Production,” Bioresource Technology, Vol. 100, No. 17, 2009, pp. 3906-3913. http://dx.doi.org/10.1016/j.biortech.2009.02.063
- R. Sun, J. M. Lawther and W. B. Banks, “Influence of Alkali Pre-Treatment on Wheat Straw Cell Wall Components,” Industrial Crops and Products, Vol. 4, No. 2, 1995, pp. 127-145. http://dx.doi.org/10.1016/0926-6690(95)00025-8
- P. Binod, R. Sindhu, R. R. Singhania, S. Vikram, L. Devi, S. Nagalakshmi, N. Kurien, R. K. Sukumaran and A. Pandey, “Bioethanol Production from Rice Straw: An Overview,” Bioresource Technology, Vol. 101, No. 13, 2010, pp. 4767-4774. http://dx.doi.org/10.1016/j.biortech.2009.10.079
- C. O. Kappe, “Microwave Dielectric Heating in Synthetic Organic Chemistry,” Chemical Society Reviews, Vol. 37, No. 6, 2008, pp. 1127-1139. http://dx.doi.org/10.1039/b803001b
- N. Sombatsompop and C. Kumnuantip, “Comparison of Physical and Mechanical Properties of Nr/Carbon Black/ Reclaimed Rubber Blends Vulcanized by Conventional Thermal and Microwave Irradiation Methods,” Journal of Applied Polymer Science, Vol. 100 No. 6, 2006, 5039- 5048. http://dx.doi.org/10.1002/app.23472
- V. Singh, A. Tiwari, P. Kumari and A. K. Sharma, “Microwave Accelerated Synthesis and Characterization of Poly(Acrylamide),” Journal of Applied Polymer Science, Vol. 104, No. 6, 2007, pp. 3702-3707. http://dx.doi.org/10.1002/app.25682
- A. Kržan and M. Kunaver, “Microwave Heating in Wood Liquefaction,” Journal of Applied Polymer Science, Vol. 101, No. 2, 2006, pp. 1051-1056. http://dx.doi.org/10.1002/app.23488
- H. Ooshima, K. Aso and Y. Harano, “Microwave Treatment of Cellulosic Materials for Their Enzymatic Hydrolysis,” Biotechonology Letters, Vol. 6, No. 5, 1984, pp. 289-294.
- P. Kitchaiya, P. Intankul and M. Krairish, “Enhancement of Enzymatic Hydrolysis of Lignocellulosic Wastes by Microwave Pre Treatment under Atmospheric Pressure,” Journal of Wood Chemistry and Technology, Vol. 23, No. 2, 2003, pp. 217-225. http://dx.doi.org/10.1081/WCT-120021926
- S. D. Zhu, Y. X. Wu, Z. N. Yu, J. T. Liao and Y. Zhang, “Pretreatment by Microwave/Alkali of Rice Straw and Its Enzymatic Hydrolysis,” Process Biochemistry, Vol. 40, No. 9, 2005, pp. 3082-3086. http://dx.doi.org/10.1016/j.procbio.2005.03.016
- Z. H. Hu and Z. Y. Wen, “Enhancing Enzymatic Digestibility of Switch Grass by Microwave Assisted Alkali Pre Treatment,” Biochemical Engineering Journal, Vol. 38, No. 3, 2008, pp. 369-378. http://dx.doi.org/10.1016/j.bej.2007.08.001
- M. Palm and G. Zacchi, “Extraction of Hemicellulosic Oligosaccharides from Spruce Using Microwave Oven or Steam Treatment,” Biomacromolecules, Vol. 4, No. 3, 2003, pp. 617-623. http://dx.doi.org/10.1021/bm020112d
- A. Roos, T. Persson, H. Krawczyk, G. Zacchi and H. Stalbrand, “Extraction of Water-Soluble Hemicelluloses from Barley Husks,” Bioresource Technology, Vol. 100, No. 2, 2009, pp. 763-769. http://dx.doi.org/10.1016/j.biortech.2008.07.022
- T. Yoshida, S. Tsubaki, Y. Teramoto and J. Azuma, “Optimization of Microwave Assisted Extraction of Carbohydrates from Industrial Wastes of Corn Starch Production Using Response Surface Methodology,” Bioresource Technology, Vol. 101, No. 20, 2010, pp. 7820-7826. http://dx.doi.org/10.1016/j.biortech.2010.05.011
- P. Binod, R. Satyanagalakshmi, R. Sindhu, K. U. Janu, R. K. Sukumaran and A. Pandey, “Short Duration Microwave Assisted Pretreatment Enhances the Enzymatic Saccharification and Fermentable Sugar Yield from Sugarcane Bagasse,” Renewable Energy, Vol. 37, No. 1, 2012, pp. 109-116. http://dx.doi.org/10.1016/j.renene.2011.06.007
- I. J. Obermeir, V. Seiber, M. Faulstich and D. Scheider, “Solubilization of Hemicellulose and Lignin from Wheat Straw through Microwave-Assisted Alkali Treatment,” Industrial Crops and Products, Vol. 39, 2012, pp. 98- 203.
- S. Panthapulakkal, V. Pakhrenko and M. Sain, “Microwave Assisted Short-Time Alklaine Extraction of Birch Wood,” Journal of Polymers and Environment, 2013.
- D.C. Montgomery, “Design and Analysis of Experiments,” 5th Edition, Wiley, New York, 2001.
- State-Ease, “User’s Guide,” Version 8.0.7.1, Design Expert Software, Inc., Minneapolis.
- J. Lü and P. Zhou, “Optimization of Microwave-Assisted FeCl3 Pretreatment Conditions of Rice Straw and Utilization of Trichoderma Viride and Bacillus Pumilus for Production of Reducing Sugars,” Bioresource Technology, Vol. 102, No. 13, 2011, pp. 6966-6971. http://dx.doi.org/10.1016/j.biortech.2011.04.044
- C. S. Goh, H. T. Tan, K.T. Lee and N. Brosse, “Evaluation and Optimization of Organosolv Pretreatment Using Combined Severity Factors and Response Surface Methodology,” Biomass and Bioenergy, Vol. 35, No. 9, 2011, pp. 4025-4033. http://dx.doi.org/10.1016/j.biombioe.2011.06.034
- N. Ender Us and A. Perendeci, “Improvement of Methane Production from Greenhouse Residues: Optimization of Thermal and H2SO4 Pretreatment Process by Experimental Design,” Chemical Engineering Journal, Vol. 181- 182, 2012, pp. 120-131. http://dx.doi.org/10.1016/j.cej.2011.11.038
- G. Brudecki, I. Cybulska and K. Rosentrater, “Optimization of Clean Fractionation Process Applied to Switch Grass to Produce Pulp for Enzymatic Hydrolysis,” Bioresource Technology, Vol. 131, 2013, pp. 101-112. http://dx.doi.org/10.1016/j.biortech.2012.12.118
- D. R. Keshwani, “Microwave Pretreatment of Switch Grass for Bio-Ethanol Production,” Ph.D. Thesis, North Carolina State University, Raleigh, 2009
- A. Koubaa, P. Perre, R. M. Hutcheon and J. Lessard, “Complex Dielectric Properties of Sapwood of Aspen, White Birch, Yello Birch and Sugar Maple,” Drying Technology, Vol. 26, No. 5, 2008, pp. 568-578. http://dx.doi.org/10.1080/07373930801944762
NOTES
*Corresponding author.