Open Journal of Business and Management
Vol.1 No.2(2013), Article ID:33997,9 pages DOI:10.4236/ojbm.2013.12007
An Investigation of the Correlation among the Technology Mode, Service Evidence and Service Quality from a Customer Perspective
1Department of Business Administration, Tamkang University, Taiwan
2Department of Management Sciences, Tamkang University, Taiwan
Email: jthome@ms14.hinet.net
Copyright © 2013 Chu Ching Wang et al. This is an open access article distributed under the Creative Commons Attribution License, which permits unrestricted use, distribution, and reproduction in any medium, provided the original work is properly cited.
Received April 14, 2013; revised May 28, 2013; accepted June 14, 2013
Keywords: Technology Role; Paradoxes of Technology; Service Evidence; Service Blueprint; Service Process; Service Quality
ABSTRACT
Service is a complex process that too difficult to display in written mode due to its intangibility and abstract. The 3 Ps— People, Process, and Physical evidence—which are called the “service evidence”, this research will use these 3 Ps as the dimensions to measure the service evidence. Froehle and Roth [1] presented five different types of technology role used in the process of customer contact, this research also regard these different types as the different “types of technology role”. Whether it is opportunity or threat for the service organization after the technology used in the service process will be determined by customer’ perception; therefore, this study will measure the value based on the whole perception of customers to service quality (i.e., the five dimensions of service quality for PZB). In other words, the five types of technology role will be regarded as the situational variable, the customers’ value perception to service evidence as the independent variable, and the customers’ perception to whole service quality as the dependent variable in this study. This study is a qualitative exploratory research. The data were collected through the review of mass articles and the discussion of Focus Group members, and then analyzed and inferred the data by induction and deduction methods. Some important research results as followings: 1) A conceptual model of the relationships among “types of technology role”, “service evidence”, and “service quality” is constructed; 2) There are differences existing in different types of technology role which are perceived by customers; 3) Four propositions are submitted based on the implications of the model.
1. Introduction
Technology applications, specifically information technologies (IT) that have emerged in the past half century, provide industries and organizations with opportunities for expansion and reinforcement. IT applications simultaneously enhance convenience and diversity for users (i.e., customers). Therefore, to develop and establish industry competitiveness or advantages, organization decision makers frequently introduce favorable and suitable technologies that can provide customers with more efficient and beneficial services.
Since the Industrial Revolution, manpower has been gradually substituted with technology (i.e., machines), with this practice being widely adopted in the manufacturing industry. By contrast, determining when technology was implemented in the service industry is difficult. Nevertheless, Judd [2] categorized IT applications in the service industry into two primary types—personnel-focused and equipment-focused applications, according to variations in service providers. This categorization suggests that technological applications are a key factor of service industry operations.
Rapid technological advances have an unprecedented impact on the service industry. Technology not only provides more diverse service channels, but also changes various service-assisting methods. Previously, the service industry focused on the contact and interaction between service providers and customers. However, this concept has been challenged by current technologization and automation trends that enable customers to conduct transactions over the telephone, Internet, television, and even by debit card. Technologized services possess advantages such as a high speed, accessibility regardless of time or location, and cost efficiency. Nevertheless, this service type also leads to problems related to maintaining provider-customer relationships, such as customer resistance or rejection of technologized services, transaction security, environmental awareness (e.g., the environmental effects of high-speed trains and metro systems) and personal privacy protection. These issues negatively influence the development of a technologized service industry (i.e., e-service). Although e-business is considered a crucial method for gaining and retaining competitive advantage in a globalized economic environment, numerous cases of e-business failure exist. This implies that technological applications can create risks instead of opportunities for organizations, Melao [3].
When customers effectively employ self-service technology (SST) to receive services, the service provision efficiency and customer satisfaction in service industries that adopt this technology increase (Bitner, Brown, & Meuter [4]; Van der Wal, Pampallis, & Bond, [5]; Trusov, Bucklin, & Pauwels, [6]). However, not all customers are willing to use this IT application. Bitner et al. [7] reported that, despite recognizing SST as beneficial, customers may refuse to adopt the technology when they have a lack of familiarity and/or they are unprepared to use it. This shows that although industries share the strategic goal of increasing customers by employing SST, this technology can reduce customer satisfaction and loyalty despite its potential benefits and cost savings (The Economist [8]; Alcock & Millard, [9]). Therefore, businesses must consider customer willingness to use SST when incorporating this technology in their marketing efforts. In other words, customer willingness to adopt technology when receiving services is crucial to the performance of businesses in the service industry.
Mick and Fournier [10] conducted quantitative research exploring customer reactions to technology; these reactions were compiled into the “eight paradoxes of technology”, which suggested that technology can generate positive or negative customer perceptions. Generally, customers’ willingness to adopt a new technology improves as their positive perceptions increase or their negative perceptions decrease regarding this technology. Furthermore, Hackbarth, Grover, and Yi [11] asserted that customer acceptance of a technology increases with the ease of use. How a technology is applied (i.e., its role) typically determines a customer’s perceptions of its value during the delivery of service. This phenomenon has been elucidated by Froehle and Roth (2004) 11, who categorized the roles of technology into the following five customer contact modes: technology-free, technology-assisted, technology-facilitated, technology-mediated and technology-generated.
Service typically involves a complex process that is intangible, abstracted, and difficult to delineate (Zeithaml, Bitner, & Gremier [12]. Thus, adequately designing and effectively managing the entire service process is challenging. Recently, international scholars including Melao (2009) and Ozyilmaz and Berg [13] have actively investigated the reinforcement of the role of IT in service workflows (designs) to enhance efficiency and service differentiation. The quality of service workflow design determines the subsequent performance of the entire service process, and further influences customer perceptions of service value. Consequently, the objective and systematic development and design of the service process is essential (George & Marshall, 1984 [14]; Effendi & Prochazka [15]) and application of the service blueprint technique is an effective strategy for service workflow design (Flieb & Kleinaltenkamp [16]). The three primary elements of a service blueprint are the 3 Ps of the service industry, that is, people (including service personnel and customers), process and physical evidence. Therefore, based on the three types of service evidence presented above, customers’ positive or negative evaluations of technological applications were adopted as the measurement indicators of this study to assess whether technological applications generate opportunities or risks (or value creation) for service organizations.
Numerous factors affect customer assessments of service value, such as service quality, product quality, price and personal and situational factors. Service quality is the most crucial for determining customer satisfaction; it refers to the difference between customers’ expectations and perceptions of the service. If their perceptions after receiving services are greater than or equal to their prepurchase expectations, customers are satisfied or even pleasantly surprised. Conversely, if their perceptions of the service are inferior to their expectations, customers regard the service as valueless and experience dissatisfaction. A commonly accepted and employed tool for evaluating service quality is the SERVQUAL measurement scale developed by Parasuraman, Zeithaml and Berry [17]. SERVQUAL, which is also referred to as RATER, comprises the five dimensions—reliability, assurance, tangibles, empathy and responsiveness. Whether opportunities or risks for the service organization are generated by the 1) construction of a service blueprint from a customer perspective, or 2) technological applications is determined by customer satisfaction with the entire service delivery process. Consequently, this study adopted the technological application modes mentioned previously as the situational variables, and the customer’s overall preceptions of service quality as the variables for measuring the value that technological applications provide to the service organization.
A survey study of 500 businesses in Australia found that IT investments in the service and manufacturing industries are beneficial for both improving productivity and reducing costs. Specifically, the service industry exhibited a significantly greater increase in product and service value compared to the manufacturing industry. In addition, IT investments directly affect the strategy development of internal IT departments in the service industry. The primary obstacles to IT success are economic factors, insufficient support from high-level management and difficulty justifying costs (Sohal, Moss, & Ng, [18]).
Based on the above discussion, the following three key concepts of service success were identified: 1) a highperformance (value) service delivery process; 2) the level of service performance (value) is determined by customer perceptions and co-creation; and 3) appropriate applications of technology are required to enhance service performance (value). These three points support one another and indicate that a high-performance service organization can be distinguished by the following characteristics: 1) possesses a streamlined service workflow design that satisfies customers; 2) provides services that customers consider high quality; and 3) cautiously and effectively applies technology to the service workflow. These corresponding concepts introduce the theme of this study, that is, an investigation of the correlation among the technology mode, service evidence, and service quality from a customer perspective. This study performed investigatory and qualitative research to identify a generalized conceptual model. Only services provided by the financial industry were adopted as the research scope. Thus, data was collected by conducting an extensive literature review and focus group, and then analyzed using qualitative generalizations and the deductive method.
2. Research Objectives
Do technological applications create value or burdens for customers? In other words, do they generate opportunities or risks for organizations? Furthermore, what type of role can technology play to reduce conflict between organizations and customers? These questions were thoroughly investigated in this study. To fully understand these questions, the service blueprint technique simplified by Kingman-Brundage [19] was adopted as the construct for delivering the entire service workflow for all service industries. The study then investigated the correlation between the 3 Ps (i.e., service personnel, process and physical evidence) in a service blueprint, the five modes regarding the role of technology (i.e., technologyfree, technology-assisted, technology-facilitated, technology-mediated and technology-generated customer contact) and the eight paradoxes of technology established by Mick and Fournier (1998). The results of previous studies were generalized to construct a conceptual model, and research propositions were developed based on the model implications. Because this study was a qualitative exploratory study, the specific objectives were as follows:
1) To investigate customer perceptions regarding the value of technology when applied to various service types;
2) To conduct an extensive literature review and construct a conceptual model regarding the value of technology when applied to various service types;
3) To develop research propositions based on the constructed conceptual model.
3. Literature Review
3.1. The Effect of Technology on Service Industry Management
The services marketing triangle is frequently mentioned in studies related to operational management in the service industry, such as that conducted by Gronroos [20], Kotler [21] and Bitner [22]. This triangle shows the interconnectedness between a company, its service personnel and its customers. The marketing interactions between these three entities are known as internal marketing, external marketing and interactive marketing. However, the traditional service model has been significantly influenced by recent progress and prevalent applications of technology. In other words, the introduction of technology significantly affects a company, its service personnel and customers, leading to the transformation of their interrelationships from a 2D triangle into a 3D pyramid. This effect of technology refers to the direct or indirect exposure to technology experienced by a company, service personnel and customers during the delivery process of a service system. Although e-business is considered a key method for maintaining competitive advantage in a globalized economic environment, both the benefits and disadvantages of technology adoption are evidenced in numerous cases of e-business failure (Melao, 2009). Figure 1 shows the service marketing interrelationships before and after the introduction of technology.
3.2. Various Modes Regarding the Role of Technology
Advances in communication and IT systems have altered the interaction interface between customers and service providers. Therefore, numerous service providers employ technological applications to influence customers’ perceptions of services received. Froehle and Roth (2004) investigated technology-customer contact and identified five modes for the role of technology during customer contact, as shown in Figure 2. Each of these modes elucidates the role technology plays in the service delivery of five types of customer contact. The five modes are summarized using the following examples:
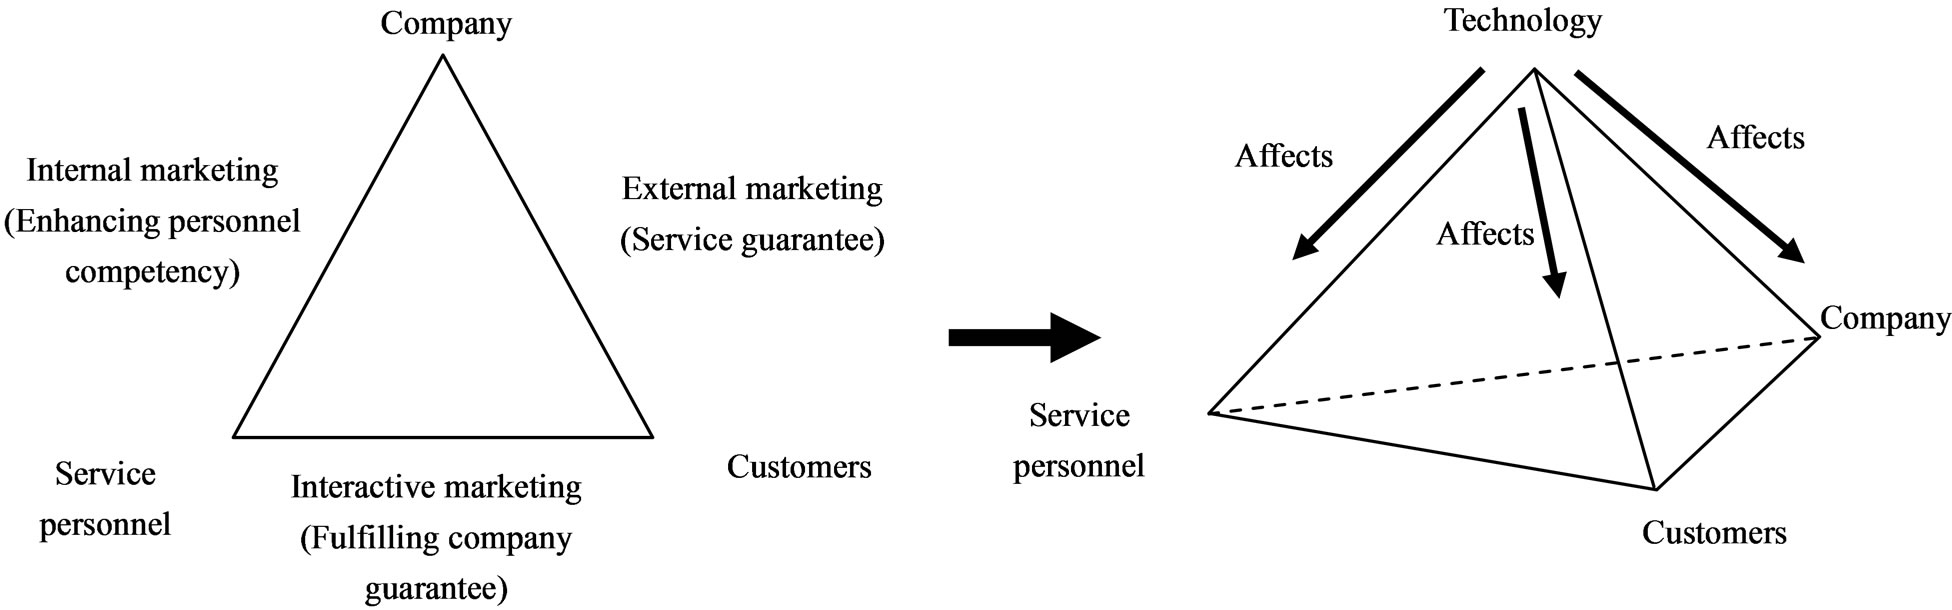
Figure 1. Comparison between the traditional service triangle and the modern service pyramid. Source: Kotler, 1994, p. 470.
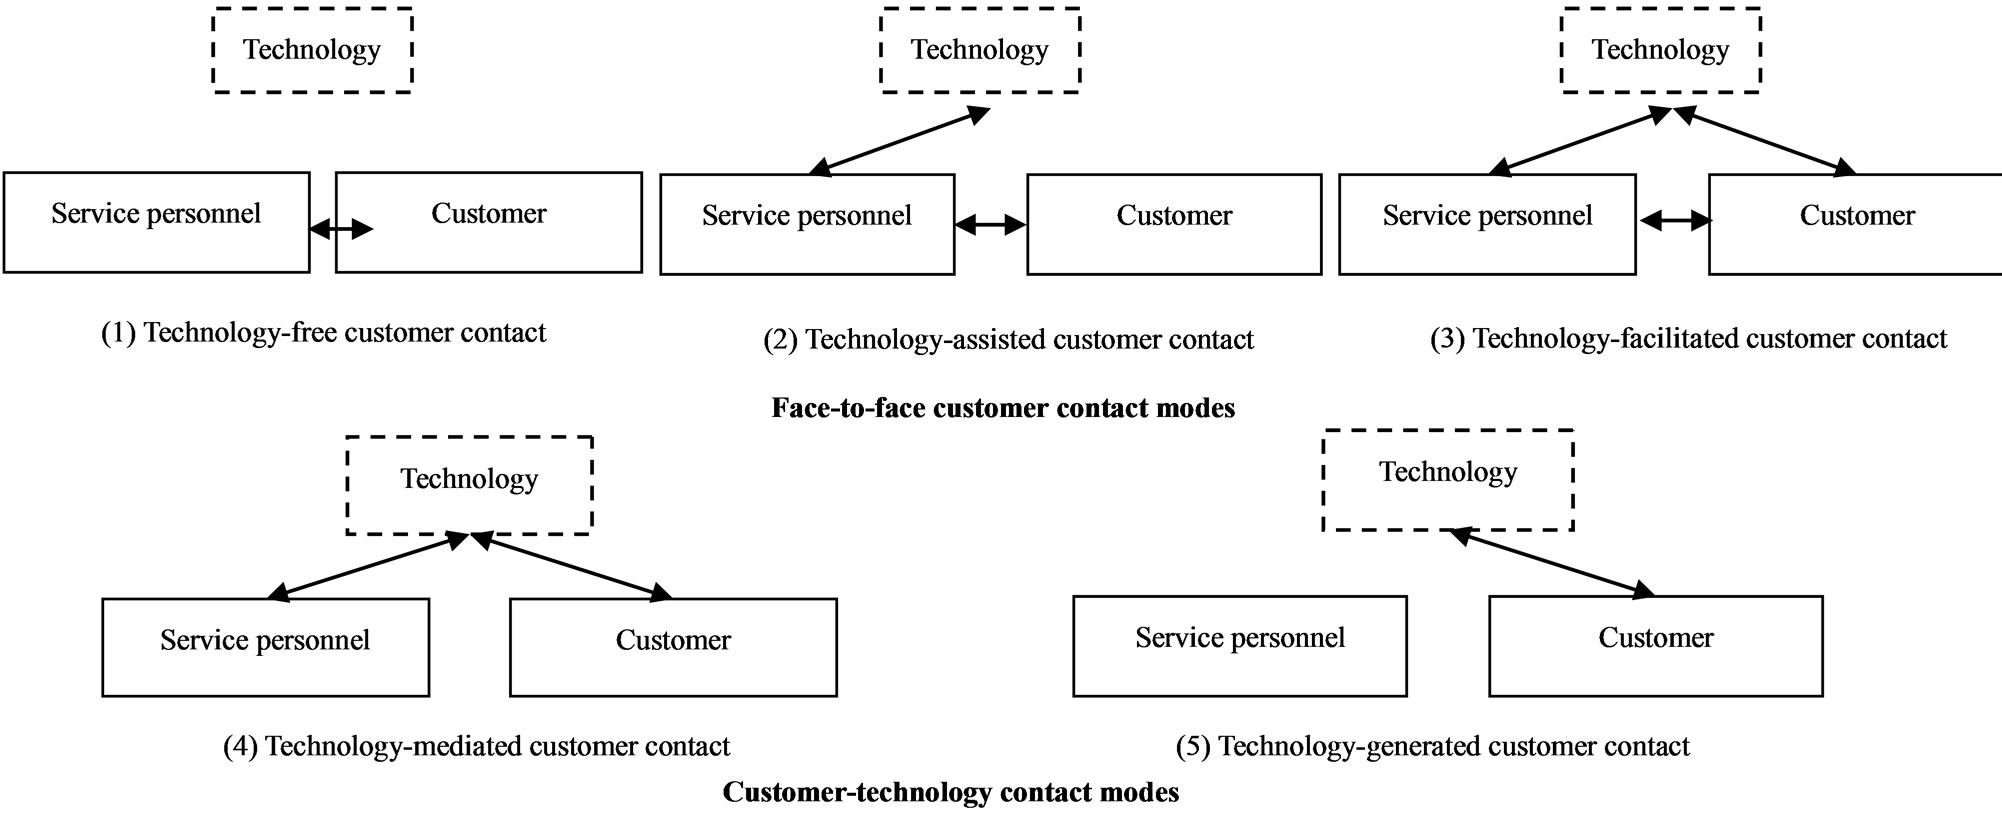
Figure 2. Five modes regarding the role of technology in customer contact. Source: Froehle and Roth, 2004, p. 3.
1) Technology-free customer contact For example, the face-to-face contact between a psychological therapist and patient. This type of contact does not require the use of technology; thus, it is the most traditional and direct mode of customer contact.
2) Technology-assisted customer contact For example, hotel check-in and check-out procedures, transactions conducted over manned bank counters, and passenger check-ins for airline boarding. During these processes, technology (i.e., a computer) is used by the service personnel only. However, the customer and service personnel still experience face-to-face contact.
3) Technology-facilitated customer contact For example, the use of Microsoft PowerPoint by a financial expert to present and discuss financial plans with customers during a conference. Although technology is used by both parties, face-to-face customer contact still occurs.
4) Technology-mediated customer contact For example, telephonic interaction between service personnel and customers and the provision of professional advice by a consulting company using Videoconference technology. In these contexts, a shared technological platform is used by the service personnel and the customer without face-to-face contact.
5) Technology-generated customer contact For example, ATM withdrawals, vending machine purchases, or coin-operated automatic photograph booth operations. In these processes, customers operate the technology without the assistance of service personnel, and face-to-screen contact replaces face-to-face customer contact. The recent trend of online shopping is considered an example of this mode.
3.3. Applications of Service Blueprinting
Service blueprinting is an analytical method that adopts a revolutionary service provision process. To increase the probability of success and the profits of a service organization, service blueprinting is employed in the service delivery process. This technique also reduces redundant tasks of no added value to enhance service efficiency.
Shostack [23] determined that workflow is the basis of all services, and a service blueprint can solve problems related to service workflow, such as incompatibility, simplification, bias and interpretation. Consequently, a service blueprint can be employed to elucidate and define the content of each workflow and the correlation between workflows. Shostack [24] asserted that a service system comprises the following three main elements: service process, means, and evidence. Researchers such as Tax and Stuart [25] and Flieb and Kleinaltenkamp (2004) have investigated the effect of service blueprinting on service organization performance (e.g., service efficiency and customer satisfaction), and have unanimously found benefits of including service blueprinting in service design. The service blueprint technique introduced by Shostack [26] is an effective tool for describing the service process and service evidence by clearly defining personnel, process and physical evidence through visualization. Furthermore, this technique shows all the activities included in a service, and, thus, is beneficial for identifying opportunities and risks in service environment management.
Zeithaml, Berry, and Parasuraman (1996) asserted that service quality can be improved in the following three dimensions: 1) physical evidence, including facilities and equipment, atmosphere, labels and guidelines; 2) service personnel’s character, including reliability, enthusiasm, credibility, and empathy; and 3) the service process, including precision and delay management. Most services are intangible and unlikely to leave a lasting and objective impression on customers without personal experience. The three dimensions foregoing are crucial to customers’ overall perceptions and evaluation of service quality; therefore, they are also known as service evidence (Bitner, 1995). Furthermore, these dimensions are the three primary elements of a service blueprint, that is, the 3 Ps that comprise the discrepancy between the service marketing 7 Ps and the traditional 4 Ps.
3.4. The Effect That the Five Technology Roles Have on the Three Primary Elements of Service Blueprints
This study adopted the simplified service blueprint developed by Kingman-Brundage (1989) as the framework for understanding the paradoxes of technology created by the five modes regarding the role of technology (i.e., technology-free, technology-assisted, technology-facilitated, technology-mediated, and technology-generated customer contact) for the three primary elements of the service blueprint (i.e., service personnel, process, and physical evidence). These paradoxes refer to customers’ positive or negative evaluations and the opportunities (benefit) or risks (disadvantage) for the service organization. Brief explanations are provided below.
1) Technology-free customer contact In technology-free customer contact, service provision relies solely on service personnel’s face-to-face delivery method. Therefore, the service delivery is inefficient and untimely, and the service quality perceived by the customer varies according to the service personnel. Furthermore, each service personnel do not necessarily provide a consistent service quality. Similarly, because personnel provide services to customers without technological assistance, the probability of errors when customers receive services is higher compared to technology-assisted delivery (Kingman-Brundage, 1989). Regarding physical evidence, applications of new technology equipment affect customer awareness of service quality and the stability of the service provided, thereby influencing customers’ satisfaction and overall impressions of the business. Consequently, service providers adopting technologyfree customer contact can lose a certain degree of competitive advantage.
2) Technology-assisted customer contact When personnel-only technology use is combined with face-to-face customer contact, personnel have positive effects on customer perceptions. Bitner [27] reported that technologies such as customer relationship management and sales management systems can assist frontline personnel in providing customers with more comprehensive and suitable services, thereby enhancing service quality. Bitner (2001) also identified the negative effects of this contact mode, that is, service delivery remains a timeconsuming process because face-to-face communication is still required. According to Garbarino and Johnson [28], overall satisfaction comprises customer assessments of various layers of the service organization, such as the core services, structure and physical environment. This suggests that physical evidence is included in consumers’ evaluation criteria during face-to-face contact with service personnel. Thus, service organizations adopting this contact mode must emphasize the promotion of positive evaluations of face-to-face contact.
3) Technology-facilitated customer contact With technological advances, IT has become the foundation for providing technology-facilitated customer contact in organizations that were previously limited to faceto-face service provision. In this contact mode, technology allows service personnel to communicate with customers at the same location. IT adoption enables both parties to communicate face-to-face in real time, thereby increasing efficiency and reducing errors. In addition to greater convenience for personnel and customers, technological assistance can improve customers’ understanding of the communication content, thereby enhancing their positive evaluations.
4) Technology-mediated customer contact In this contact mode, service personnel communicate with customers using technology. In the personnel dimension, Bitner (2001) asserted that the lack of direct face-to-face contact is detrimental to the quality of interpersonal relationships. However, in the process dimension, customers prefer this mode compared to technologygenerated customer contact. Furthermore, Bitner (2001) stated that customers appreciate the service organization’s willingness to provide online support for difficulties encountered when using SST-based services. According to MacDonald and Smith [29], this mode of the technology role can provide more rapid and personalized customer services, and generate greater benefits for the business. Thus, this form of technology introduction is acceptable to some customers despite being inferior to technology-facilitated and technology-generated customer contact.
5) Technology-generated customer contact This mode of the technology role refers to SST. Since customers self-operate the technological equipment without personnel-customer communication, the interaction between customers and personnel is changed accordingly. The positive or negative effects of interaction with personnel are replaced by the positive or negative effects of interaction with the physical equipment. Current technology-generated customer contact enables customers to access Internet services that were previously limited to business-designated machines, such as online transfers or payments, using their mobile phones.
3.5. The Correlation between Service Quality and the Three Primary Elements of Service Blueprints
A service organization’s overall service performance is based on customers’ perceptions of the entire service process, and service quality is the most crucial indicator for evaluating service provider performance. Therefore, this study adopted service quality as the composite indicator used by customers to assess technological applications in the three primary service evidence types of the service process. In other words, service quality was set as the criterion to determine whether technology applications generate opportunities or risks for the service organization. This study employed the five service quality dimensions established by Parasuraman, Zeithamal and Berry (subsequently referred to as PZB [30], which are widely known, commonly adopted and remain unchallenged. To evaluate service quality, these five dimensions were set as the main dimensions, and the PZB-developed SERVQUAL scale was adopted.
1) Five main dimensions of service quality The PZB’s five dimensions of service quality, namely, reliability, assurance, tangibles, empathy and responsiveness (i.e., RATER), are not described further because they are commonly known.
2) Correlation between service quality and service evidence Based on the above discussion, technological applications exhibit significant positive and negative effects on the three primary service evidence types during the delivery process. Because of the intangible nature of the service industry and the characteristics of customer experience, particular service performances are unlikely to be strongly perceived or remembered by customers. Consequently, the three primary service evidence types that are more likely to be remembered, that is, service personnel, service process and physical evidence, are crucial to customers’ perceptions of the overall service quality. Because the quality of service process designs affect customers’ perceptions of the service quality level, a causal relationship exists between service process and service quality. This study used customers’ perceptions of the overall service quality as an indicator to evaluate whether technology applications are beneficial or disadvantageous (i.e., generate opportunities or risks) to the service workflow based on the following reasons: 1) the entire service process comprises multiple minor workflows that represent various service phases; and 2) service process is an antecedent variable for service quality perceptions; thus, obtaining customer satisfaction with various service phases directly from customers is difficult. This leads to questions regarding the correlation between service quality and the three primary elements of a service blueprint (service evidence types). According to the definition of each service quality dimension, the three primary service evidence types all influence customers’ perceptions of each dimension; therefore, they exhibit a significant correlation.
4. Research Methodology
4.1. A Conceptual Framework
The main objective of this study was to investigate the potential opportunities and risks resulting from the implementation of technology under various modes in the service industry. In other words, this study examined the opportunityor risk-generating effects (i.e., customer perceptions of service quality) that the five technology modes (i.e., technology-free, technology-assisted, technology-facilitated, technology-mediated and technologygenerated customer contact) have on the three primary elements of service process (i.e., service personnel, process and physical evidence) following service organizations’ adoption of technology applications. The conceptual framework of this study is shown in Figure 3.
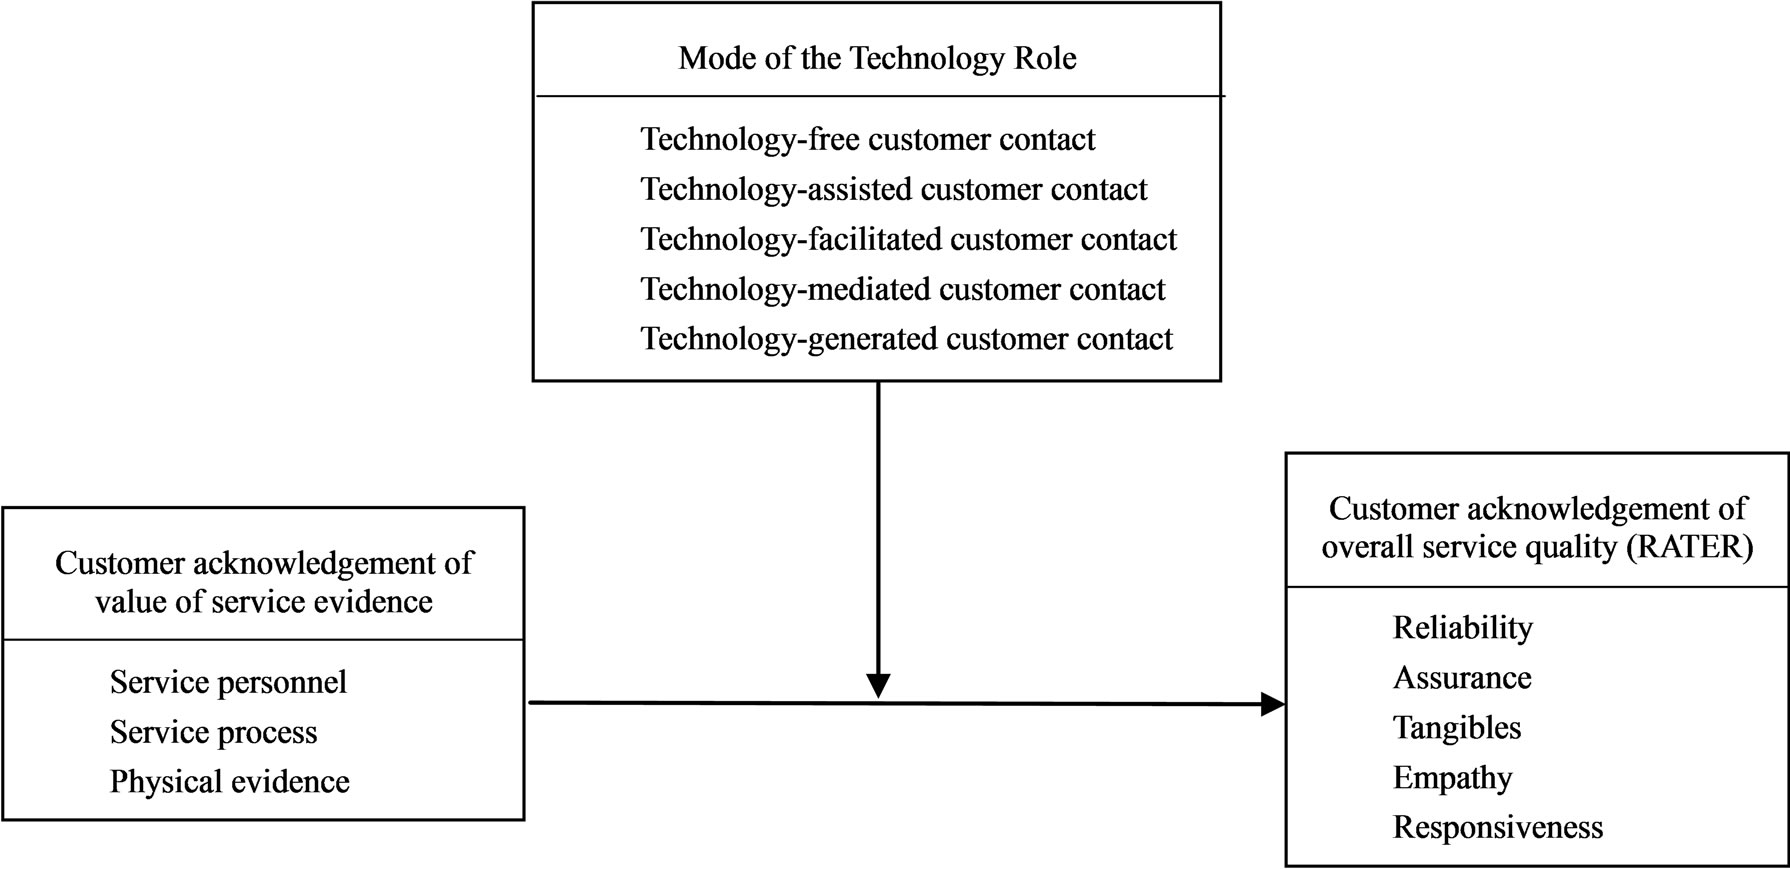
Figure 3. Conceptual framework.
4.2. Definition of Variables
1) Independent variables: Service workflow design (including the three primary service evidence types, i.e., the 3 Ps)
a) Service personnel: personnel of the service organization who participate in customer contact, including onsite personnel with face-to-face contact and those who interact using technology (e.g., telephones).
b) Service process: the entire process from customer service requests to service delivery.
c) Physical evidence: tangibles that customers perceive using their senses during the service process, including service facilities, on-site environment, instructional signs, business cards, and service personnel uniforms.
2) Dependent variables: Service quality (i.e., PZB’s five main dimensions, RATER)
a) Reliability: the ability to be relied on by customers and to accurately provide the guaranteed service.
b) Assurance: service personnel’s knowledge, politeness, and ability to promote customer trust and confidence.
c) Tangibles: the service organization’s external appearance, including the physical facilities, equipment, personnel and written information.
d) Empathy: customer care and personalized concern.
e) Responsiveness: willingness to assist the customers and provide timely services.
3) Situational variables: the mode of the technology role (i.e., the five primary modes)
a) Technology-free customer contact: During the service process, face-to-face contact between service personnel and customers is required, whereas the use of technology is not.
b) Technology-assisted customer contact: During the service process, technology is used by service personnel but not by customers, and face-to-face contact between the two parties is still required.
c) Technology-facilitated customer contact: During the service process, both service personnel and customers use technology combined with face-to-face interaction.
d) Technology-mediated customer contact: During the service process, service personnel and customers use a shared technology platform without face-to-face interaction.
e) Technology-generated customer contact: During the service process, technology is operated by the customer only without face-to-face interaction with service personnel. This is the so-called face-to-screen platform service.
4.3. Research Scope, Data Collection and Analysis Method
This study conducted innovative research and disregards the results of previous objective studies could not provide empirical evidence or a theoretical basis for the research hypotheses. Thus, a preliminary investigation was performed instead of an immediate confirmative examination. Data were collected by conducting a qualitative literature review and focus group. An extensive range of literature was reviewed to generalize and construct a conceptual model, and inter-variable correlations were identified during a five-member focus group discussion. Finally, the research propositions were established based on these correlations.
Regarding the research scope of this study, the financial industry was selected as the subject of the focus group discussion. In addition to the significance of this industry, as explained previously in the Introduction sec-
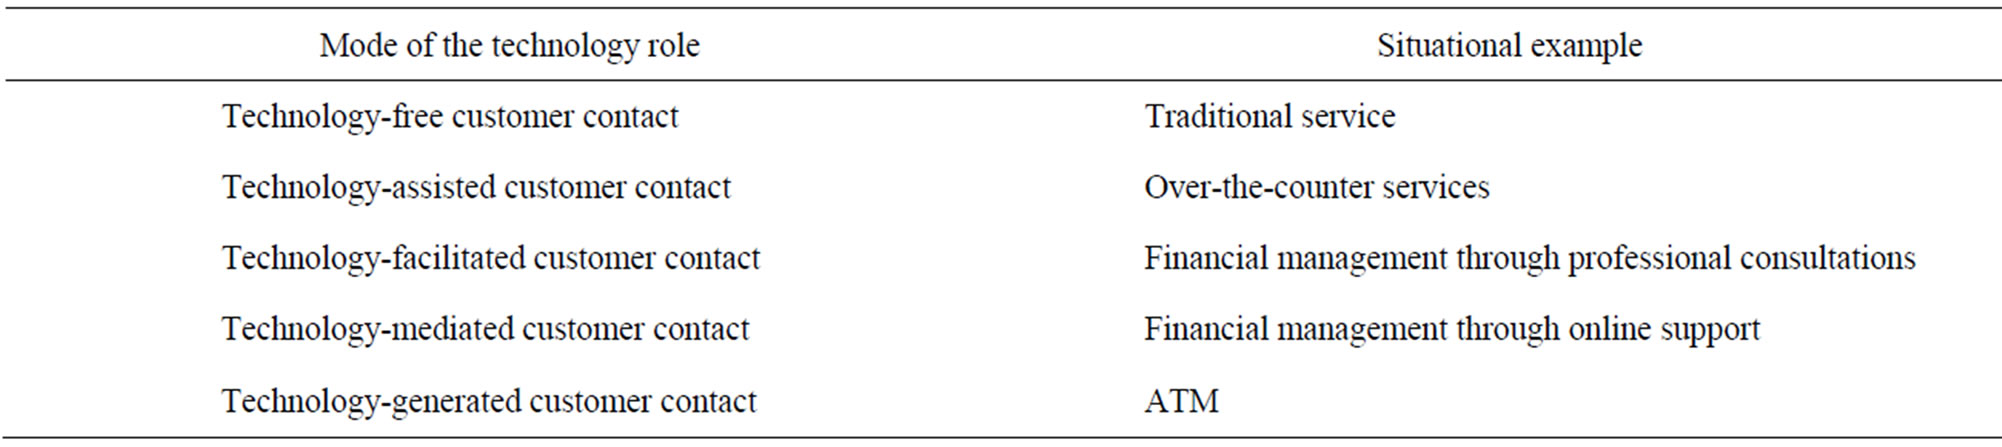
Table 1. Situational examples for the focus group discussion.
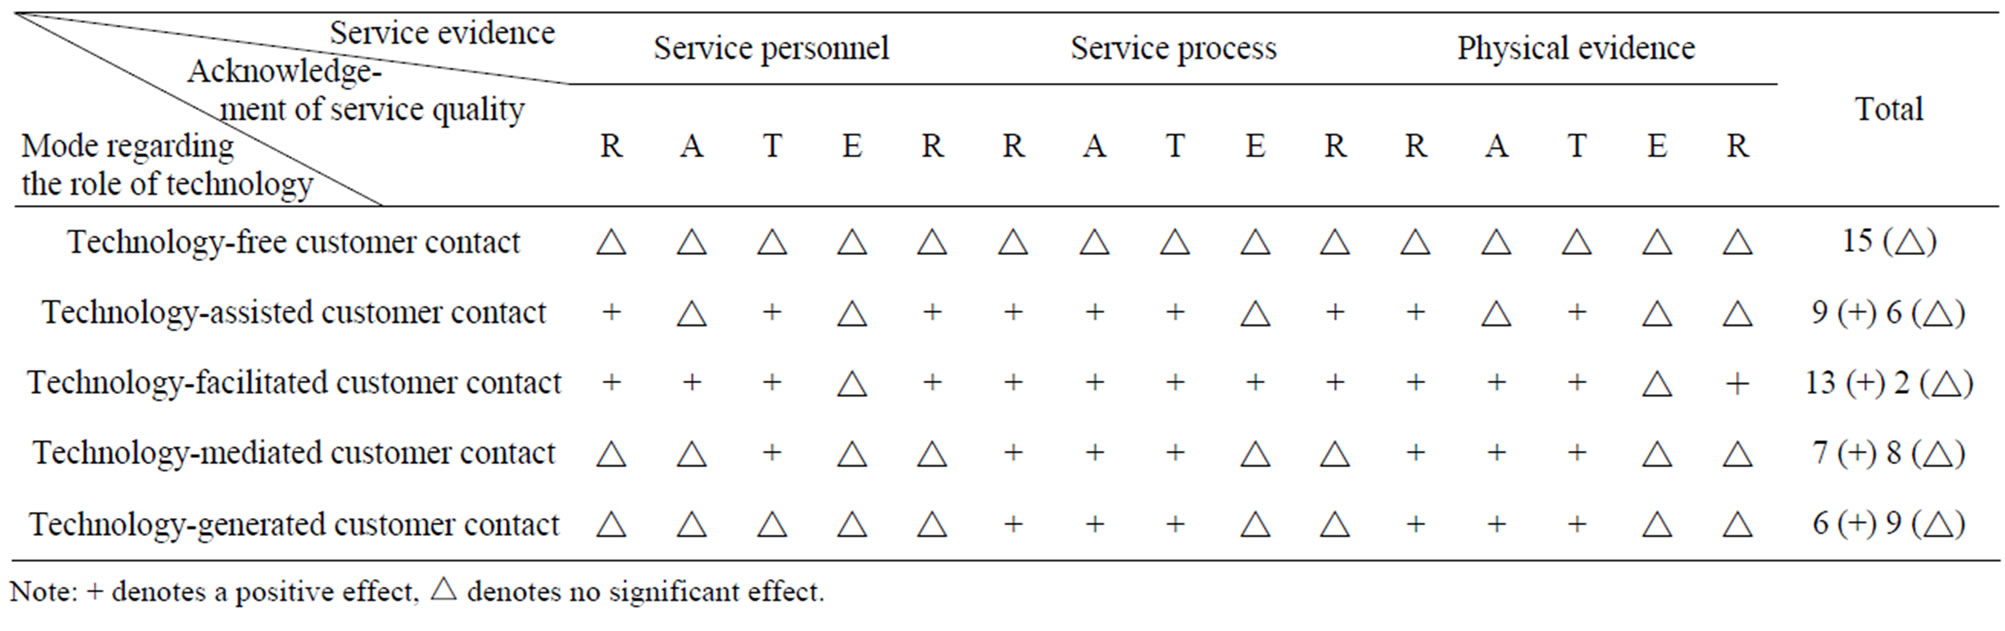
Table 2. Correlational model of the mode of the technology role, service evidence, and service quality in the financial industry.
tion, the financial industry was selected because technology adoption is prevalent and substantial, and all five modes for the role of technology investigated in this study can be identified. Situational examples discussed during the focus group are shown in Table 1.
5. Results
5.1. Conceptual Model for Identifying the Correlation between the Mode of the Technology Role, Service Evidence, and Service Quality
A 3-hour focus group discussion was conducted with five participants employed in various industries (i.e., an IT manager, a bank vice president, a bank manager, an electronics engineer and the researcher). Table 2 shows a correlation model established based on the focus group’s discussion of the correlation between the mode of the technology role, service evidence and service quality in the financial industry. The following findings were derived from the correlation model: 1) The value contributions of the various technology modes to the service industry can be ranked as follows (from high to low): technology-facilitated, technology-assisted, technology-mediated, and technology-generated customer contact. The first two listed are face-to-face customer contact modes, and the last two are customer-technology contact modes. 2) The degree of value contributed to the service industry varies according to the mode of technology used.
5.2. Research Propositions
Implications regarding the correlation between the mode of the technology role, service evidence, and service quality are shown in Table 2. Based on these implications, the following four research propositions were established:
Proposition 1: Customer perceptions of the value of various service evidence types differ according to the mode of the technology role.
Proposition 2: Customer perceptions of the value of overall service evidence differs according to the mode of the technology role.
Proposition 3: Regarding customer perceptions, technology contributes a greater value to service personnel than to customers.
Proposition 4: Face-to-face interaction between service personnel and customers remain crucial for generating service value.
REFERENCES
- C. M. Froehle and A.V. Roth, “New Measurement Scales for Evaluating Cognizances of the Technology-Mediated Customer Service Experience,” Journal of Operations Management, Vol. 22, 2004, pp. 1-21. doi:10.1016/j.jom.2003.12.004
- R. C. Judd, “The Case for Redefining Services,” Journal of Marketing, Vol. 28, No. 1, 1964, pp. 58-59. doi:10.2307/1249228
- N. Melao, “E-Business Processes and E-Business Process Modeling: A State-of-the-Art Overview,” International Journal of Services Technology and Management, Vol. 11, No. 3, 2009, pp. 293-322. doi:10.1504/IJSTM.2009.024094
- M. J. Bitner, M. L. Meuter, A. L. Ostrom and R. I. Roundtree, “Self-Service Technologies: Understanding Customer Satisfaction with Technology-Based Service Encounters,” Journal of Marketing, Vol. 64, No. 3, 2000, pp. 50-64. doi:10.1509/jmkg.64.3.50.18024
- R. W. E. Van der Wal, A. Pampallis and C. Bond, “Service Qualuty in a Cellular Telecommunications Company: A South African Experience,” Managing Service Quality, Vol. 12, No. 5, 2002, pp. 323-335. doi:10.1108/09604520210442119
- M. Trusov, R. E. Bucklin and K. Pauwels, “Effects of Word-of-Mouth versus Traditional Marketing: Findings from an Internet Social Networking Site,” Journal of Marketing, Vol. 73, No. 5, 2009, pp. 90-102. doi:10.1509/jmkg.73.5.90
- M. J. Bitner, M. L. Meuter and R. I. Rounctree, “SelfService Technologies: Understanding Customer Satisfaction with Technology-Based Service Encounter,” Journal of Marketing, Vol. 64, No. 3, 2000, pp. 50-64. doi:10.1509/jmkg.64.3.50.18024
- The Economist, 18 September 2004, p. 20.
- T. Alcock and N. Millard, “Self-Service—But Is It Good to Talk?” BT Technology Journal, Vol. 25, No. 3-4, 2007, pp. 313-320. doi:10.1007/s10550-007-0088-3
- D. G. Mick and S. Fournier, “Paradoxes of Technology: Consumer Cognizance Emotions, and Coping Strategies,” Journal of Consumer Research, Vol. 25, No. 2, 1998, pp. 123-143. doi:10.1086/209531
- G. Hackbarth, V. Grover and M. Y. Yi, “Computer Playfulness and Anxiety: Positive and Negative Mediators of the System Experience Effect on Perceived Ease of Use,” Information & Management, Vol. 40, No. 3, 2003, pp. 221-232. doi:10.1016/S0378-7206(02)00006-X
- V. A. Zeithaml, M. J. Bitner and D. D. Gremier, “Services Marketing: Integrating Customer Focus across the Firm,” 5th Edition, The McGraw-Hill Companies, Inc., New York, 2009.
- A. Ozyilmaz and D. Berg, “The Role of Information Technology in Service Innovation in the Two Different Quadrants of the Service-Process Matrix,” International Journal of Services Technology and Management, Vol. 11, No. 3, 2009, p. 247. doi:10.1504/IJSTM.2009.024092
- W. R. George and C. Marshall, “Developing New Services,” American Marketing Association, Chicago, 1984.
- S. Effendi and L. Prochazka, “Motivation to Participate in Online Innovation Activities: Dynamic Changes Based on the Community’s Purpose and Policy,” Proceedings of International Conference on Enterprise Marketing and Globalization (EMG), Singapore City, 2012, pp. 44-49,
- S. Flieb and M. Kleinaltenkamp, “Blueprinting the Service Company: Managing Service Processes Efficiently,” Journal of Business Research, Vol. 57, No. 4, 2004, pp. 392-404. doi:10.1016/S0148-2963(02)00273-4
- V. A. Zeithaml, L. L. Berry and A. Parasuraman, “The Behavior Consequences of Service Quality,” Journal of Marketing, Vol. 60, No. 2, 1996, pp. 31-46. doi:10.2307/1251929
- A. S. Sohal, S. Moss and L. Ng, “Comparing IT Success in Manufacturing and Service Industries,” International Journal of Operations & Production Management, Vol. 21, No. 1-2, 2001, pp. 30-45. doi:10.1108/01443570110358440
- J. Kingman-Brundage, “The ABCs of Service System Blueprinting: Designing a Winning Service Strategy,” In: M. Bitner and L. Crosby, Eds., AMA, Chicago, 1989, pp. 30-33.
- C. Gronroos, “Service Management and Marketing: Managing the Moments of Truth in Service Competition,” Lexington Books, Lanham, 1990.
- P. Kotler, “Marketing Management: Analysis, Planning, Implementation, and Control,” 8th Edition, Prentice Hall, Englewood Cliffs, 1994.
- M. J. Bitner, “Building Service Relationships: It’s All about Promises,” Journal of the Academy of Marketing Science, Vol. 23, No. 4, 1995, pp. 246-251. doi:10.1177/009207039502300403
- G. L. Shostack, “Understanding Services through Blueprinting,” In: T. A. Schwartz, D. E. Bowen and S. W. Brown, Eds., Advances in Services Marketing and Management, JAI Press, Greenwich, 1992, pp. 75-90.
- G. L. Shostack, “Service Positioning through Structural Change,” Journal of Marketing, Vol. 51, No. 1, 1987, pp. 34-43. doi:10.2307/1251142
- S. S. Tax and I. Stuart, “Designing and Implementing New Services: The Challenges of Integrating Service Systems,” Journal of Retailing, Vol. 73, No. 1, 1997, pp. 105-134. doi:10.1016/S0022-4359(97)90017-8
- G. L. Shostack, “Designing Services That Deliver,” Harvard Business Review, Vol. 62, No. 1, 1984, pp. 133-139.
- M. J. Bitner, “Service and Technology: Opportunities and Paradoxes,” Managing Service Quality, Vol. 11, No. 6, 2001, pp. 375-379. doi:10.1108/09604520110410584
- E. Garbarino and M. S. Johnson, “The Different Roles of Satisfaction, Trust, and Commitment in Customer Relationships,” Journal of Marketing, Vol. 63, No. 2, 1999, pp. 70-87. doi:10.2307/1251946
- J. B. MacDonald and K. Smith, “The Effects of Technology-Mediated Communication on Industrial Buyer Behavior,” Industrial Marketing Management, Vol. 33, No. 2, 2003, pp. 107-116. doi:10.1016/S0019-8501(03)00033-6
- A. Parasuraman, V. A. Zeithaml and L. L. Berry, “SERVQUAL: A Multiple-Item Scale for Measuring Customer Cognizances of Service Quality,” Journal of Retailing, Vol. 64, No. 1, 1988, pp. 12-40.