Open Journal of Marine Science
Vol.08 No.02(2018), Article ID:84234,14 pages
10.4236/ojms.2018.82016
Have the Algae-Grazing Fish in the Back Reefs of Jamaica and Grand Cayman Changed in Size? A View across 36 Years
Matthew J. Draud1, M. Itzkowitz2
1College of Arts and Sciences, Siena Heights University, Adrian, USA
2Department of Biological Sciences, Lehigh University, Bethlehem, USA

Copyright © 2018 by authors and Scientific Research Publishing Inc.
This work is licensed under the Creative Commons Attribution International License (CC BY 4.0).
http://creativecommons.org/licenses/by/4.0/


Received: February 13, 2018; Accepted: April 27, 2018; Published: April 30, 2018
ABSTRACT
The island of Jamaica is often cited as an example of how overfishing has dramatically reduced the sizes of coral reef fishes. To examine the change in fish sizes over a 36-year period, we analyzed data from systematic surveys conducted in 1977 and 2013/14 of the sizes and relative abundances of four common algae-grazing fishes in the shallow backreef habitats of Jamaica and Grand Cayman. The four species are: striped parrotfish (Scarus iseri), stoplight parrotfish (Sparisoma viride), ocean surgeon (Acanthurus tractus) and the blue tang (Acanthurus coeruleus). We predicted that all four species would be larger in Grand Cayman than in Jamaica in 1977 as well as in 2013/14, because Grand Cayman has been cited as having less fishing pressure than Jamaica. For the same reason, we expected all four species would have declined in size over the 36 years in Jamaica but not in Grand Cayman. Furthermore, we predicted that the compressed body shape of the ocean surgeon and the blue tang would have made them especially vulnerable to net and trap fishing compared to the two parrotfishes, and that accordingly the effects of overfishing would be greater in these two species. We rejected this hypothesis. The size distributions of the laterally compressed species changed significantly on both islands over the 36-year time span, although not as predicted. At both islands, the blue tangs shifted toward smaller sizes and the ocean surgeons shifted toward larger sizes. There were no size distribution changes detected in the two fusiform species. There was also no support for the prediction that the sizes of these four species were larger in Grand Cayman than in Jamaica during either time period.
Keywords:
Caribbean, Scaridae, Acanthuridae, Fishing Intensity, Body Shape

1. Introduction
By the early 1990s, it was generally accepted that the coral reef fish community in Jamaica was in decline and among the most intensely fished in the Caribbean (Allison, 1992 [1]; Hughes, 1994 [2]; Sanderman & Woodley, 1994 [3]; Sary, 1995 [4]; Hardt, 2009 [5] ), with fishing pressure in Jamaica being estimated at more than twice the estimates of the next highest islands (Hawkins & Roberts, 2004 [6] ). The supporting evidence rested on two types of data; fishery landings and experimental sampling. First, estimates of the landings of commercially important species in relation to estimated work-effort by Jamaican fisherman had declined from the early 1960s to the 1990s (Munro, 1983 [7]; Aiken & Haughton, 1987 [8]; Sary et al., 2003 [9] ). Second, in comparison to other Caribbean islands, experimental surveys showed that fish populations in Jamaica had lower population densities and smaller mean body sizes (Klomp et al., 2003 [10]; Hawkins & Roberts, 2004 [6]; Vallès & Oxenford, 2014 [11] ). While the above results are correlational, Koslow et al. (1988 [12] ) illustrated that one type of artisanal gear commonly used in Jamaica (i.e., fish traps) could “significantly” alter the species compositions of reef areas.
Munro (1983 [7] ) and Sary et al. (2003 [9] ) warned that without a more intense management of the artisanal fisheries, the Jamaican reef fish populations would continue to decline both in numbers and sizes. In addition to the economic issues that result from fishery collapse (e.g., losses to fisheries industry and tourism), large-scale changes in the population demographics of coral reef fishes may have a profound impact on the health of the coral reef itself. For example, Hughes (1994 [2] ) argued that overfishing contributed to the phase-shifts from coral-dominated to algal-dominated systems in the Caribbean. Jackson et al. (2014 [13] ) argued more specifically that the loss of parrotfish due to overfishing may have allowed macro algae to overgrow and kill coral. Aronson & Precht (2006 [14] ) argue that climate change and marine diseases are more potent factors in large-scale coral reef degradation.
In this paper we present the results of two surveys in the back reefs of Jamaica and Grand Cayman, one in 1977 and the other in 2013/2014. Prior to 1977, Itzkowitz (1974 [15] ) using random transects in the Jamaican back reef lagoons published the first survey of the inshore fishes at three locations along the North Coast. In 1984, Itzkowitz et al. (1991 [16] ) used point locations to examine relative species abundance on the Jamaican fore reef at a depth of 25 m. Both surveys did not consider sizes of the fish but did illustrate that algae grazers were commonly observed. The 1977 Grand Cayman survey presented here is the earliest census performed on that island’s inshore fishes. Although it is well known that sea turtles were heavily exploited in Grand Cayman (Jackson, 1997 [17] ), we assumed, at that time, that the inshore fishes represented a more pristine contrast to the fish communities in Jamaica. Surveys performed in 1999 (Pattengill-Semmens & Semmens, 2002 [18] ) and in 2009 (McCoy et al., 2010 [19] ) reinforce the view that the reefs in Grand Cayman do have less intense fishing. Therefore, Grand Cayman represents a great opportunity for coral reef fish comparisons since it is less fished, relatively close to Jamaica, and has a north coast fringing coral reef system that resembles the reef on the north coast of Jamaica.
The critical aspect of this study is a survey of several localities on the north coasts of Jamaica and Grand Cayman in 1977. In 2013/2014 we returned to these same areas, using similar recording techniques, to determine if fish sizes had changed. Reflecting the important role that algae-grazing play in the dynamics of coral reef ecosystems, here we restrict our analysis to four commonly encountered species: the striped parrotfish (Scarus iseri, Bloch 189), the stoplight parrotfish (Sparisoma viride, Bonneterre 1788), the ocean surgeon (Acanthurus tractus Poey, 1860) and the blue tang (Acanthurus coeruleus, Bloch and Schneider 1801). Because fishing pressure appears higher in Jamaica than Grand Cayman, we predicted that the body sizes of all four species would be larger in Grand Cayman in both time periods, and that any decreases in body sizes over the 36-year time period would be more pronounced in the Jamaican populations. Sutherland et al. (1991 [20] ) observed that laterally compressed fishes would be less able to escape the same size trap mesh as compared to fusiform fishes of the same total length. Randall (1983 [21] ) characterizes the striped and stoplight parrotfish as being “oblong and moderately compressed” while the blue tang and the ocean surgeon are described as being “high-bodied and compressed.” In Jamaica, we predicted that the highly compressed bodies of the blue tang and the ocean surgeon will have caused them to decline more dramatically than the two parrotfish. Without significant fishing pressure in Grand Cayman, we predicted that body shape would not correlate to any recorded changes in fish size.
2. Methods
2.1. Location
We conducted our surveys at several sites in the shallow back reefs along the north coasts of Jamaica and Grand Cayman. These two north coast reef locations are topographically similar to one another, with a narrow band of shallow water habitat supporting corals, sea grass, and macro algae, and both being strewn with coral rubble. We sampled reef sites near two towns along the north shore of Jamaica in 1977 and 2013, Discovery Bay and Ocho Rios. In 2013 we also sampled an additional site located east of Ocho Rios in the town of Oracabessa. In total the locations sampled in Jamaica span an approximate linear distance of 50 km. In Grand Cayman in 1977, 2013, and 2014, we sampled nine sites along the north shore from approximately Rum Point to Old Man Bay, spanning an approximate linear distance of 7 km.
2.2. The Back Reef Environment
The back reef zone (1 - 3 m depth) lies between the shore and the nearly-emergent reef crest. The habitat of the Jamaican and Grand Cayman back reef sites is structurally complex, owing to the haphazard arrangement of a variety of coral rubble features, large living colonies of several species of framework coral, such as Siderastrea siderea, Diploria strigosa, and Orbicella annularis, as well as patches of sand and sea grass. Many species of marine fishes use the live coral, sea grass, sand, and rubble along the back reef for refuge, mating, nesting, and foraging. Munro (2000 [22] ) considered this environment in Jamaica to have a high diversity with stable but dynamic populations of fish. Prior to the 1977 survey analyzed in this paper, this back-reef area was used to describe the community structure and the social interactions of many of the diurnal coral reef fish species that routinely reside there (Itzkowitz, 1974 [15] , 1977a [23] , b [24] , 1980 [25] ).
2.3. Species Considered
In this paper we focus on four species that graze algae, two prominent species in the family Scaridae, the striped parrotfish and the stoplight parrotfish and two prominent species in the family Acanthuridae, the ocean surgeon and the blue tang. We avoid the term “herbivorous” for the parrotfish because Clement et al. (2016 [26] ) argued that while they do eat macroalgae, their nutrition may be based largely on “microscopic benthic autotrophs” residing on the macroalgae. We selected these four species for three important reasons. First, all four species are subjected to heavy fishing pressure in Jamaica as they are all commonly targeted in the spear-fishing, netting, and fish trapping fisheries. Second, all four were commonly observed during our surveys in all sites on both islands and in both sampling periods. Finally, the two families differ significantly in body shape (i.e., Scarids being fusiform and Acanthurids being laterally compressed) and we were interested in investigating whether those differences are related to changes in population demographics across time.
2.4. Sampling Method
The intent of the sampling was to determine if the sizes of the four species changed in the localities sampled since 1977. Even with this limited geographical area, coral reef fishes have been shown to have a highly discontinuous and dynamic distribution. For this reason, past studies have suggested a host of different sampling techiques, each having their strengths and weaknesses (Brock, 1982 [27]; Bortone et al., 1989 [28]; English et al., 1994 [29]; Cheal & Thompson, 1997 [30]; Thompson & Mapstone, 1997 [31] ). We chose a sampling technique that was best suited to our primary objective, which was to characterize the size distributions of the four species. To accomplish this, we employed a roving diver (RD) technique that maximized the likelihood of encountering fish by eliminating searching in unsuitable habitats, such as large sand patches. RD surveys do not permit an accurate measure of total area sampled, but this was not a concern since we did not intend to compare fish population densities.
Each RD survey covered approximately 250 linear meters of reef habitat. The observer snorkeled along a circuitous path, avoiding large open sand patches and maximizing observation time in high quality benthic habitat features that are most frequently utilized by schools of the four species, primarily rubble piles and live coral colonies. The observer snorkeled a path that eliminated the chance of observing the same patch of habitat more than once during each survey. As the observer encountered each group of fish, the number of individuals of each species was recorded, along with the approximate body sizes of each individual. We recorded all four species down to the smallest sizes at which species identification was accurate, approximately 2 cm. We conducted between three and five RD surveys per sampling location during each time period, depending upon the amount of available habitat and weather conditions. For the purposes of data analysis, we pooled all of the survey data from each location to make island-to-island comparisons.
All four species in this study occur in groups and frequently move within large home ranges. Individual RD surveys were conducted so as to reduce the chance of encountering the same group of fish more than once during a single survey, and subsequent RD surveys in the same site were spread out by at least 200-m so as to reduce the chance of recording the same group of fish in more than one survey. It is possible that we occasionally did encounter the same group in more than one of our RD surveys, but this was likely very rare.
More surveys were conducted in 2013/14 than in 1977 because two observers were employed rather than one. Both observers in 2013/14 began their surveys by standardizing their measurements. Comparisons were made of the RD survey data of the two observers, both in Grand Cayman and Jamaica, and analyses showed no significant differences in the sizes and relative abundances for each of the four species between each observer’s samples.
2.5. Statistics
Because some of our data were not parametric, we used the two sample nonparametric Kolmogorov-Smirnov test (KS). We employed this test because central tendencies (such as medians) may not give an accurate measure of the distribution differences. In some cases, where the KS test revealed differences, we also used the Mann-Whitney U test to see if this distributional difference may have been influenced by differences in the central tendencies. Second-order polynomial trend lines were added to the graphed distributions in order to help visualize the size distributions for each species, in each location, and in each sampling period.
3. Results
Figures 1-4 illustrate the size distributions of each of the 4 species samples in 1977 and 2013/14 in Jamaica and Grand Cayman as a percentage of the total number of individuals for the species. In most cases on both islands, as anticipated, we encountered more fish in our samples in 2013/14 than in 1977 because
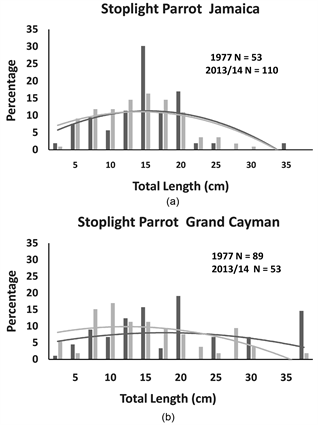
Figure 1. The percentage of individual stoplight parrotfish recorded in Jamaica and Grand Cayman for each size category and second order polynomial trend lines for each distribution. On each panal are the total number of individuals (N) recorded in 1977 (black bars and black trend line) and 2013/14 (grey bars and trend line).
of the additional sampling effort associated with employing two observers. However, there were two interesting exceptions in the Grand Cayman surveys. We observed 40% fewer stoplight parrotfish and nearly 90% fewer striped parrotfish in 2013/14 as compared to 1977, despite the increased sampling effort.
Comparing between Jamaican and Grand Cayman populations, there were no significant differences in the size distributions of all 4 species in 1977, and only one significant difference in 2013/14 (the striped parrotfish) (see Table 1). This single detected difference in the striped parrotfish size distributions between Jamaica and Grand Cayman in 2013/14 was not strongly influenced by the central tendencies of the two populations (Table 1: Mann-Whitney U Test: U = 2807.5, p = 0.54).
Comparing within islands (see Table 2), both the ocean surgeon and the blue tang in Jamaica showed a significant change in their size distributions across the 36-year timespan, and the shifts were strongly influenced by changes in central tendencies. In Jamaica, the blue tang declined in median size (Table 2: Mann-Whitney U Test: U = 5363.00, p < 0.001) while the ocean surgeon increased in median size (Table 2: Mann Whitney U Test: U = 19,082.5, p <

Table 1. Comparison of the distributions between Jamaica and Grand Cayman with years using Kolmogorov-Smirnov test and the Mann Whitney u-test. p values in bold indicates significant differences.
Table 2. Comparison of the distributions across years for Jamaica and Grand Cayman using Kolmogorov-Smirnov test and the Mann Whitney u-test. p values in bold indicate significant differences.
0.001). Similarly, in Grand Cayman, the size distributions of the blue tang and the ocean surgeon were significantly different between 1977 and 2013/14. The change in blue tang population size distribution was strongly affected by median size, with a highly significant downward shift in median size (Table 2: Mann Whiney U Test: U = 35,497.00, p < 0.001). The significant change in ocean surgeon size distribution was not as strongly influenced by central tendencies, as the slight increase in median size in 2013/14 was not statistically significant (Table 2: Mann Whitney U Test: U = 23,224.00, p = 0.15). There were no significant differences in the size distributions for the two parrotfish species across the
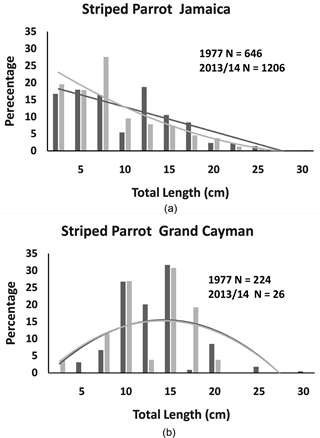
Figure 2. The percentage of individual striped parrotfish recorded in Jamaica and Grand Cayman for each size category and second order polynomial trend lines for each distribution. On each panal are the total number of individuals (N) recorded in 1977 (black bars and black trend line) and 2013/14 (grey bars and trend line).
36-year timespan on either island.
4. Discussion
Hawkins & Roberts (2004 [6] ) and others have argued that the intense “artisanal fishing” (largely fish traps) was responsible for the relatively smaller fish sizes in Jamaica compared to other Caribbean Islands. While there is evidence that the fishes on coral reefs with higher fishing pressure tend to be smaller than those of less-fished Caribbean Islands (e.g., Vallès & Oxenford, 2014 [11] ), few studies have attempted to quantify changes over multiple decades. Here we report results of snapshot surveys in the shallow backreefs of Jamaica and Grand Cayman spanning 36 years that provide no support for the general hypothesis that overfishing has caused shifts in population size demographics for four ecologically and economically important algae-grazing species.
Our analyses did not support the prediction that body shape would influence demographic shifts. The hypothesis stems from the notion that a particular mesh size is more effective at capturing laterally compressed species than fusiform
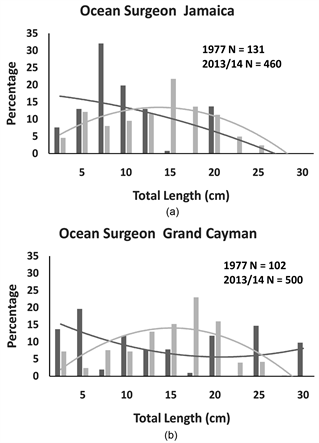
Figure 3. The percentage of individual ocean surgeons recorded in Jamaica and Grand Cayman for each size category and second order polynomial trend lines for each distribution. On each panal are the total number of individuals (N) recorded in 1977 (black bars and black trend line) and 2013/14 (grey bars and trend line).
species of the same total length. Across the 36 years that separating the two survey periods, we found no evidence on either island of changes to size distributions in the two fusiform species (the stoplight and striped parrot fishes). We detected significant differences across the 36 years in the size distributions of both laterally compressed species on both islands (blue tang and ocean surgeon). The detected shifts in blue tang population size distributions were linked to significant decreases in median body size on both islands which may suggest that nets and traps removed larger individuals. However, the shifts in ocean surgeon sizes showed the reverse of this trend. In Jamaica, there was a significant increase in the median size of ocean surgeons and the same trend, though not significant, was detected in Grand Cayman. It is unknown why ocean surgeon populations would have increased in body size over the 36-year timespan.
It is unclear why despite doubling our sampling effort in 2013/2014 there was a dramatic decline in the abundance of striped parrotfish, and to a lesser extent, the stoplight parrotfish, in Grand Cayman. We were concerned that the reduced sample sizes might introduce biases in the distributions but this seems unlikely
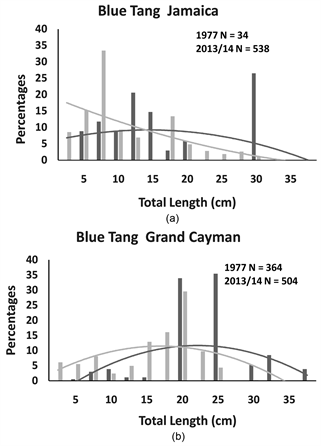
Figure 4. The percentage of individual blue tangs recorded in Jamaica and Grand Cayman for each size category and second order polynomial trend lines for each distribution. On each panal are the total number of individuals (N) recorded in 1977 (black bars and black trend line) and 2013/14 (grey bars and trend line).
because the striped parrotfish distributions are nearly identical to that of 1977 and they are similarly different from the Jamaican communities over both time periods. The stoplight parrotfish Grand Cayman communities are also statistically similar in 2013/2014 and 1977 and are also similarly different from the Jamaican communities.
Again, while it was not our intent to consider changes in abundance, the severe differences, especially for the striped parrotfish, deserves further attention. It is interesting that the two laterally compressed species (ocean surgeonfish and blue tang) were encountered in higher numbers on both islands in 2013/14 as compared to 1977. Thus whatever was affecting the parrotfish did not influence the ocean surgeons and blue tangs. Quite possibly there has been more fishing pressure over than past 36 years in Grand Cayman than has been reported, thus leading to the shifts in the numbers of individuals encountered in surveys. Parrotfishes are often a coveted target of recreational spear fishing, and perhaps these data reflect a higher pressure from recreational spear fishing than has been recognized. It remains unclear why the numbers of parrotfishes in Jamaica were not affected in the same way as Grand Cayman, but commercial fishing operations in Jamaica target by size and not by species, retaining virtually everything captured that is 10-cm and greater (Hawkins & Roberts, 2004 [6] ). Further work, with a focus on abundance, should be directed at determining whether the decline in the striped parrotfish and stoplight parrotfish is a a local phenomena or island-wide.
Taken as a whole, our results fail to provide strong support for the notion that populations in Jamaica have been more strongly affected by fishing pressure than those in Grand Cayman. Statistical comparisons of the size distributions of all four species in 1977 revealed no significant differences between Jamaican and Grand Cayman populations. Similar results were found in comparisons in 2013/14, with the sole exception of the striped parrotfish, which was found to differ in size distribution but not with regards to median body size. Visually inspecting the relevant graphs (Figure 2), the significant differences between the two island populations in 2013/14 seem to be most influenced by the higher representation of very small individuals (<10 cm) in Jamaica as compared to Grand Cayman, a trend that was also apparent in 1977.
One possibility is that past characterization of the “ancestral” Jamaica reef fish communities, based on indirect methods of fishing effort and yield and/or relating the current communities to distant Caribbean islands, may have overestimated the extent to which degradation has occurred or is continuing. In this case Grand Cayman’s similarities to Jamaica regarding these four species may indicate that the similar ecological settings may be the important components regulating fish size (e.g., Wilson et al., 2010).
This is the first study that compares algae-grazing population demographics in the productive back reef habitats of Jamaica and Grand Cayman over a considerable period of time. Although there are inherent limitations to “snapshot” surveys of fish populations, they nonetheless are valuable in testing predictions related to their long-term stability and viability. It would be ideal to have continuous scientific surveys employing the same sampling techniques over that same timeframe but none exists.
Another limitation is that we were bound by the locations sampled in 1977. Any attempt to expand the locations in 2013/2014 would likely incorporate fish communities from other qualitatively different habitats (e.g., Mumby & Wabnitz 2001 [32]; Lara & González 1998 [33]; Wilson et al. 2010 [34] ). Munro (2000 [22] ) using fish traps to capture-recapture tagged fish in Discovery Bay, Jamaica, observed that over a 3 year period, all of the four species considered here rarely left the back reef habitat indicating a relatively stable population that likely confined to a specific habitat/location. It remains uncertain if the addition of other habitats would have changed the size distributions. In 2000, Klomp et al. (2003 [10] ) surveyed multiple sites on Jamaica’s North Coast in a two week time period, largely in deeper water on the north coast fore reef. Although Klomp et al. provided insufficient information to allow for size distributions comparisons, overall, the four herbivores considered here do resemble the sizes we recorded from Jamaica in 2013-2014. Thus, at least for the communities we sampled, we are relatively confident that our samples are a good representation of the size distributions of these four important algae-grazing populations. Given the caveats mentioned above, we conclude that our results do not support the hypothesis that these four species of fish in Jamaica uniformly declined in size from 1977 to 2013/2014.
Acknowledgements
Layla Al-Shaer and Lonnie Kaczmarsky provided helpful comments on an earlier draft of this manuscript. We are grateful to the help provided by the Discovery Bay Marine Laboratory, Jamaica.
Cite this paper
Draud, M.J. and Itzkowitz, M. (2018) Have the Algae-Grazing Fish in the Back Reefs of Jamaica and Grand Cayman Changed in Size? A View across 36 Years. Open Journal of Marine Science, 8, 300-313. https://doi.org/10.4236/ojms.2018.82016
References
- 1. Allison, W.R. (1992) The Discovery Bay Fisheries Improvement Project: Status Report. Proceedings of the Gulf and Caribbean Fisheries Institute, 42, 331-337.
- 2. Hughes, T.P. (1994) Catastrophes, Phase Shifts, and Large-Scale Degradation of a Caribbean Coral Reef. Science, 265, 1547-1551. https://doi.org/10.1126/science.265.5178.1547
- 3. Sanderman, I.M. and Woodley, J.D. (1994) Jamaica North Coast Fisheries Improvement Project: Final Report 504/13778. Canadian International Development Agency, Hull, Quebec, Canada.
- 4. Sary, Z. (1995) Responses of an Over-Exploited Caribbean Trap Fishery to the Introduction of a Larger Mesh Size in Discovery Bay, Jamaica. M.S. Thesis. University of the West Indies, Kingston.
- 5. Hardt, M. (2009) Lessons from the Past: The Collapse of the Jamaican Coral Reefs. Fish and Fisheries, 10, 143-158. https://doi.org/10.1111/j.1467-2979.2008.00308.x
- 6. Hawkins, J.P. and Roberts, C.M. (2004) Effects of Artisanal Fishing on Caribbean Coral Reefs. Conservation Biology, 18, 215-226. https://doi.org/10.1111/j.1523-1739.2004.00328.x
- 7. Munro, J.L. (Ed.) (1983) Caribbean Coral Reef Fishery Resources. ICLARM Studies and Reviews 7. International Center for Living Aquatic Resources Management, Manila.
- 8. Aiken, K.A. and Haughton, M.O. (1987) Status of the Jamaican Reef Fishery and proposals for Its Management. Proceedings of the Gulf and Caribbean Fisheries Institute, 38, 469-484.
- 9. Sary, Z., Munro, J.L. and Woodley, J.D. (2003) Status Report on a Jamaican Reef Fishery: Current Value and the Costs of Non-Management. Gulf Caribbean Fisheries Institute, 54, 98-11.
- 10. Klomp, K.D., Clarke, K., Marks, K. and Miller, M.M. (2003) Conditions of Reef Fish on Jamaica’s North Coast Signals Late Stages of Overexploitation. 54th Gulf and Caribbean Fisheries Institute, 54, 593-601.
- 11. Vallès, H. and Oxenford, H.A. (2014) Parrotfish Size: A Simple Yet Useful Alternative Indication of Fishing Effects on Caribbean Reefs. PLoS ONE, 9, e86291. https://doi.org/10.1371/journal.pone.0086291
- 12. Koslow, J.A., Hanley, F. and Wicklund, R. (1988) Effects of Fishing on Reef Fish Communities at Pedro Ban and Port Royal Cays, Jamaica. Marine Ecology Progress, 43, 201-212. https://doi.org/10.3354/meps043201
- 13. Jackson, J.B.C., Donovan, M.K., Cramer, K.L. and Lam, V.V. (2014) Status and Trends of Caribbean Coral Reefs: 1970-2012. Global Coral Reef Monitoring Network, IUCN, Gland.
- 14. Aronson, R.B. and Precht, W.F. (2006) Conservation, Precaution, and Caribbean Reefs. Coral Reefs, 25, 441-450. https://doi.org/10.1007/s00338-006-0122-9
- 15. Itzkowitz, M. (1974) A Behavioural Reconnaissance of Some Jamaican Reef Fishes. Zoological Journal of the Linnean Society, 55, 87-118. https://doi.org/10.1111/j.1096-3642.1974.tb01589.x
- 16. Itzkowitz, M., Haley, M.P., Otis, C. and Evers, D. (1991) A Reconnaissance of the Deeper Jamaican Coral Reef Fish Communities. Northeast Gulf Science, 12, 25-34.
- 17. Jackson, J.B.C. (1997) Reefs since Columbus. Coral Reefs, 16, 3-32. https://doi.org/10.1007/s003380050238
- 18. Pattengill-Semmens, C.V. and Semmens, B.X. (2003) Cayman Islands. Status of Coral Reefs of Little Cayman and Grand Cayman, British West Indies, in 1999 (Part 2: Fishes). Atoll Research Bulletin, 496, 227-247. https://doi.org/10.5479/si.00775630.496-12.226
- 19. McCoy, C.M., Dromard, C.R. and Turner, J.R. (2010) An Evaluation of Grand Cayman MPA Performance: A Comparative Study of Coral Reef Fish Communities. Proceedings of the Gulf and Caribbean Fisheries Institute, 62, 345-353.
- 20. Sutherland, D.L., Bohnsack, J.A., Harper, D.E., Holt, C.M., Hulsbeck, M.W. and McClellan, D.B. (1991) Preliminary Report: Reef Fish Size and Species Selectivity by Wire Fish Traps in South Florida Waters. Gulf and Caribbean Fisheries Institute, 40, 108-125.
- 21. Randall, J.E. (1983) Caribbean Reef Fishes. Tropical Fish Hobbyist, Neptune City.
- 22. Munro, J.L. (2000) Outmigration and Movement of Tagged Coral Reef Fish in a Marine Fishery Reserve in Jamaica. Proceedings of the Gulf and Caribbean Fisheries Institute, 51, 557-568.
- 23. Itzkowitz, M. (1977) Spatial Organization of the Jamaican Damselfish Community. Journal of Experimental Biology and Ecology, 28, 217-241. https://doi.org/10.1016/0022-0981(77)90093-4
- 24. Itzkowitz, M. (1977) Social Dynamics of Mixed-Species Groups of Jamaican Reef Fishes. Behavioral Ecology and Sociobiology, 2, 361-384. https://doi.org/10.1007/BF00299506
- 25. Itzkowitz, M. (1980) Group Formation of Reef Fishes Induced through Food Provisioning. Biotropica, 12, 277-281. https://doi.org/10.2307/2387699
- 26. Clements, K.D., German, D.P., Pich, J., Tribollet, A. and Choat, J.H. (2016) Integrating Ecological Roles and Trophic Diversi?cation on Coral Reefs: Multiple Lines of Evidence Identify Parrot?shes as Microphages. Biological Journal of the Linnean Society, 120, 729-751.
- 27. Brock, R.E. (1982) A Critique of the Visual Census Method for Assessing Coral Reef Fish Populations. Bulletin of Marine Science, 32, 269-276.
- 28. Bortone, S.A., Kimmel, J.J. and Bundrick, C.M. (1989) A Comparison of Three Methods for Visually Assessing Reef Fish Communities: Time and Area Compensated. Northeast Gulf Science, 10, 85-96.
- 29. English, S., Wilkinson, C. and Baker, V. (1994) Survey Manual for Tropical Marine Resources. ASEAN-Australia Marine Science Project: Living Coastal Resources. Australian Institute of Marine Science, Townsville, 68-80.
- 30. Cheal, A.J. and Thompson, A.A. (1997) Comparing Visual Counts of Coral Reef Fish: Implications of Transect Width and Species Selection. Marine Ecology Progress, 158, 241-248. https://doi.org/10.3354/meps158241
- 31. Thompson, A.A. and Mapstone, B.D. (1997) Observer Effects and Training in Underwater Visual Surveys of Reef Fishes. Marine Ecology Progress, 154, 53-63. https://doi.org/10.3354/meps154053
- 32. Mumby, P.J. and Wabnitz, C.C.C. (2002) Spatial Patterns of Aggression, Territory Size, and Harem 10 Size in Five Sympatric Caribbean Parrotfish. Environmental Biology of Fishes, 63, 265-279. https://doi.org/10.1023/A:1014359403167
- 33. Lara, N.E. and González, E.A. (1998) The Relationship between Reef Fish Community Structure and Environmental Variables in the Southern Mexican Caribbean. Journal of Fish Biology, 53, 209-221. https://doi.org/10.1111/j.1095-8649.1998.tb01028.x
- 34. Wilson, S.K., Fisher, R., Pratchett, M.S., Graham, N.A.J., Dulvy, N.K., Turner, R.A., Cakacaka, A. and Polunin, N.V.C. (2010) Habitat Degradation and the Fishing Effects on the Size Structure of Coral Reef Fish Communities. Ecological Applications, 20, 442-451. https://doi.org/10.1890/08-2205.1