Open Journal of Marine Science
Vol.3 No.2A(2013), Article ID:33678,14 pages DOI:10.4236/ojms.2013.32A006
A Multilevel Core Sampler Device to Directly Estimate Food Supply Accessible to Waders
1Université d’Artois, IUFM, Centre de Gravelines, Gravelines, France
2Laboratoire d’Océanologie & Géosciences, Université Lille 1-Sciences et Technologies, Wimereux, France
Email: Christophe.luczak@univ-lille1.fr
Copyright © 2013 Christophe Luczak et al. This is an open access article distributed under the Creative Commons Attribution License, which permits unrestricted use, distribution, and reproduction in any medium, provided the original work is properly cited.
Received April 23, 2013; revised May 27, 2013; accepted May 29, 2013
Keywords: Benthos; Waders; Core Sampler; Vertical Distribution; Food Supply; Intertidal
ABSTRACT
To understand food webs functioning in intertidal soft-sediments, it is critical to assess the macrobenthic prey fraction accessible to waders. Here we describe a simple core sampler device allowing to directly relating the vertical distribution of macrozoobenthos to waders bill length. Bill length measurements were used as a proxy of probing depth to estimate the amount of food supply accessible. Several metal plates can be inserted in the core sampler at different heights according to the bill length data of the studied species. These data are provided in a literature survey. For each species, the bill length variability is then explicitly taken into account in the estimation of food accessibility. The core is transparent to check for the quality of the sample. It could also be used to estimate a Benthic Habitat Quality index (BHQ) based on characteristics of the vertical structure of the sediment. This multilevel core is easy to build and to adapt to any studied wader species of the intertidal zone, floodplains or other wetlands. The samples are obtained with the same effort as with usual circular cores leading to the possibility to survey large area. With one core sample, the ecological information that can be achieved at once is threefold: 1) benthic community structure (partitioned in several depths), 2) estimate of the accessible food fraction to waders (range of values) and 3) habitat quality index assessment.
1. Introduction
Coastal intertidal areas are of prime importance for the survival of many waders species. These predators feed on macrobenthic invertebrates preys [1,2] which are only available during low water periods. As secondary consumers, waders are an important component of estuaries and intertidal areas [3]. Even if young fishes, crabs and shrimps are the most important predators in terms of total consumption [1], accurately understanding food webs functioning in intertidal soft-sediments also goes through the investigation of trophic interactions between waders and their macrobenthic invertebrate preys [1]. These preys are indeed key organisms in trophic relationship with regard to intertidal ecosystems functioning. Usual macrobenthic data are often not suitable to relate both components as shorebirds can only feed upon preys that are within reach of the bill [4]. Macrobenthic studies in the intertidal area are based on cores sampled at distinct locations and at depths varying from 15 to 40 cm [5,6]; see also [7] for a review. Intertidal flat surveys are therefore usually performed using transects running from high to low water marks, with sampled stations located at more or less regular intervals [8]. Thus, mapping benthic populations and/or communities leads to the sampling of a grid comprising up to 100 stations or more [9,10].
In this context, Zwarts and Wanink [11] defined the harvestable prey fraction. The harvestable fraction of benthic prey depends first on the fraction of prey being accessible and ingestible, that is available, and second on the fraction that is profitable [2,11]. The first step in term of sampling is then to define the accessible fraction to waders through the study of the burying depths of macrobenthic species. To estimate this accessible fraction, Zwarts and co-workers [4,12,13] measured burrow depth with circular sediment cores (diameter 15 cm, 40 cm depth) that remained standing on an improvised table after the sampler was lifted. Cores were subsequently placed horizontally and carefully broken sideways. Burrow depth was measured to the nearest 0.5 cm, and was defined according to the species as the distance between the surface of the sediment and the upper edge of the Bivalves shell (Cerastoderma edule, Scrobicularia plana, Macoma balthica, Mya arenaria), or as the distance between the surface and the deepest burrowed part (Hesdiste diversicolor, Arenicola marina). Even though this method is efficient, it is very time-consuming, and only a limited number of stations can be sampled during a low tide period. Consequently, it is impossible to study the vertical distribution of macrobenthic species at the community scale on a large area on a short time scale. Finally, smaller preys (e.g. Eurydice spp., Bathyporeia spp.) can hardly be studied accurately with this approach even if they are important food source for waders such as the Sanderling Calidris alba because animals are detected visually. Kraan et al. [9], in a landscape-scale survey to cope with food-stocks available to Red Knot (Calidris canutus islandica) distinguished accessible from inaccessible prey by separately sieving the top 4 cm sediment (maximum bill-length). This, however, was achieved (and achievable) for only one wader species.
In order to link macrobenthic studies at the community level and food supplies accessible to several waders species, we propose here the use of a multilevel core sampler to relate waders and their potential food sources in an intertidal ecosystem. This paper gives a complete description of this new device. It allows 1) the rapid collection of multispecies samples among macrozoobenthos, 2) the connection to waders diet and 3) the assessment of the benthic habitat quality. Additional ecological information that can be obtained with this core are finally discussed.
2. Material and Methods
2.1. Design
The corer (Figure 1) consists of a vertical tube (50 cm height, internal diameter 18 cm) made of transparent polycarbonate permitting to sample an area of 1/40 m² (exactly 0.0255 m²). A line (“baseline”) is engraved on the external side of the core at a height of 25 cm. It is used to place the core adequately in the sediment and to visualize when to stop pushing it down into the sediment (i.e. when the line is at the sediment surface; Figure 1). The core is then sectioned by a series of horizontal plates introduced through grooves on the inside of the core tube. A first groove is made 20 cm underneath the baseline on half of the core circumference. A stainless steel plate is inserted in this slot and determines the height of the sediment sample, i.e. the distance between the baseline and this plate (20 cm in our case). Several other grooves made at different heights correspond to the bill lengths of the waders under study (four in our case, see below). The most important step in the core construction is therefore the choice of grooves locations, as the purpose of this device is to get macrofaunal data that are relevant to the wader(s) probing depths. The strength of our device is its versatility as it can be applied to a wide variety of waders and to their feeding behaviour, hence to a variety of environments.
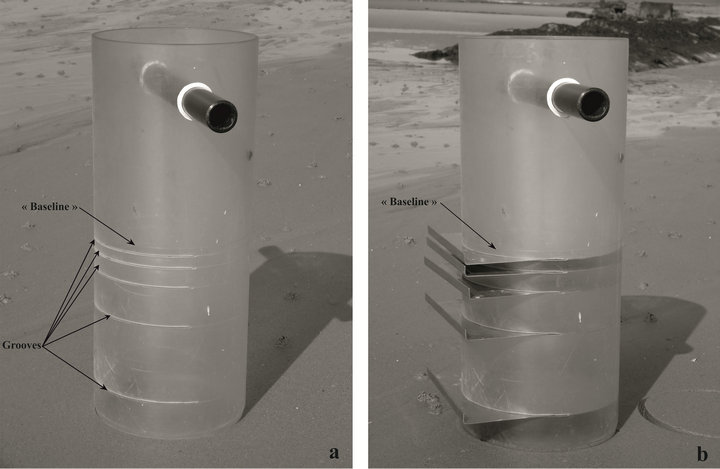
Figure 1. Picture of the transparent multilevel core device. (a) Location of grooves and “baseline”; (b) Multilevel core with inserted slots.
In the field, the core is thrust into the sediment to the baseline level. Sediment located on the side of the core is removed with a spade to insert the first plate in the lower groove. The core can then be extracted safely from the sediment and the four other plates easily inserted in the slots. Each layer can then be independently sieved and preserved. This technique is fast since sampling muddy to fine sand sediment takes less than 1 minute (C. Luczak, personal observation). Thus movements of benthic animals during sampling are highly minimised.
2.2. Bill Length as a Proxy of Probing Depth
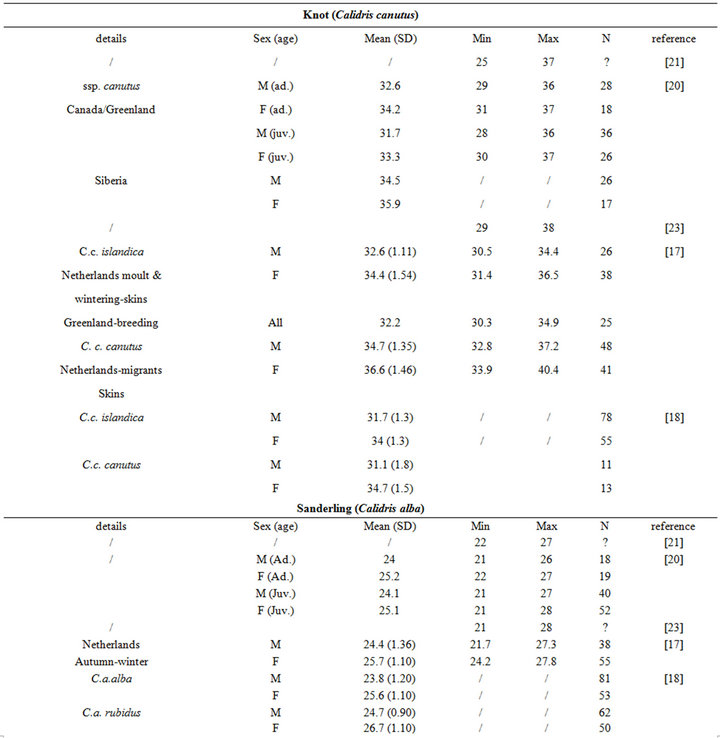
Birds collect buried preys by probing their bills into the substrate. Since they do not dig for preys, bill length sets a limit to the fraction of macrozoobenthos that is actually accessible to birds [3]. Specifically, the probing depth is intrinsically species-dependent. It is usually less than the bill length [11], but it can occasionally exceed this length when birds probe up to their eyes in mud (see [11] and references therein). For instance, while Knot (Calidris canutus) have a 35 mm long bill, they search the upper 10 - 20 mm layers more thoroughly than the deeper ones because some probes are only made to the base of the bill [14]. Similarly, Gerritsen & Meiboom [15] showed that most probes of the Sanderling (Calidris alba; bill length 26 to 27 mm) are 20 mm deep. The probing depth of Oystercatcher (Haematopus ostralegus; bill length 70 mm) averages 40 mm, but this species probes more deeply when prey density within reach is low [16].
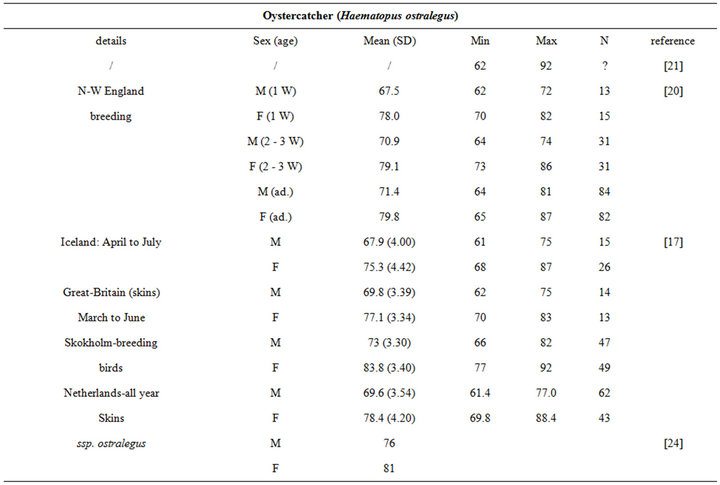
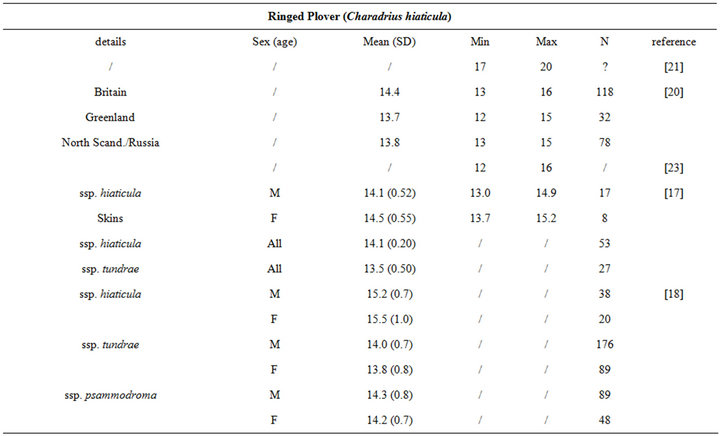
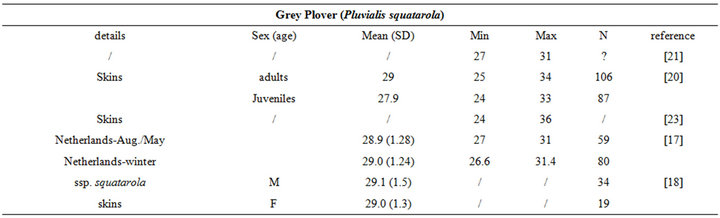
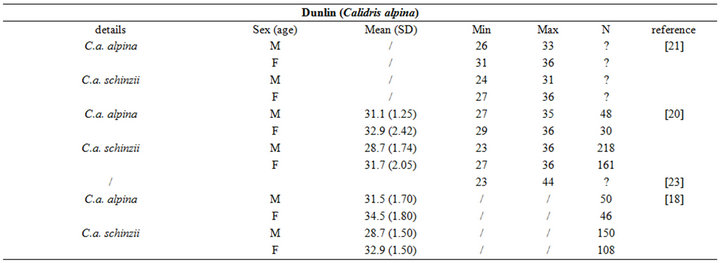
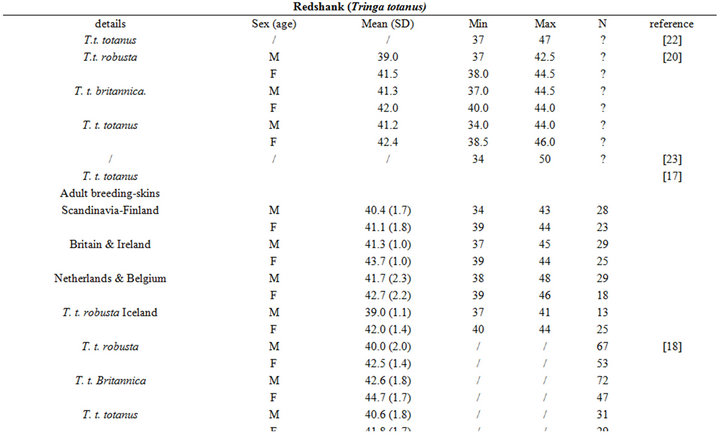
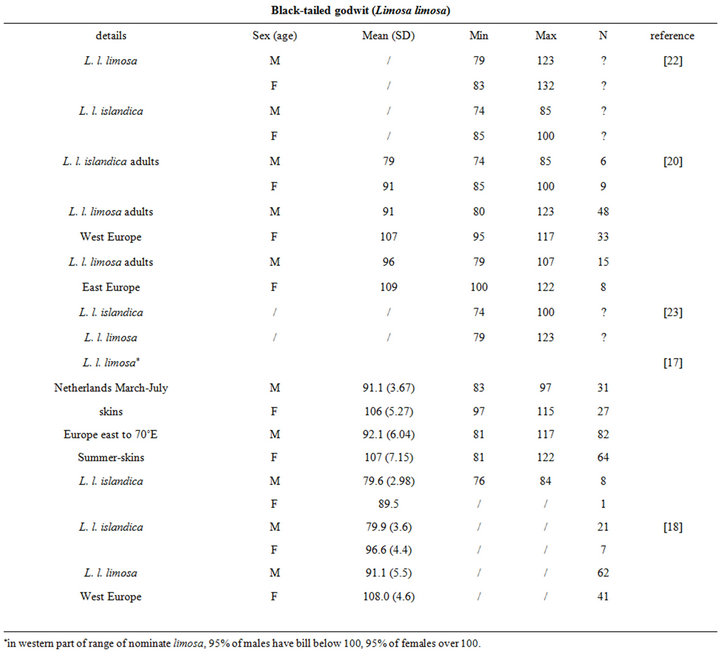
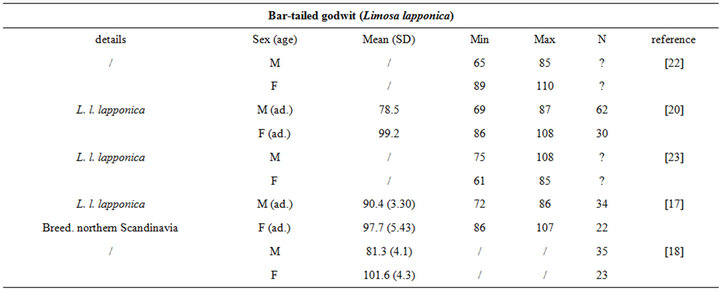
The intra specific variability of bill length can be very important. It depends on age, sex, species, sub-species and even individuals [17,18]. For instance, Zwarts et al. [19] estimated that for Oystercatcher bill length can vary from 6.5 to 9 cm. Fixing a unique bill length for a bird to evaluate the accessible preys in soft sediment is hence illusory and could lead to erroneous results. Setting out a range of probing depths for each wader species is hence an absolute prerequisite to accurately assess the potential predator/prey interactions between waders and macrobenthic invertebrates. This is illustrated from a literature survey compiling bill measurements for the main species of coastal waders in northwestern Europe [17,18,20-24]; see Appendix). We then synthesized these data results in the form of the means, standard deviations, minimum and maximum values of bill length for each species (Table 1). Note that the reported results are congruent with similar measurements made on similar species from West African coast [25].
2.3. Case Study: The Waders of the Canche Estuary, France
The final step in the core realisation was to be able to choose the locations of the groove (i.e. probing depth)
depending on the species of interest. In our case, the Canche estuary (50˚33'N; 1˚35'E) was chosen as a study case area during an annual wader survey (1999-2000). Five species namely Sanderling (Calidris alba), Dunlin (Calidris alpina), Curlew (Numenius arquata), Oystercatcher (Haematopus ostralegus) and Ringed Plover (Charadrius dubius) were dominating the waders population and represented more than 97.5% of the total abundance. To study the accessible prey to these five birds species, we used the measurements data (Table 1) and placed the grooves adequately (Figure 2). For Oystercatcher, 50 mm and 100 mm depth were chosen to place the first grooves as they correspond to the “usual” probing depth and to the maximum probing depth when the base of the bill is pushed 5 mm below the surface, respectively [19]. The mean probing depth of the Sanderling is 25 mm and the range for the Ringed Plover is 10 to 25 mm, two supplementary grooves were hence placed at these depths. The probing range of Dunlin (subspecies alpina and schinzii) is 25 - 50 mm. Finally, the last groove placed at 200 mm embraced the high variability of Curlew probing depth (100 - 200 mm), the latter varying between males and females. Our data set was obtained from four stations sampled at two intertidal sites in the Canche estuary (one north and the other south of the estuary) from April to August 2001 (see [26] for details on the study area and sampling dates). Two replicate samples were collected at each station. The first site (Northern Site: NS) was characterized by medium to fine sands while the second one (Southern Site: SS) was characterized by muddy fine sand.
3. Results
If we focus on two dates (April 13th and 25th), both study sites (NS and SS) showed no trend in species abundance (Figure 3 middle panel) with no major variation in species composition (Figure 3 top panels). Both sites then appeared to exhibit the same change in pattern. However the vertical distribution of abundance (Figure 3 bottom panels) showed drastic differences. In the northern estuary (NS), the vertical distribution pattern is the same on April 13th and 25th. On the contrary, in the southern estuary (SS), 23.3 and 49% of the animals were found in the upper 5 cm on April 13th and 25th, respectively. Individuals were relatively evenly distributed in the three upper layers on 13 April (respectively 8.8%, 7.8%, 6.8%), whereas the sharp vertical gradients observed on April 25th indicated that more individuals were located in the first centimeter (19%) and in the 2.5 - 5 cm layer (26%). This implies that, even if abundances were stable between the two dates for both sites, more preys were accessible to waders in the southern estuary (SS) because of an upward vertical movement of the fauna with more organisms located shallower in the sediment.
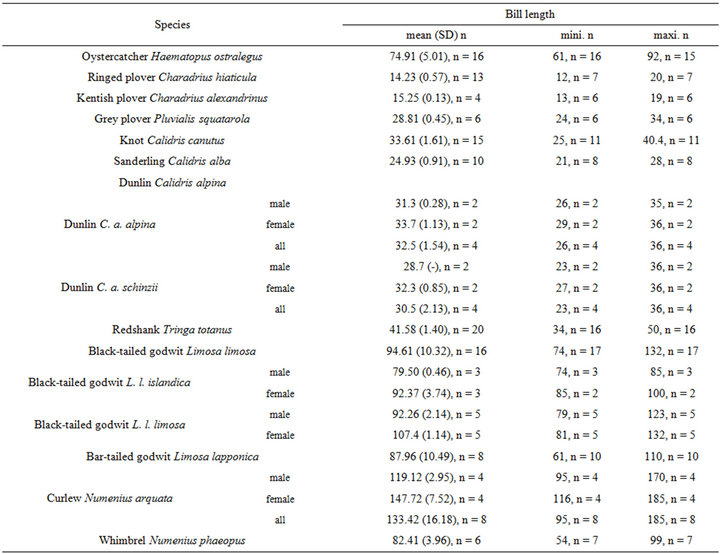
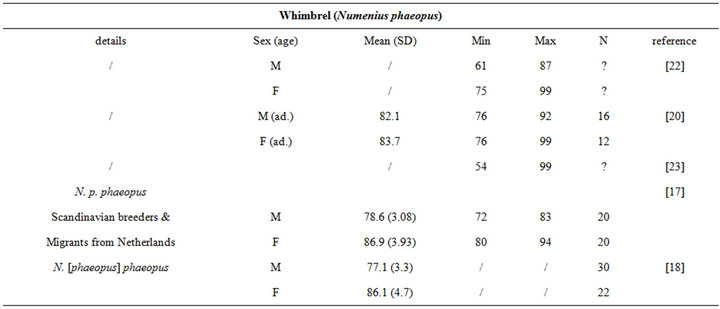
Table 1. Literature review of bill measurements of the 12 main coastal wader species in North-Western Europe: mean (SD: standard deviation), minimum (min), maximum (max), n: number of published data used (see appendix for details).
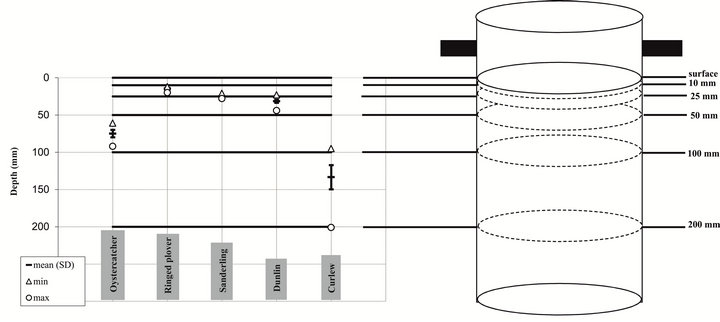
Figure 2. Illustration of the case study in the Canche estuary. Grooves were placed in the core according to the bill length range of the five studied waders species.
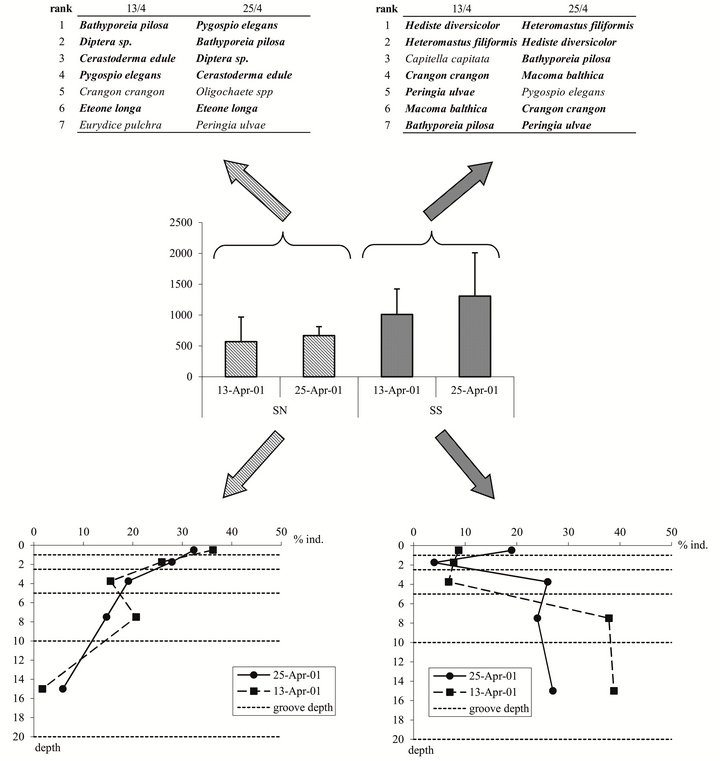
Figure 3. Number of individuals of all species per sample (m²) (+SD) at two sites (Northern Site: NS; Southern Site : SS) and two dates (13 and 25 April 2001) (middle panel), Species composition at the two sites/dates (top panel), Vertical distribution of the individuals (%) at the two sites/dates (bottom panel).
If we focus on the whole study period (April to August) (Figure 4), for birds with shortest bill (Sanderling and Ringed Plover), the accessible fraction was variable according to the site: 0% to 83% in the northern estuary and 11.9% to 76.2% in the southern part (Figure 4). The same results hold for the other species.
The importance of setting a range of probing depth for each wader species is illustrated in the Dunlin and the Oystercatcher cases. Within the Northern Site, a weaker percentage of preys was accessible to Dunlins with short bills (mean: 26.7%) compared to individuals with long bills (mean: 69.5%). In the southern part, as fewer benthic invertebrates were located in the 2.5 - 5 cm layer (from April to August), the difference in accessibility was less important, i.e. 39.1% versus 57.7%. It can then be concluded that Dunlins with short bills would prefera-
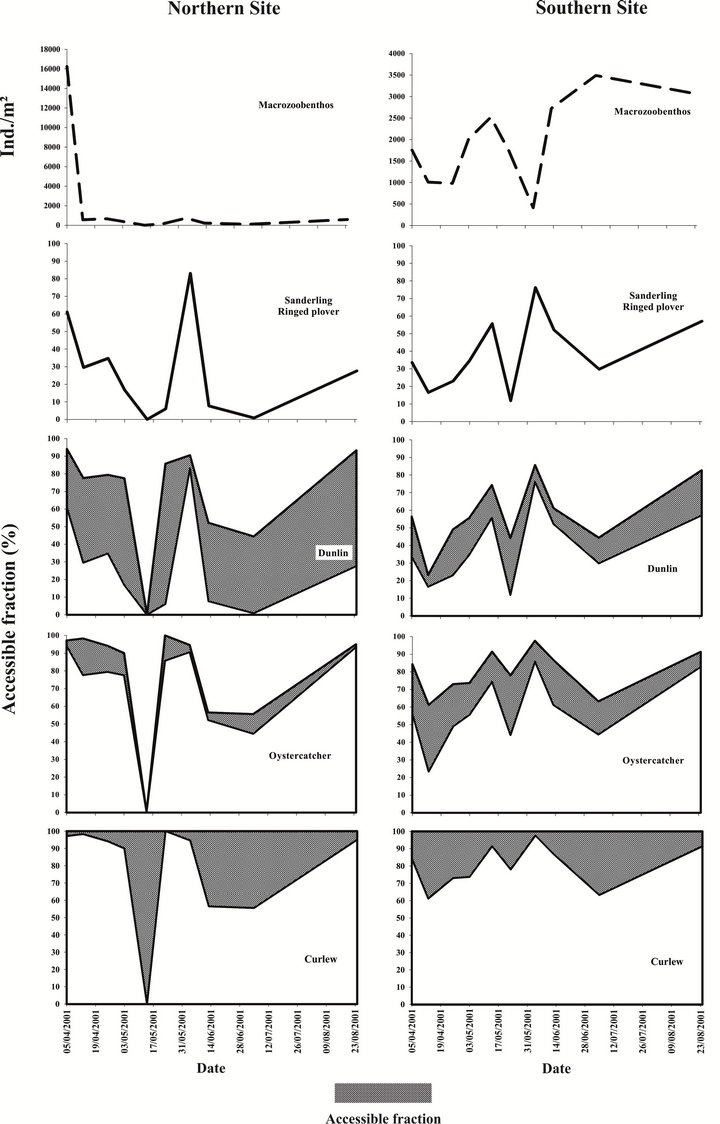
Figure 4. Percentage range of the macrobenthic fraction accessible to waders in the Canche estuary from April to August. For each species (except Sanderling and Ringed Plover) the lowest percentage is the fraction accessible by 100% of the birds (i.e. minimum bill length), the upper limit corresponds to the percentage of potential preys accessible to birds with the longest bill.
bly collect preys in the southern part while those with long bills would collect preys in the northern part. On the contrary, as a significant part of the preys in the southern estuary were located in the 5 - 10 cm layer throughout the sampling period, Oystercatchers with short bills would preferably search for buried preys in the northern part of the area (mean percentage accessible: 69.5 against 57.7 in the north) whereas those with long bills could use both sites (mean percentage accessible: 78.1 in the north against 80.1 in the south).
4. Discussion
4.1. Advantages and Limits of the Multilevel Core Sampler
According to Johnson [27], there is no way to observe the vertical distribution of the infauna in the field without disturbing the animals as some could withdraw deeper into the substrate in response to the attempts to determine their position. As a consequence, subsequent observations of infaunal distribution are likely to indicate the maximum burrowing depth. Using the multilevel core sampler described here, this bias is minimised because both the corer and dividing plates are inserted rapidly. But in cases of worms and/or shellfish cut in half by the plates inserted, the individual was counted in the layer with the head (worms) or with the largest part of the body (shellfish).
Classical core samplers can also trigger losses of upper layer substrate and small organisms. This was the case for Esselink & Zwarts [13] when using cores placed horizontally and with the top against an upright shelf and broken sideway to study burrow depth of Hediste diversicolor. Losses of the upper substrate layer (usually not more than 0.5 cm) were corrected using a pin whereas loss of small individuals was corrected by measuring separately the burrow depth of these small worms. Our multilevel core device is not impacted by the abovementioned bias as it preserves sediment structure and characteristics in only one step manipulation. Of course, our multilevel sampler cannot be used to accurately define the vertical distribution of a target species, i.e. to measure to the nearest millimeter the location of each individual in the sediment e.g. [12,28]. However, it gives an overview of species distribution within a sediment core. In addition, the aim of this core is not only to draw the depth profile of one target species, but to assess multispecies vertical distribution and to test whether and how it is related to waders foraging.
4.2. On the Importance to Define a Range of Bill Length Values
Most of the results published on the accessibility of preys to waders usually use a single average bill length for birds, e.g. [16,29,30]. In their study on Knots in the Wash estuary, Reading & McGrorty [29] first used a mean bill length of 33 mm and estimated the macrofaunal biomass accessible in the upper 30 mm of sediment. More recently, Zwarts & Wanink [4] estimated this bill length to be 30 - 35 mm and found out that only preys located in the upper 25 mm were accessible. According to Zwarts & Blomert [14], with a bill length of 35 mm, only the upper 10 - 20 mm layer is searched thoroughly. This is highly congruent with our literature survey that indicates a mean bill length of 33.61 mm with a standard deviation of 1.61mm and a range from 25 mm to 40.4 mm (Table 1). With such variability in both bill length [2] and foraging behaviour (not address here but see [3] for a review), it is difficult to estimate the fraction of accessible preys from a single bill length value. A range of bill length values would much better describe the variability of accessible preys. Thus, setting the limits of the metal plates insertion close to the bill length range of the studied birds (Figure 2) allowed to calculate a range of accessible preys as illustrated with our example. The upper limits give the fraction accessible to 100% of the studied species whatever bill length whereas the lower limits correspond to preys accessible to birds having the longest bill. However, depending of the aim of the study, these limits can be set differently using data in Table 1 (and the related Appendix). For example, limits can be chosen to represent bill length standard deviation and/or means. Specifically, assuming that bill length distribution follows a Gaussian distribution, i.e. 68%, 95% and 99% of the population studied require limits set to S.D, 1.96 ´ S.D. and 2.57 ´ S.D., respectively [31]; e.g. for Oystercatcher this leads to gives 69.90, 74.91 and 79.92 mm that can be rounded at 70, 75 and 80 mm.
4.3. Habitat Quality Assessment
The use of cores to sample muddy sediments and macrobenthic invertebrates is not new [27,29]. However, the device we present in this paper offers great opportunities and goes a step further in the study of birds, benthic macrofauna and their potential trophic interactions. Reading & McGrorty [29] already used a square and small (10 ´ 10 ´ 15 cm deep) core with metal plates inserted horizontally at several depths. It was designed to study one specific prey (Macoma balthica) and the six grooves heights chosen were not linked to wader bill length (3 cm was the only depth a posteriori related to bill length of Knot Calidris canutus). It was built in stainless steel; it is hence not transparent and make difficult to evaluate sample quality. The core proposed here is made of transparent plastics thus permitting to check for sample quality. Transparency indeed allows direct sediment observation as well as characterization of sediment vertical structure. The use of a Benthic Quality Habitat index (BHQ) (sensu Nilsson & Rosenberg [32]) could then be implemented with the multilevel core sampler. For instance, at each sampled station, two images could be taken: one surface image (area 0.025m²) and a sediment profile image (SPI) located on the opposite side of the plates. Both images would give information on sediment characteristics (texture, oxic/anoxic conditions). The latter are often related to observations of benthic epifauna or to more functional properties of the macrofauna (burrows, tubes, reworked sediment). This method follows the one proposed by Nilsson & Rosenberg [32]. In subtidal habitat these authors built a Benthic Habitat Quality (BHQ) index based on three structures characteristics: surface structures, sub-surface structures and mean depth of apparent Redox Potential Discontinuity (RPD). However, Nilsson & Rosenberg [32] related sediment characteristics to a qualitative macrofaunal sample of dominant species taken in the area of the SPI. In our case, since macrofaunal sample is taken from the same core as the SPI, macrofauna characteristics could directly be linked to the BHQ index.
5. Conclusion
In conclusion, with the multilevel core sampler device proposed here the ecological informations that can be achieved at once are threefold. It gives information about the physical structure of benthic habitats (texture, vertical stratification) and goes a step further compared to traditional benthic studies. We indeed showed that our device can 1) give knowledge about macrofauna burrowing depths, 2) give an estimation of the accessible fraction to waders (range of values based on bill length variability) and it could be used to assess BHQ. In addition, this core sampler is not only a tool to study benthic macrofauna but it offers the opportunity to relate waders and their potential preys in any aquatic ecosystem (marine or freshwater) [33].
6. Acknowledgements
We would like to thank Dr D. Vincent and Dr N. Spilmont for their comments on an earlier version of the manuscript and for improving the English and Dr L. Seuront for insightful suggestions and useful guidance in the manuscript’s completion. This study was partly funded by GDEAM under contract GDEAM/CNRS No 468.
REFERENCES
- D. S. McLusky and M. Elliott, “The Estuarine Ecosystem. Ecology, Threats and Management,” Oxford University Press, Oxford, 2004.
- J. Van de Kam, B. J. Ens, T. Piersma and L. Zwarts, “Shorebirds. An Illustrated Behavioural Ecology,” KNNV Publishers, Utrecht, 2004.
- L. Zwarts, “Waders and Their Estuarine Food Supplies,” RIZA Report Van Zee Tot Land 60, Lelystad, 1996.
- L. Zwarts L and J. H. Wanink, “The Macrobenthos Fraction Accessible to Waders May Represent Marginal Prey,” Oecologia, Vol. 87, No. 4, 1991, pp. 581-587. doi:10.1007/BF00320424
- J. J. Beukema, “Expected Changes in the Benthic Fauna of Wadden Sea Tidal Flats as a Result of Sea-level Rise or Bottom Subsidence,” Journal of Sea Research, Vol. 47, No. 1, 2002, pp. 25-39. doi:10.1016/S1385-1101(01)00095-8
- S. Degraer, A. Volckaert and M. Vincx, “Macrobenthic Zonation Patterns along a Morphodynamical Continuum of Macrotidal, Low Tide Bar/rip and Ultra-Dissipative Sandy Beaches,” Estuarine, Coastal and Shelf Science, Vol. 56, No. 3-4, 2003, pp. 459-468. doi:10.1016/S0272-7714(02)00195-6
- T. Piersma, P. De Goeij and I. Tulp, “An Evaluation of Intertidal Feeding Habitats from Shorebird Perspective: Towards Relevant Comparisons between Temperate and Tropical Mudflats,” Netherland Journal of Sea research, Vol. 31, No. 4, 1993, pp. 503-512. doi:10.1016/0077-7579(93)90062-W
- A. Eleftheriou and N. A. Holme, “Chapter 6. Macrofauna Techniques,” In: N. A. Holme and A. D. McInctyre, Eds., Methods for the Study of Marine Benthos, Blackwell, Oxford, 1984, pp. 140-216.
- C. Kraan, J. A. Van Gils, B. Spaans, A. Dekinga, A. I. Bijleveld, M. Van Roomen, R. Kleefstra and T. Piersma, “Landscape-Scale Experiment Demonstrates That Wadden Sea Intertidal Flats Are Used to Capacity by Molluscivore Migrant Shorebirds,” Journal of Animal Ecology, Vol. 78, No. 6, 2009, pp. 1259-1268. doi:10.1111/j.1365-2656.2009.01564.x
- C. Kraan, J. Van der Meer, A. Dekinga and T. Piersma, “Patchiness of Macrobenthic Invertebrates in Homogenized Intertidal Habitats: Hidden Spatial Structure at a Landscape Scale,” Marine Ecology Progress Series, Vol. 383, 2009, pp. 211-224. doi:10.3354/meps07994
- L. Zwarts and J. H. Wanink, “How the Food Supply Harvestable by Waders in the Wadden Sea Depends on the Variation in Energy Density, Body Weight, Biomass, Burying Depth and Behaviour of Tidal-Flat Invertebrates,” Netherland Journal of Sea Research, Vol. 31, No. 4, 1993, pp. 441-476. doi:10.1016/0077-7579(93)90059-2
- L. Zwarts, “Burying Depth of the Benthic Bivalve Scrobicularia plana (da Costa) in Relation to Siphon-Cropping,” Journal of experimental Biology and Ecology, Vol. 101, No. 1, 1986, pp. 25-39.
- P. Esselink and L. Zwarts, “Seasonal Trend in Burrow Depth and Tidal Variation in Feeding Activity of Nereis diversicolor,” Marine Ecology Progress Series, Vol. 56, No. 3, 1989, pp. 243-254. doi:10.3354/meps056243
- L. Zwarts and A.-M. Blomert, “Why Knot Calidris canutus Take Medium-Sized Macoma balthica When Six Prey Species Are Available,” Marine Ecology Progress Series, Vol. 83, No. 2-3, 1992, pp. 113-128. doi:10.3354/meps083113
- A. F. G. Gerritsen and A. Meiboom, “The Role of Touch in Prey Density Estimation by Calidris alba,” Netherland Journal of Zoology, Vol. 36, No. 4, 1986, pp. 530-562. doi:10.1163/002829686X00216
- J. H. Wanink and L. Zwarts, “Does an Optimally Foraging Oystercatcher Obey the Functional Response?” Oecologia, Vol. 67, No. 1, 1985, pp. 581-587. doi:10.1007/BF00378457
- S. Cramp and K. E. L. Simmons, “Handbook of the Birds of Europe, the Middle East and North Africa. The Birds of the Western Palearctic. Vol III. Waders to Gulls,” Oxford University Press, Oxford, 1983.
- M. Engelmoer and C. S. Roselaar, “Geographical Variation in Waders,” Kluwer Academic Press, Dordrecht, 1998. doi:10.1007/978-94-011-5016-3
- L. Zwarts, J. T. Cayford, J. B. Hulscher, M. Kersten, P. M. Meire and P. Triplet, “Prey Size Selection and Intake Rate,” In: J. D. Goss-Custard, Ed., The Oystercatcher: From Individuals to Populations, Oxford University Press, Oxford, 1996, pp. 30-55.
- A. J. Prater, J. H. Marchant and J. Vuorinen, “Guide to the Identification and Ageing of Holarctic Waders,” BTO, Trings, 1977.
- P. Géroudet, “Limicoles, Gangas et Pigeons d’Europe. Vol I,” Delachaux & Niestlé, Neuchâtel, 1982.
- P. Géroudet, “Limicoles, Gangas et Pigeons d’Europe. Vol II,” Delachaux & Niestlé, Neuchâtel, 1983.
- P. Hayman, J. H. Marchant and A. J. Prater, “Shorebirds. An identification Guide to the Waders of the World,” Croom Helm, London and Sydney, 1986.
- J. Del Hoyo, A. Elliott and J. Sargatal, “Handbook of the Birds of the World. Vol. 3 Hoatzin to Auks,” Lynx Editions, Barcelona, 1996.
- E. Wymenga, M. Engelmoer, C. J. Smit and T. M. Van Spanje, “Geographical Breeding Origin and Migration of Waders Wintering in West Africa,” Ardea, Vol. 78, 1990, pp. 83-112.
- N. Desroy and L. Denis, “Influence of Spring Phytodetritus Sedimentation on Intertidal Macrozoobenthos in the Eastern English Channel,” Marine Ecology Progress Series, Vol. 270, No. 1, 2004, pp. 41-53. doi:10.3354/meps270041
- R. G. Johnson, “The Vertical Distribution of the Infauna of a Sand Flat,” Ecology, Vol. 48, No. 4, 1967, pp. 571- 578. doi:10.2307/1936501
- L. Zwarts and J. H. Wanink, “Siphon Size and Burying Depth in Depositand Suspension-Feeding Benthic Bivalves,” Marine Biology, Vol. 100, No. 2, 1989, pp. 227- 240. doi:10.1007/BF00391963
- C. J. Reading and S. McGrorty, “Seasonal Variations in the Burying Depth of Macoma balthica (L.) and Its Accessibility to Wading Birds,” Estuarine, Coastal and Marine Science, Vol. 6, No. 2, 1978, pp. 135-144. doi:10.1016/0302-3524(78)90095-6
- L. Zwarts and J. H. Wanink, “How Oystercatchers and Curlews Successively Deplete Clams,” In: P. R. Evans, J. D. Goss-Custard and W. G. Hale, Eds., Coastal Waders and Wildfowl in Winter, Cambridge University Press, Cambridge, 1984, pp. 69-83.
- R. R. Sokal and F. J. Rohlf, “Biometry,” 3rd Edition, Freeman, New York, 1995.
- H. C. Nilsson and R. Rosenberg, “Benthic Quality Assessment of an Oxygen Stressed Fjord by Surface and Sediment Profile Images,” Journal of Marine Systems, Vol. 11, No. 3-4, 1997, pp. 249-264. doi:10.1016/S0924-7963(96)00111-X
- N. Spilmont, L. Denis, F. Artigas, F. Caloin, L. Courcot, A. Creach, N. Desroy, F. Gevaert, P. Hacquebart, C. Hubas, M.-A. Janquin, Y. Lemoine, C. Luczak, A. Migné, M. Rauch and D. Davoult, “Impact of Phaeocystis globosa Spring Bloom on the Intertidal Benthic Compartment in the Eastern English Channel: A Synthesis,” Marine Pollution Bulletin, Vol. 58, No. 1, 2009, pp. 55-63. doi:10.1016/j.marpolbul.2008.09.007
Appendix