Open Journal of Clinical Diagnostics
Vol. 2 No. 2 (2012) , Article ID: 19891 , 4 pages DOI:10.4236/ojcd.2012.22008
Improvement of resolution in 2-D gel analysis by simple pre-treatment of human urine with EDTA
![]()
Department of Animal Science and Biotechnology, Kyungpook University, Daegu, Korea
Email: jkylim@knu.ac.kr
Received 25 January 2012; revised 22 February 2012; accepted 8 March 2012
Keywords: Urine; EDTA-Treatment; Interfering Molecules; 2-D Gel, Resolution
ABSTRACT
Regardless of thermodynamic stability, less complex proteome than plasma, convenient and noninvasive sampling of urine, reproducibility and comparability of the data among laboratories are challenges for the urine proteome analysis. Pretreatment of urine with 10 mM EDTA in conjunction with desalting methods to remove interfering molecules significantly improved the presentation of urine proteome on 2-D gels. Statistical analysis of the average ratio of the spot numbers on 2-D gels between EDTA-treated and non-treated samples were 1.35 ± 0.167, 1.26 ± 0.091, and 1.24 ± 0.095 for dialysis, ultrafiltration, and desalting column, respectively, with the p-value of 5.85 × 10⁻⁶ for the overall comparison. This result came from the fact that EDTA-treated samples showed better resolutions with less streaks and clearer spots on 2-D gels than the control samples. The results suggest that a simple and non-fractionating EDTA-treatment can be employed to the procedures for the high resolution 2-D gel analysis and other urinary proteomic analysis.
1. INTRODUCTION
Biomarker development from urine attracts attentions from many clinicians and researchers because urine proteome is less complex and more stable than plasma. Furthermore, urine test is simple and non-invasive so that many researchers have found biomarkers for the diagnosis of renal, bladder, prostate and many other diseases [1-3].
Regardless of the fact that urine is a very stable body fluid and can be an optimal source for qualitative and quantitative biomarker discovery, the variations of the proteome profiles affected by the collection methods and the protein preparation procedures may introduce significant discrepancies in measurements [4,5]. Among many reasons for the poor reproducibility, interfering molecules in urine introduce complexity in preparation and analysis of urine proteome, and reduce reproducibility of proteome data represented, particularly, on 2-D gels. The mM level concentration of proteins and relatively higher concentration (mM level) of ions [6] make it difficult to prepare high-quality protein samples from urine for proteomic analysis. A systematic gel-based urinary proteome study using precipitation with various organic compounds or solvents, centrifugal filtration, and lyophilization to concentrate or isolate urinary proteins provided different results [7,8]. These results suggest that proper selection of sample preparation methods is very important for the reproducible and representative high-quality urinary proteomes. Furthermore, in any cases, adding any steps to the sample manipulation to remove interfering molecules can also increase complexity and reduce reproducibility. Thus, the manipulation methods should be simple and non-fractionating, if possible. The consideration of developing simple manipulation method for urinary protein preparation is very demanding as one of the important issues in urine proteome analysis for biomarker development is the reproducibility of the proteome datasets obtained from many different laboratories using standardized protocols [9,10]. On this stand point, simple and effective removal of interfering molecules from urine could improve the standardized protocols for sample preparation and analysis of the urine proteomes.
We have observed in the course of the urine protein preparation by dialysis that the longer the dialysis periods were passed, the better the resolutions on 2-D gels we got. From this observation, we postulated that interfering molecules on isoelectric focusing were most possibly divalent ions, associate so tightly with urinary proteins that they could not be simply removed even by dialysis. Thus, we pre-treated urine with ethylenediamine tetra-acetate (EDTA) and obtained significantly improved resolutions and reproducibility in 2-D gel analysis.
2. RESULTS AND DISCUSSION
The second morning midstream urine samples were collected from 4 groups with 5 people in each, pooled with the same volume from each sample, and divided into two groups for untreated-control and EDTA-treated groups. Proteins were prepared from the urine samples by dialysis, ultrafiltration, and desalting column. As loading an equal amount of proteins for 2-D gel analysis was crucial, the protein amount in each sample was determined by Bradford method [11] and 1-D gel electrophoresis followed by CBB R-250 staining. Known from the previous experiments that the majority of human urine proteins were separated within the pH range of 4 - 7 [12], equal amount of proteins for each comparing group was loaded to 7 cm immobilized-pH-gradient (IPG) (pH 4 to 7) strips for the first dimensional separation. The protein spots from the EDTA-treated samples showed better resolutions on 2-D gels than the control samples in terms of reduced smears, better presentation of higher molecules, and distinctive spot contours (Figure 1). The average ratio of the spot numbers on 2-D gels between the control and the EDTA-treated samples in the dialysis group was 1.35 with the standard deviation of 0.167. The ANOVA analysis showed significant difference in spot numbers between the EDTA-treatment and control groups with a p-value of 0.0257 (Table 1). As we had significant improvement on the resolution of 2-D gel using the urine proteins treated with EDTA followed by dialysis, we tried ultrafiltration and Sephadex G-25 desalting column to remove interfering molecules from the urinary proteins
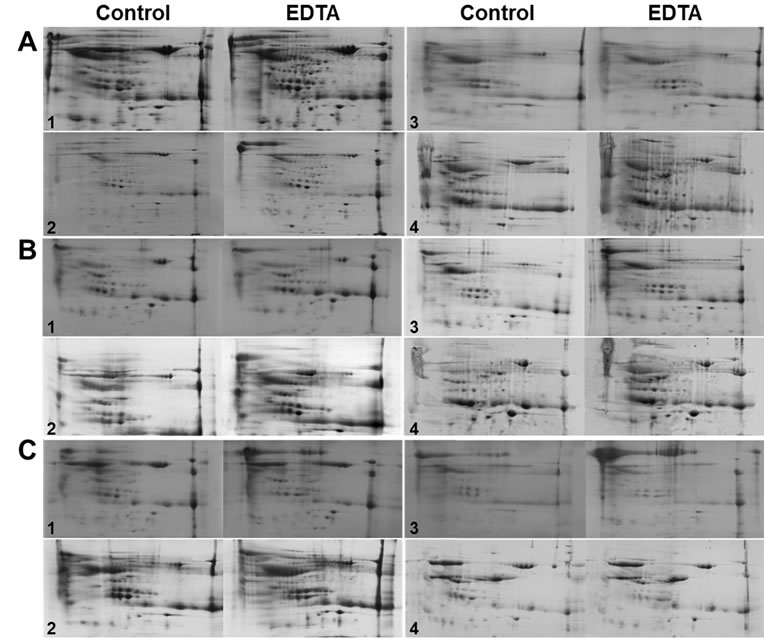
Figure 1. Comparison of 2-D gel images of control and EDTA-treated urine samples. Urinary proteins were prepared from the un-treated control and EDTA-pre-treated urine by dialysis (A) ultrafiltration, (B) and desalting column, (C) Equal amount of proteins were loaded to IPG strips (pH 4 - 7) for the first dimensional separation on 2-DE for each comparing pair. The urine samples of each group (designated in numbers 1 to 4) were collected from 5 people and pooled. The pooled urine was divided into control and EDTA-treated groups. Then, the urinary proteins were prepared by dialysis, ultrafiltration, and passing through desalting column. The urinary proteins separated on 2-D gels were visualized by CBB R-250 staining.
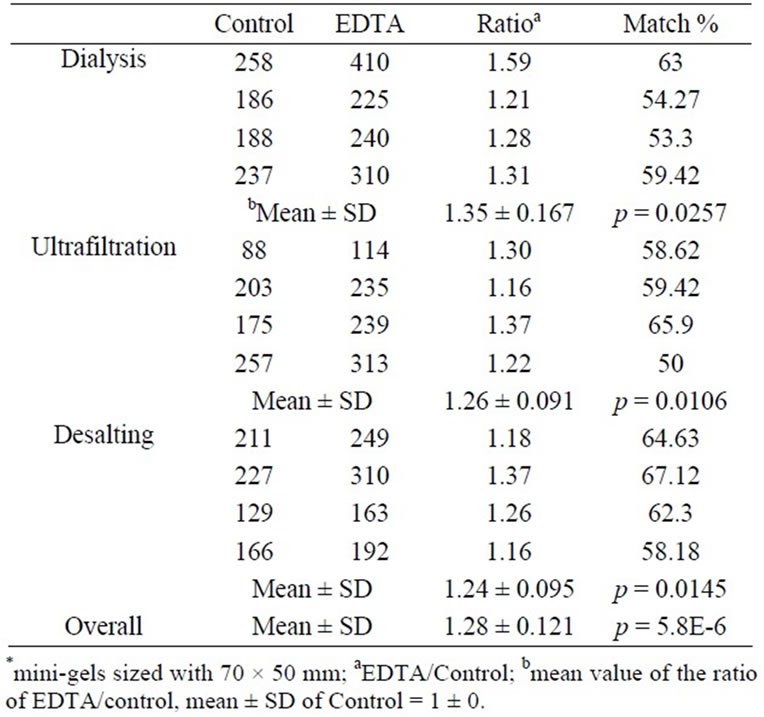
Table 1. Statistical comparisons between the spot numbers of EDTA-treated and control urine proteins on 2-D gels*.
for 2-D gel analysis. The spot number representation on 2-D gels with EDTA-treatment were also significantly improved for both methods with the ratios of 1.26 and 1.24, and the standard deviations of 0.091 and 0.095 compared to the control samples with p-values of 0.0106 and 0.0145, respectively. The overall comparison between control (n = 12) and EDTA-treated groups (n = 12) showed a significant difference in spot numbers on 2-D gels with a p-value of 5.85 × 10⁻⁶. The improvement of the spot number representation on 2-D gels by EDTAtreatment suggests that divalent cations tightly attached to proteins are dissociated by chelation with EDTA and facilitated removal on dialysis, ultrafiltration and desalting column procedures.
The major divalent ions in urine are calcium and magnesium [6]. The divalent cations in the body are involved in numerous interactions with proteins, including protein folding, and enzyme catalysis in many enzymes [13,14]. The information on the binding affinity of magnesium to proteins is scarce. However, tight binding of calcium to specific plasma proteins are already known to regulate the concentration of calcium at local area, e.g., renal tubules, and prevent unwanted calcification, such as renal stones and arterial stiffness [15-17]. The binding of calcium to human plasma albumin, alpha, beta, and gamma globulins, which are the major proteins in plasma and urine, was studied with the aid of an ultracentrifuge. The amount of calcium bound to per 1 g of these separated proteins was determined to be about 0.8 mg [18]. Being considered that approximately 0.20 mg of proteins in 0.12 mL of rehydration buffer were used for the first dimensional separation by isoelectric focusing (IEF) in this study, the final concentration of total divalent ions in IEF could be up to 25 μM, which is enough ion concentration for interfering IEF.
It is important to consider that procedures for removal of interfering molecules are only performed when necessary, and avoided fractionation so as not to compromise the integrity and relative abundance of the proteins in the sample [19]. There can be many ways of removing interfering small molecules including ions from urine. However, if the small molecules have high affinity to proteins, it requires further dilutions and longer time for dissociation to be removed. In the presence of molar excess EDTA, divalent ions can be chelated and dissociated from the bound proteins. Removal of EDTA along with other interfering substances from the treated urine samples can be done by desalting processes. Simple but effective sample preparation protocols can provide better chance for obtaining the comparable urinary proteomic results generated from different groups.
During the period of the preparation of this manuscript, Candiano et al. [20] has reported that up to 3300 protein spots were separated on 2-D gels using combinatorial peptide ligand library bound-beads. The accomplishment is indeed marvelous and surpassing the results of over 1500 urinary proteins presented by using liquid chromatography and sensitive tandem mass spectrometric analyses [21]. However, although these methods could identify proteins in low dynamic ranges in urine, they still have a limitation of showing relative concentrations among other proteins in urine or other biological fluids.
The EDTA-treatment method, which is non-fractionating, can improve the standardized protocols for sample preparation and analysis of the urine proteomes. Furthermore, as urine proteome partially represents plasma proteome, removing divalent metal ions including calcium by EDTA-treatment can also improve the reproducibility and resolution of gel-based and even non-gelbased proteome analysis in plasma, cerebrospinal fluid, and seminal fluid for the purpose of clinical diagnosis.
3. MATERIALS AND METHODS
3.1. Collection of Urine and Preparation of Urinary Proteins
The midstream second morning urine samples were collected from 4 groups of 5 healthy members (total 20) without any medication in a month or menstrual period within two weeks. The captured urine samples were frozen right away in polypropylene tubes and thawed in running water with agitation. An equal volume of urine from each individual was mixed for each group. The pooled urine samples were centrifuged at 15000 × g to remove any particulates. The supernatants were divided into two groups. To one of the two groups, 10 mM of EDTA was added and incubated for 1 h on ice before further treatment.
Dialysis; Urine samples in dialysis tubings with a Molecular-Weight-Cut-Off (MWCO) 3500 (Spectrapor, Dallas, TX) were dialyzed against 50 volumes of distilled water with 5 changes, which is equivalent to 3.12 × 10⁸ dilutions, in 24 h at 0˚C. The dialyzed urine samples were concentrated by lyophilization and dissolved in the minimal volume of deionized water. Ultrafiltration; Prior to the ultrfiltration the urine samples were filtered through low protein binding membrane with a pore size of 0.45 μm to eliminate any cells and insoluble precipitates. A centrifugal filter unit, Ultra-15 (Millipore, Bedford, MA), was used to concentrate 200 mL of urine to ~1 mL and to desalt the urine samples by repeated adding 15 mL of deionized water three times with centrifugation at 4000 × g. The final concentrated and desalted samples were collected in 2 mL tubes for further processing. Sephadex G-25 desalting column; Samples, less than one third of the bed volume, were desalted on Sephadex G-25 (Sigma, MO) column, of which height was 75 cm and bed volume was 300 mL. Flow rate was controlled to 4 mL per min. The eluate in the void volume from the column was collected and lyophilized for concentration and dissolved in minimal volume of deionized water.
To eliminate the interference in IEF by the pigments in urine, the proteins were precipitated with 10% trichloroacetic acid (TCA) and washed three times with 100% ethanol before dissolved in appropriate volume of rehydration buffer containing 7 M urea, 2 M thiourea, 4% 3-[(3-cholamidopropyl) dimethylammonio]-1-propanesulfonate (CHAPS), 50 mM dithiothreitol (DTT), and 0.2% ampholytes (pH range 3 to 10). Protein concentrations were measured by the Bradford method [11] using a protein assay kit (BioRad, Hercules, CA).
3.2. 2-DE and Image Analysis
One hundred and twenty μg of the proteins in 125 μL of rehydration buffer were focused on 7 cm IPG strips (BioRad, Hercules, CA) with a pH range of 4 to 7 for the first dimension. Focusing was done at 4000 V for 24000 V-h. The IEF gel strips were equilibrated with equilibration buffer I containing 6 M urea, 0.375 M Tris-HCl, pH 8.8, 2% SDS, 20% glycerol, and 100 mM DTT for 15 min, and then equilibrated with equilibration buffer 2 containing 100 mM iodoacetamide and 0.002% bromophenol blue instead of 100 mM DTT in equilibration buffer 1 for 15 min. The equilibrated IEF gel strip was placed on 12% sodium dodecylsulfate-polyacrylamide gel electrophoresis (SDS-PAGE) for the second dimension. The separated protein spots on gels were stained with Coomassie Brilliant Blue R-250 for 2 h at RT and destained in destaining solution containing 5% acetic acid and 50% methanol in deionized water. The destained gels were scanned by a reflector mode using an Epson Perfection V700 scanner (Nagano, Japan). The image analysis software, PDQuest v7.3 (BioRad), was used to detect the spot numbers and to match the spots on 2-D gels. The 2-D gel images of the control samples were assigned as master images and compared with the images of the EDTA treated counterpart samples. The match % was given according to the spot numbers and positions on the compared gels while the score for the self-matching was 100%.
3.3. Statistical Analysis
The spot numbers detected by the image analyses from control groups and EDTA treated groups were statistically compared. The SPSS software program (ver. 17, SPSS Inc., Chicago) was used to assess the statistical signifycances in spot number representation. P-values of 0.05 or less were considered to be significant from the ANOVA bidirectional paired-sample test using the spot numbers on 2-D gels.
4. ACKNOWLEDGEMENTS
This research was supported by Biomedical Proteome Research Center funded by the Ministry of Health and Welfare, Republic of Korea (A030003).
REFERENCES
- Pisitkun, T., Johnstone, R. and Knepper, M.A. (2006) Discovery of urinary biomarkers. Molecular and Cellular Proteomics, 5, 1760-1771. doi:10.1074/mcp.R600004-MCP200
- Thongboonkerd, V. (2008) Urinary proteomics: towards biomarker discovery, diagnostics and prognostics. Molecular BioSystems, 4, 810-815. doi:10.1039/b802534g
- Raimondo, F., Morosi, L., Chinello, C., Magni, F. and Pitto, M. (2011) Advances in membranous vesicle and exosome proteomics improving biological understanding and biomarker discovery. Proteomics, 11, 709-720. doi:10.1002/pmic.201000422
- Lee, R.L., Monigatti, F., Briscoe, A.C., Waldon, Z., Freeman, M.R. and Steen, H. (2008) Optimizing sample handling for urinary proteomics. Journal of Proteome Research, 7, 4022-4030. doi:10.1021/pr800301h
- Molina, L., Salvetat, N., Ameur, R.B., Peres, S., Sommerer, N., Jarraya, F., Ayadi, H., Molina, F. and Granier, C. (2011) Analysis of the variability of human normal urine by 2D-GE reveals a “public” and a “private” proteome. Journal of Proteomics, 75, 70-80. doi:10.1016/j.jprot.2011.06.031
- Putnam, D.F. (1971) Composition and concentrative properties of human urine. NASA contractor report. http://ntrs.nasa.gov/archive/nasa/casi.ntrs.nasa.gov/19710023044_1971023044.pdf
- Thongboonkerd, V. (2007) Practical points in urinary proteomics. Journal of Proteome Research, 6, 3881-3890. doi:10.1021/pr070328s
- Thongboonkerd, V., Chutipongtanate, S. and Kanlaya, R. (2006) Systematic evaluation of sample preparation methods for gel-based human urinary proteomics: Quantity, quality, and variability. Journal of Proteome Research, 5, 183-191. doi:10.1021/pr0502525
- Theodorescu, D. and Mischak, H. (2007) Mass spectrometry based proteomics in urine biomarker discovery. World Journal of Urology, 25, 435-443. doi:10.1007/s00345-007-0206-3
- Yamamoto, T., Langham, R.G., Ronco, P., Knepper, M.A. and Thongboonkerd, V. (2008) Towards standard protocols and guidelines for urine proteomics: A report on the human kidney and urine proteome project (HKUPP) symposium and workshop. Proteomics, 8, 2156-2159. doi:10.1002/pmic.200800138
- Bradford, M. A. (1976) A rapid and sensitive method for the quantitation of microgram quantities of protein utilizing the principle of protein-dye binding. Analytical Biochemistry, 72, 248-254. doi:10.1016/0003-2697(76)90527-3
- Oh, J., Pyo, J.-H., Jo, E.-H., Hwang, S.-I., Kang, S.-C., Jung, J.-H., Park, E.-K., Kim, S.-Y., Choi, J.-Y. and Lim, J. (2004) Establishment of a near-standard two-dimensional human urine proteomic map. Proteomics, 4, 3485-3497. doi:10.1002/pmic.200401018
- Romani, A.M. and Scarpa, A. (2000) Regulation of cellular magnesium. Frontiers in Bioscience, 5, 720-734. doi:10.2741/Romani
- Ong, D.S., Mu, T.W., Palmer, A.E. and Kelly, J.W. (2010) Endoplasmic reticulum Ca2+ increases enhance mutant glucocerebrosidase proteostasis. Nature Chemical Biology, 6, 424-432. doi:10.1038/nchembio.368
- Verkoelen, C.F. and Verhulst, A. (2007) Proposed mechanisms in renal tubular crystal retention. Kidney International, 72, 13-18. doi:10.1038/sj.ki.5002272
- Schlieper, G., Westenfeld, R., Brandenburg, V. and Ketteler, M. (2007) Inhibitors of calcification in blood and urine. Seminars in Dialysis, 20, 113-121. doi:10.1111/j.1525-139X.2007.00257.x
- De Yoreo, J.J., Qiu, S.R. and Hoyer, J.R. (2006) Molecular modulation of calcium oxalate crystallization. American Journal of Physiology Renal Physiology, 291, 1123- 1131. doi:10.1152/ajprenal.00136.2006
- Held, I. R. and Freeman, S. (1964) Binding of calcium by human plasma proteins under simulated physiologic conditions. Journal of Applied Physiology, 19, 292-296.
- Berkelman T. (2008) Removal of interfering substances in samples prepared for two-dimensional (2-D) electrophoresis. Methods in Molecular Biology, 424, 51-62. doi:10.1007/978-1-60327-064-9_5
- Candiano, G., Santucci, L., Bruschi, M., Petretto, A., Ambrosio, C.D., Scaloni, A., Righetti, P.G. and Ghiggeri, G.M. (2012) “Cheek-to-cheek” urinary proteome profiling via combinatorial peptide ligand libraries: A novel, unexpected elution system. Journal of Proteomics, 75, 796-805. doi:10.1016/j.jprot.2011.09.018
- Adachi, J., Kumar, C., Zhang, Y., Olsen, J.V. and Mann, M. (2006) The human urinary proteome contains more than 1500 proteins, including a large proportion of membrane proteins. Genome Biology, 7, R80.1-R80.16.