Open Journal of Ecology
Vol.4 No.4(2014), Article ID:44359,10 pages DOI:10.4236/oje.2014.44022
Open Source GIS Software Options for Forestry Education in Papua New Guinea
David Lopez Cornelio
Department of Forestry, PNG University of Technology, PMB, Lae, Papua New Guinea
Email: davlzo26@gmail.com
Copyright © 2014 by author and Scientific Research Publishing Inc.
This work is licensed under the Creative Commons Attribution International License (CC BY).
http://creativecommons.org/licenses/by/4.0/


Received 6 November 2014; revised 9 December 2014; accepted 25 December 2013
ABSTRACT
Although open source softwares (OSS) for GIS and Remote Sensing are rapidly expanding and improving in the global context, there has been uncertainty at higher education institutions in developing countries, such as the department of forestry (Dfo) at Unitech, Papua New Guinea (PNG), regarding appropriate GIS softwares and hardware to acquire and use for teaching and research purposes. The paper briefly describes the characteristics of some mature OSS and discusses their main capabilities, advantages and disadvantages. Their adoption in the Dfo curricula may be advantageous in the long term, considering issues of learning curve steepness, versatibility, affordability, effectiveness, and documentation available on them.
Keywords
Open Source Software; GIS Software; Forestry Education

1. Introduction
GIS is a key technology for developing countries in domains such as environmental protection, urban management, agricultural production, deforestation mapping, public health assessment, and socioeconomic measurements. It is defined as a system of software components that maintain a spatially aware database, provides analytical tools that enable spatial queries of the database, allows the association of locations with imported graphical data, and provides graphical and tabular output. The open source components are distinguished by the availability of source code under free and/or open source software licences, by access to infrastructures such as version control systems for source code, bug trackers, mailing lists and at partly organised communities, and by the documentation of external dependencies in the build and install system (Figure 1). These qualities may vary across projects, with consequences for the ease of software stacking (or otherwise) experienced in practice [1] . A topic of particular interest is the adoption of OSS in developing countries as a means of reducing licensing
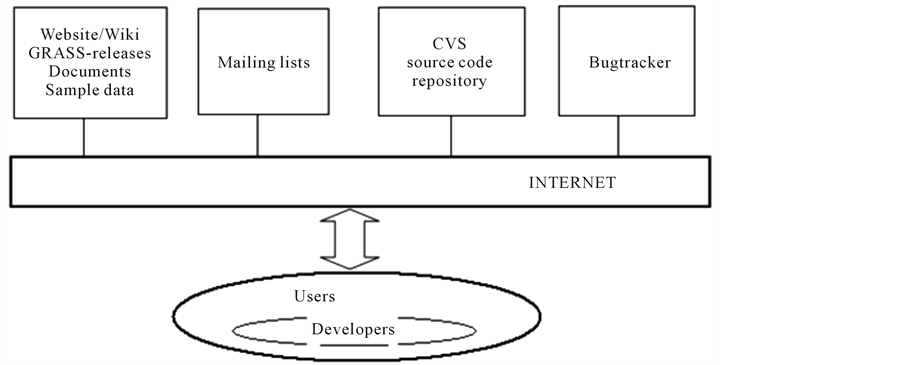
Figure 1. Development model: Developers’ and users’ interaction with semi-automated development tools over the internet.
costs and of promoting indigenous technological development.
Large scale environmental and socio-economic applications compel OSS to include significant spatial analysis capacities to meet the needs of end-users [2] in areas such as spatio-temporal data models [3] , geographical ontologies [4] , spatial statistics and spatial econometrics [5] , cellular automata [6] , and environmental modeling [7] .
2. Assets and challenges for GIS Implementation among foresters in PNG
Most third year students at Dfo understand the use and usefulness of maps and basic surveying tools, often needed when they are employed either by PNG Forest Authority, NGOs, logging companies or private projects; in many cases at remote areas with the challenge to solve practical problems in situ. Most of them are also financially able to purchase a personal computer, have intermediate computer skills, and can access the internet. However, besides the high acquisition cost of latest digital data, most areas in the country are of difficult access, and inter institutional coordinations to implement the highly publisized Reducing Emissions from Deforestation and forest Degradation (REDD) mechanism, negotiated since 2005 by the United Nations Framework Convention on Climate Change (UNFCCC), are still weak. Only few PCs at the Dfo are in working status (for GIS), and the license for propietary GIS software seldom can be renewed on time. Even though there are no preliminary subjects on cartography, the one on GIS has to be completed in 13 weeks. Other inconveniences are frequent cut downs of power supply, narrow internet bandwidth connection, low graduates continuity rate on GIS projects (less than 10% of them), and budget shortage to upgrade labs and equipment.
3. Causes of Software Dependence
Users are concerned on the long-term maintenance of their files and applications, the sustainability of OSS projects, and costs of data conversion (commercial GIS products use proprietary data formats) [8] ; besides them, each GIS adopts a different data model and user interfaces training for effective use. However, the algorithms of commercial softwares cannot be examined neither distributed, since the original software is required to run the model. OSS web mapping technologies, unlike their proprietary counterparts have developed on the basis of specific application needs. Over the last years sophisticated GIS software projects were designed with the aim to develop free software for numerous purposes, ranging from internet map server applications (MapServer) and spatial database management systems (PostGIS), to desktop GIS for data editing and analysis (QGIS, SAGA). The term “free software” is not used in the sense of “free-of-cost software” [9] ; it rather addresses the freedoms of the user to freely use, study, modify, and distribute software. OSS developers are often located worldwide, thus direct communication is sometimes difficult and time consuming. An approach that mitigates several software development problems is to modularize software, which is to make several logical parts independent from each other (components or libraries). This model results in one or several core libraries that contain the most important functions (e.g. data input and output, geometry and feature model, user interface classes, etc.) and additional libraries that are build on top of them providing the final GIS functionality, allowing the distribution of a basic application that contains core GIS functions (Figure 2); whereas advanced or special GIS functionality can be delivered via so-called plug-ins and extensions. This is the case of GRASS, QGIS, MapWindow, gvSIG, uDig and OpenJUMP projects. Their focus on certain GIS tasks has resulted in a flexible OSS GIS user community that chooses the best software for each task to accomplish [9] . The Open Source Geospatial Foundation (http://osgeo.org) was created to bundle several OSS projects, including GRASS.
4. Open Source GIS Projects
New projects are appearing in the internet with enhanced capabilities and new applications with different levels of complexity (Figure 3).
4.1. The Geographic Resources Analysis Support System (GRASS)
Released in the 1980s at the Construction Engineering Research Laboratory (CERL) of the United States Army for military applications; evolving into one of the most comprehensive, general purpose OSS. GRASS
(http://grass.osgeo.org) is a raster/vector GIS combined with integrated image processing and data visualization
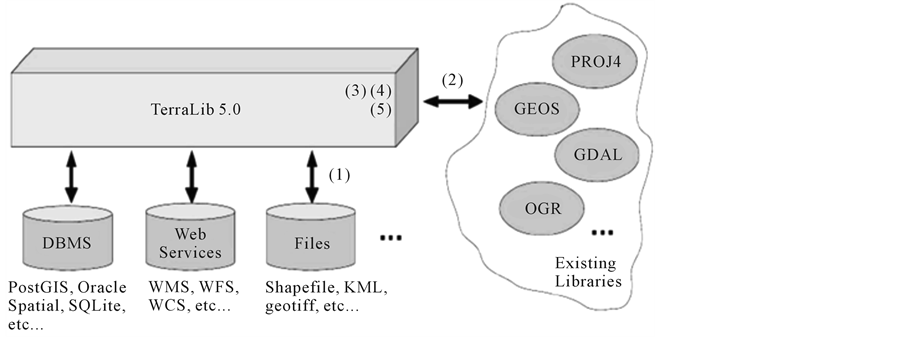
Figure 2. Envisioned developments in TerraLib 5: (1) Support to different kinds of data sources; (2) Extensive use of existing libraries; (3) More modular, simpler and more easily extensible architecture; (4) OGC compliant (SFS-SQL, OGC Web Service, etc.); (5) Represent and query spatio-temporal data (adapted from [1] ).
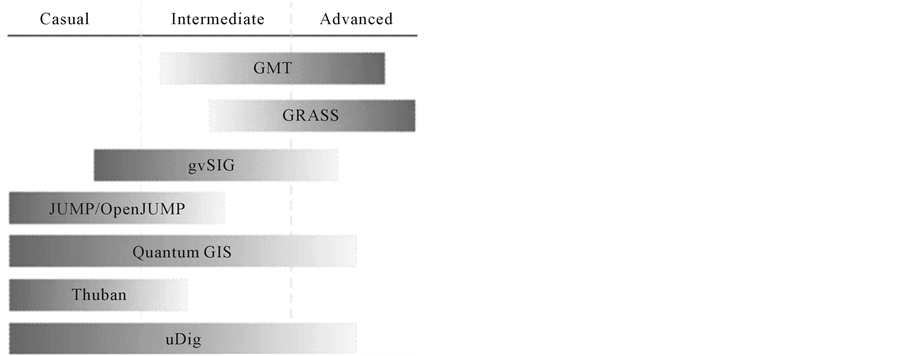
Figure 3. Functionalities complexity of some OSS projects. Source: [10] .
subsystems. It includes hundreds of modules for management, processing, analysis and visualization of geo-referenced, spatial data. GRASS uses both an intuitive graphical user interface as well as command line syntax for ease of operations. Approximately 200 of the modules that are available in GRASS GIS are integrated in pull down menus [9] . When a new project (LOCATION in GRASS terminology) is created, the projection and coordinate system must be defined. The map projection definition is stored in an internal file within the given LOCATION which can have several MAPSETs (subdirectories of the LOCATION) that are used to subdivide the project into different topics, subregions, or as workspaces for individual team members. Besides access to his own MAPSET, each user can also read maps in other users’ MAPSETs, but he can modify or remove only the maps in his own MAPSET [9] . All MAPSETs include a WIND file that stores the current boundary coordinate values and the currently selected raster resolution. When creating a new LOCATION, GRASS automatically creates a special MAPSET called PERMANENT designed to store the core data for the project, its default spatial extent in the DEFAULT_WIND file and coordinate system definitions (Figure 4).
4.2. Quantum GIS (QGIS)
Conceived by Gary Sherman [10] in C++ and Python, it is the preferred visualization environment for GRASS users providing a modern user interface and map element symbology editor. The current version of QGIS contains a graphical interface to most GRASS tools, a graphical data catalogue, and a native vector digitizer. Javagrass (http://www.jgrass.org), a client-server implementation, is an alternative user interface which includes 3D visualization. QGIS provides tools in spatial analysis, geoprocessing, geometry and data management with special focus on hydrological and geomophological analysis. The integration of a WMS and WFS server into QGIS allows a seamless crossover from desktop to the web. The Web Map Service (WMS) standard protocol serves georeferenced map images over the internet that are generated by a map server using data from a GIS database, whereas the Web Feature Service Interface Standard (WFS) provides an interface allowing requests for geo-
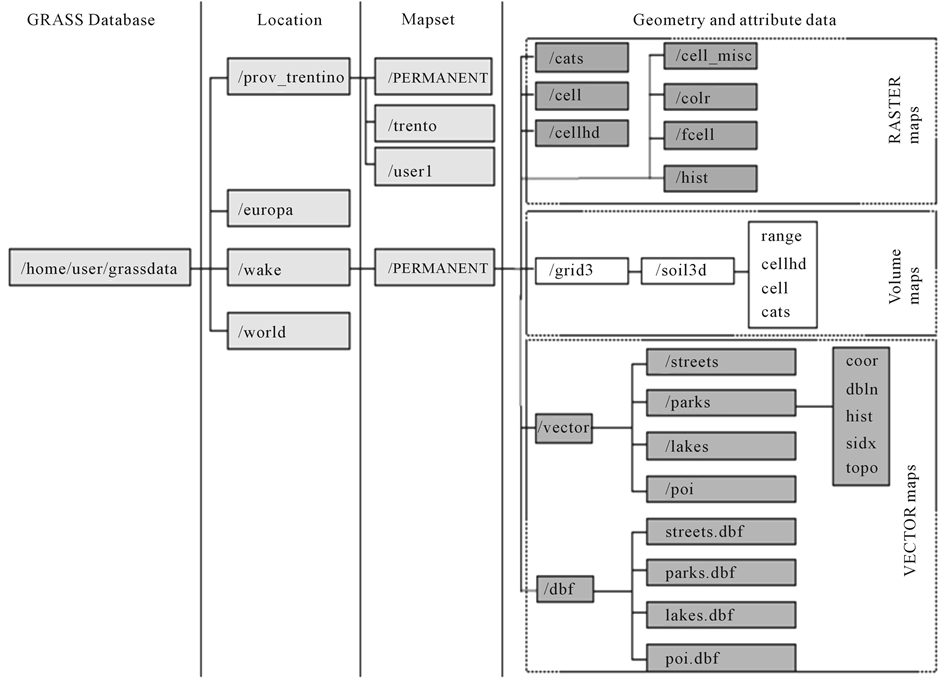
Figure 4. Organization of GRASS data directory, LOCATIONs, MAPSETs, vector and raster maps. Source: [9] .
graphical features across the web using platform-independent calls. The fusion with the uDig software project is ongoing, adding 3D visualization and further GIS analytical capabilities to uDig. There are over 100,000 Qgis users worldwide [10] .
4.3. Map Server
MapServer creates map images from spatial information stored in digital format. It can handle both vector and raster data and render over 20 vector data formats, including shapefiles, PostGIS and ArcSDE geometries, OPeNDAP, Arc/Info coverages, and Census TIGER files [11] . MapServer is template based. When first executed in response to a web request, it reads a configuration file (called the mapfile) that describes the layers and other components of the map. It then draws and saves the map. Next, it reads one or more HTML template files that are identified in the mapfile. Each template consists of conventional HTML markup tags and special MapServer substitution strings that specify the paths to the created map image, identify which layers are to be rendered, and their zoom level and direction. MapServer substitutes current values for these strings and then sends the data stream to the web server, which then forwards it to the browser. The .map file is the basic configuration file for data access and styling for MapServer. The file is an ASCII text file, and is made up of different objects. Each object has a variety of parameters available for it. All map file (or mapfile) parameters are documented in the mapfile reference. MapServer has the ability to create maps as part of a larger application so that images are written to a writable directory and referenced in templates, or it can act as a map engine and return an appropriate mime-type and binary stream directly to the client browser. The latter is a useful feature for embedding links to dynamically created maps using a simple HTML image tag. MapServer supports the automatic generation of components a user would normally find on a map including legends, scale bars and reference or key maps. It also contains powerful feature query capability. When returning a set of query results, MapServer uses one or more templates to present what sometimes can be a very complex and diverse set of information [11] . A result set can contain one or more features for one or more layers. A series of header and footer templates can be (optionally) used to frame individual feature information.
4.4. The Integrated Land and Water Information System (Ilwis)
It was initially developed and distributed by ITC Enschede (International Institute for Geo-Information Science and Earth Observation) in the Netherlands two decades ago for use by its researchers and students [12] ; since 2007 it has been distributed under the terms of the GNU General Public License. The current version is 3.8.1. It is one of the most user-friendly integrated vector and raster software programmes currently available. Similar to GRASS GIS in many respects, Ilwis is currently available natively only on Microsoft Windows, however a Linux Wine manual has been made available. Wine is a open-source software application that allows Linux users to run Windows programs. Ilwis features include digitizing, editing, analysis and display of data as well as production of quality maps. It has powerful raster analysis modules, a high-precision and flexible vector and point digitizing module, a variety of very practical tools, and a large number of user guides and training modules available for downloading.
Figure 5 shows a study case in which Ilwis was used for cyclone hazard zonation in the south of Chittagong,
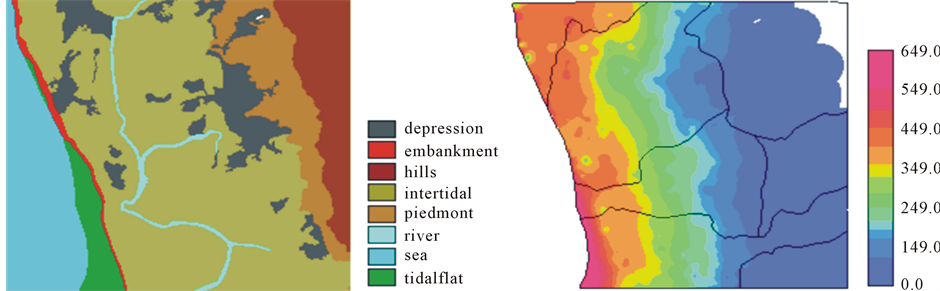
Figure 5. Overview of study area and hazard map for a surge depth of 650cm. Source: [13] .
Bangladesh, using data of the April 1991 cyclone. The project produced several maps of the expected number of casualties per village and population category caused by cyclone flood events with return periods of 5, 10, 20 and 50 years. Prior to this, maps of the flood depth per return period, population density and population vulnerability to flooding have to be made. For the calculation of the flood depths, a DTM and a linear flood-decay model were used.
4.5. Post GIS
PostGIS is a spatial database extender for PostgreSQL object-relational database. It adds support for geographic objects allowing location queries to be run in the simple features of SQL specification from the Open Geospatial Consortium (OGC) [14] . Most of the OGC standards depend on a generalized architecture captured in a set of documents collectively called the Abstract Specification, which describes a basic data model for representing geographic features, on top of which a growing number of specifications or standards have been developed to serve specific needs. The sequence to use PostGIS layers are: 1. Open the PostGIS dialog box by clicking the Add a PostGIS Layer tool, 2. Select the connection to use or create a PostGIS connection to the database, 3. Connect to the database, 4. Select the layer(s) wished to be added to the map, 5. Optionally specify a query to limit the features returned, 6. Optionally set the encoding, 7. Add the layer(s) to the map canvas by clicking the Add button [14] .
4.6. Geo Tools
GeoTools is a Java library for geographic information system (GIS) applications to be used by programmers building spatial data applications, rather than by end users looking to make maps. It is now in its second version and is used as the base of several well known OSS products including GeoServer, uDig, and GeoVISTA studio [15] .
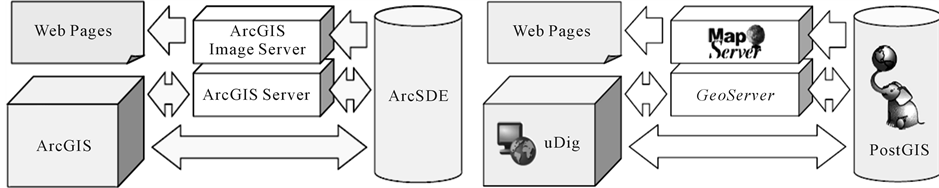
4.7. uDig
The User Friendly Desktop (uDig) Internet GIS, designed by Refractions Framework Research (http://udig.refractions.net) is a frequent framework for building other GIS platforms and applications like DIVA-GIS, and the Distant Early Warning System for Tsunamis (DEWS). It provides viewing and editing for a variety of data formats, including the usual file-based layers (shapefiles and rasters), PostGIS layers, WMS, WFS, Oracle Spatial, and DB2 that cover most of common data needs (Figure 6). It is written in Java and released under GNU Lesser General Public License. uDig has a walkthrough in Flash and also quick start directions for those who wish to complete a full version build to write plug-ins or contribute to the main build. It can use GRASS for complex vector operations and also embeds JGRASS and specialized hydrology tools from the Horton Machine. It supports shapefiles, PostGIS, WMS and many other data sources natively. Several consultancy companies use it for diverse projects, such as Spatial Systems Consulting Company (Canada), LISAsoft (Australia), CampToCamp (Switzerland and France), HydroloGIS (Italy), and Axios (Spain) [16] .
4.8. The Generic Mapping Tools (GMT)
An open-source collection of computer software tools for processing and displaying xy and xyz datasets, including rasterisation, filtering and other image processing operations, and various kinds of map projections. Written in C, It was originally developed in 1988 by Paul Wessel and Walter H. F. Smith and is currently hosted
at the University of Hawaii. The letters GMT originally stand for Gravity, Magnetism and Topography, the three basic types of geophysical data as most of its users are geoscientists. Besides its strong support for the visualisation of geographic data sets, the software includes tools for processing and manipulating multi-dimensional datasets.
It has of 60 specialized map making commands which output to publication-quality PostScript format making possible to fill the gap in hard copy map production which has troubled GRASS users for long [17] . Several attempts have been made at integrating GRASS and GMT [18] , but most are based on the “loosely coupled” approach of using intermediate files. Recent developments in the GDAL library, maturation of the Python/SWIG API, and planned Python integration in GMT 5.0 suggest that a more generalized and coherent fusion of GRASS and GMT will be possible in the near future.
GMT stores 2-D grids as COARDS-compliant netCDF files and comes with a comprehensive collection of free GIS data, such as coast lines, rivers, political borders and coordinates of other geographic objects. Users convert further data (like satellite imagery and digital elevation models) from other sources and import them. GMT stores the resulting maps and diagrams in PostScript (PS) or Encapsulated PostScript (EPS) format. Users operate the system from the command line enabling scripting and the automation of routine tasks. More or less comprehensive graphic user interfaces are available from third parties, as well as web applications, bringing the system’s functionality online.
4.9. Spring
It was designed to meet Brazil’s challenges on natural and human resources monitoring. It operates as a seamless geographical data base with a large volume of data, without being limited by tiling schemes, scale and projection [19] . It supports both raster and vector data geometries and integration of remote sensing data into a GIS, with functions for image processing, digital terrain modelling, spatial analysis and data base query and manipulation. Achieves full scalability (from desktop PCs running Windows or OS/2 to high-performance UNIX workstations), and provides an easy-to-use, yet powerful environment, with a combination of menu driven applications and spatial algebra language.
4.10. Terra Lib
The design goal for TerraLib is to support large-scale applications using socio-economic and environmental data. TerraLib supports coding of geographical applications using spatial databases, and stores data in different database management systems including MySQL and PostgreSQL. Its vector data model complies with Open Geospatial Consortium (OGC) standards. It handles spatio-temporal data types (events, moving objects, cell spaces, modifiable objects) and allows spatial, temporal, and attribute queries on the database [20] .
4.11. Terra Amazon
Is a GIS tool designed to be a multi-user editor of geographic vectorial data stored in a TerraLib model database. It engages land use and land cover classification tools as well as spatial operations between vector data, allowing transitions analysis among other applications. TerraAmazon keeps work time records for project control. It’s functionalities are extensible through plugins, such as the already existing TerraImage (PDI) and TerraPrint (plotting). The assignment of a date to this geometry establishes the creation of a scenario. It is possible to create many scenarios for the same geometry by assigning different dates to it. TerraAmazon has two user levels: Administrator and Operator [21] . The Administrator User has full access to all the menus, while the Operator User has not. Through the definition of users, each with cryptographic password, and user groups it is possible to control the access to different system functionalities. TerraAmazon is part of Brazil’s attempt to become an international reference on forest monitoring programmes. TerraAmazon accepts vector files only in shapefile (.shp) format. Raster files are accepted in the following formats: geotiff files (.tiff), jpg files (.jpg), Spring Grid Files (.spr), binary RAW files (.raw) and ESRI ASCII Grid Files (.txt) [22] .
4.12. System for Automated Geoscientific Analyses (SAGA)
A GIS originally developed at Goettingen University in Germany. The core development and software maintenance team has moved to the University of Hamburg, Germany. Version 2.0 in 2007 was the second major release of the SAGA program. The interim version 2.0.5, July 2010, is an upgrade. SAGA is a hybrid GIS with emphasis on grid (raster) functions. Vector data layers as shapes data layers. The shapes format is a non-topological vector format developed by the Environmental Systems Research Institute (ESRI). ESRI allows the shapes format to be used in noncommercial software. Vector files (and Point Cloud data layers) used with SAGA are in the shapes format.
The Application Programming Interface (API) as well as module libraries are Dynamic Link Libraries (DLL) not independ executables, and are accessed through a front end program. A Graphical User Interface (GUI) is one of the two SAGA front ends; it is a Windows-like implementation that allows to control the system [23] . Modules can also be executed by a second front end, the command line interpreter tool (CMD), which has the advantage that it can be executed from batch script files, which in turn enables a further automation of complex work flows and the routine processing of mass data. Several modules also focus on Digital Elevation Models and Terrain Analysis, like analytical hill shading, visibility analysis, local geomorphometry and geomorphographic classifications, terrain parameters related to hydrology, channel network and watershed basin extraction, and the creation of profiles and cross section diagrams.
The parameter dialog of the modules is split into a Data Objects section (further subdivided into grids, shapes and tables) for input and output datasets and an Options section with further parameters required by the module [24] . The system of the Data Object section is as follows:

Several modules exist for manipulation and analysis of vector data, like merging of layers, selection of shapes, attribute table manipulation, type conversion and automated document creation. Standard operations on vector data are polygon layer intersections and vector data creation from raster data, e.g. creation of contour lines. Raster (or gridded) data can be created from point using nearest neighbour, triangulation and other interpolation techniques. Modules for the construction and preparation of raster data, allow the re-sampling, closing of gaps and the manipulation of value by user defined rules. The raster calculator is a very flexible standard tool, where a user defined formula is used to combine an arbitrary number of raster layers. Other standard operations are skeletonisations and grid based bufferings (www.saga-gis.org).
A project is a SAGA entity for associating one or more grid systems, grid data layers, shapes data layers and tables that you want linked together. It is possible to load the project rather than each individual data layer when a group of related data layers into the work session is desired. One or more projects can be loaded for a work session. Project files can be saved in any folder with a file format suffix .sprj. The “native” saga format for raster data is the DiGeM file format [24] .
Figure 7 shows the results of an application, in which the objective was to derive polygons from an airborne CIR image to differentiate boundaries between vegetation types. The user is able to define a level of generalisation, from coarse (deciduous and coniferous trees) to fine (detection of single trees) depending on the image resolution. To determine the species or even the condition of the delineated tree object, it is possible to analyse the distribution of values of single or many spectral channels inside the object with statistical tools of special SAGA modules.
The development objectives for the SAGA program are to provide geo-scientists an effective and user friendly tool for the implementation of geoscientific methods. It is written in the C++, the source code is readily available.
5. Conclusion
The article provides an overview of some important OSS projects, several not well known and not fully documented ones; it is expected that the reader may decide and study in depth those most suitable to his/her needs. Several OSS reached a level of maturity and are robust. GIS software is a tool not a target (the geodatabase). They are also not a “silver bullet”, but the transformative potential of computing creates new opportunities to make progress on development problems. When selecting an OSS, we can apply IIWUI—“If It Works Use It.”
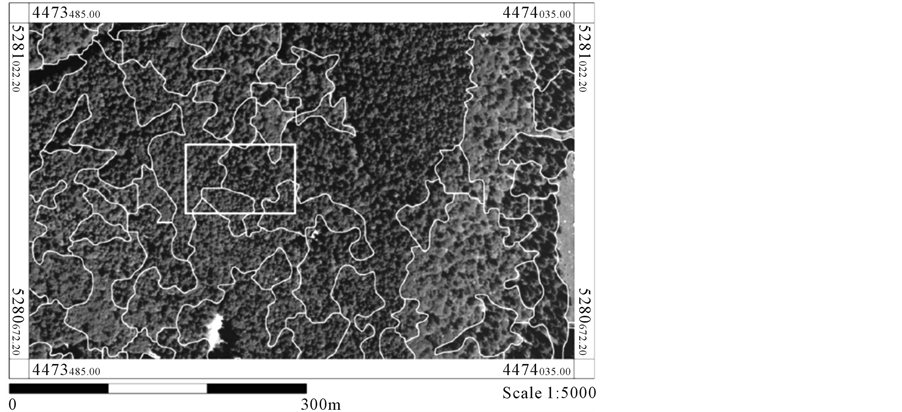
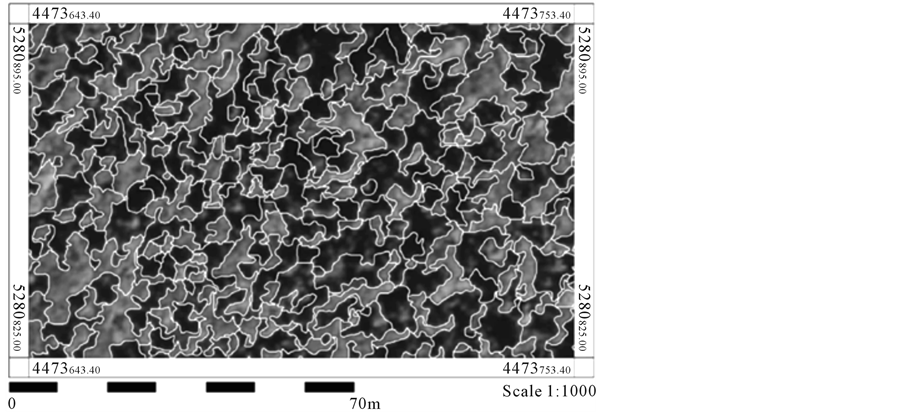
Figure 7. Results of the object oriented image classification process in which first the CIR image is coarsely segmented, and then, within an enclosed rectangle, a finer segmentation is performed. Source: [25] .
Instead of selecting a sole software package is preferably to adopt a “multi-GIS use strategy” and select specific OSS for specific tasks. Two subjects (instead of just one) on GIS and remote sensing are advisable to implement in the Dof curricula, focusing firstly on the elements of digital cartography and secondly, on practical applications of small scale forestry projects. At the same time, it is recommendable (and optional) to include a programming introductory subject in the Dof curricula.
References
- Bivand, R. (2011) Geocomputation and Open Source Software: Components and Software Stacks, Discussion Paper Series in Economics 23/2011, Norwegian School of Economics.
- Goodchild, M. (2003). Geographic Information Science and Systems for Environmental Management. Annual Review of Environment and Resources, 28, 493-519. http://dx.doi.org/10.1146/annurev.energy.28.050302.105521
- Erwig, M., Guting, R., Schneider, M. and Vazir, M. (1999) Spatio-Temporal Data Types: An Approach to Modeling and Querying Moving Objects in Databases, GeoInformatica, 3, 269-296. http://dx.doi.org/10.1023/A:1009805532638
- Fonseca, F., Egenhofer, M., Agouris, P. and Camara, G. (2002) Using Ontologies for Integrated Geographic Information Systems. Trans GIS, 6, 231-257. http://dx.doi.org/10.1111/1467-9671.00109
- Anselin, L. (1999) Interactive Techniques and Exploratory Spatial Data Analysis. In: Longley, P., Goodchild, M., Maguire, D. and Rhind, D., Eds., Geographical Information Systems: Principles, Techniques, Management and Applications, Geoinformation International, Cambridge.
- Couclelis, H. (1997) From Cellular Automata to Urban Models: New Principles for Model Development and Implementation. Environment and Planning B: Planning and Design, 24, 165-174. http://dx.doi.org/10.1068/b240165
- Burrough, P. (1998) Dynamic Modelling and Geocomputation. In: Longley, P., Brooks, S., Macmillan, B. and McDonnell, R., Eds., Geocomputation: A Primer, Wiley, New York, Chapter 9.
- Hall, G.B. and Leahy, M.G. (2008) Open Source Approaches to Spatial Data Handling. Springer-Verlag, Berlin.
- Neteler, M. and Mitasova, H. (2008) Open Source GIS: A GRASS GIS Approach. 3rd Edition, Springer, Berlin. http://dx.doi.org/10.1007/978-0-387-68574-8
- Sherman, G. (2008) Desktop GIS Mapping the Planet with Open Source Tools. Pragmatic Bookshelf Series, 358.
- Kropla, B. (2005) Beginning Mapserver: Open Source GIS Development, The Expert’s Voice in Open Source, Apress, 448.
- Ilwis Open (2014) http://www.itc.nl/ilwis/downloads/ilwis33.asp
- Damen, M.C.J. and van Westen, C.J. (2003) Modelling cyclone hazard in Bangladesh. http://www.itc.nl/ilwis/applications/application03.asp.
- PostGIS 2.2.0dev Manual, SVN Revision (12299). http://postgis.net
- Turton, I. (2008) Geo Tools. In: Open Source Approaches in Spatial Data Handling, Advances in Geographic Information Science, 2, 153-169. http://dx.doi.org/10.1007/978-3-540-74831-1_8
- Eichar, J., Garnett, J. and Lounsbury, J. () User-friendly Desktop Internet GIS (uDig), http://udig.refractions.net
- Wessel, P., Smith, W.H.F., Scharroo, R., Luis, J.F. and Wobbe, F. (2013) Generic Mapping Tools: Improved Version Released. Eos, Transactions American Geophysical Union, 94, 409-410. http://dx.doi.org/10.1002/2013EO450001
- Beaudette, D. (2007) Producing Press-Ready Maps with GRASS and GMT. Journal of Open Source Geospatial Foundation, 1, 29-35.
- Câmara, G., Souza, R., Freitas, U. and Garrido, J. (1996) SPRING: Integrating Remote Sensing and GIS by Object-Oriented Data Modelling. Computer & Graphics, 20, 395-403. http://dx.doi.org/10.1016/0097-8493(96)00008-8
- Câmara, G., Vinhas, L. and Ferreira, K. (2008) TerraLib: An Open Source GIS Library for Large-Scale Environmental and Socio-Economic Application. In: Hall, G.B. and Leahy, M.G., Eds., Open Source Approaches in Spatial Data Handling, Springer, Berlin, 247-270. http://dx.doi.org/10.1007/978-3-540-74831-1_12
- Ribeiro, V. and Queiroz, G. (2007) The Amazon Deforestation Monitoring System: A Large Environmental Database Developed on TerraLib and PostgreSQL. http://www.dpi.inpe.br/~gribeiro/apresentacoes/terraamazon_foss4g_2007.pdf
- TerraAmazon Gis. www.terraAmazon.org
- Cimmery, V. (2007-2010) SAGA User Guide, Updated for SAGA Version 2.0.5, 393.
- Olaya, V. (2004) A Gentle Introduction to SAGA GIS, 216.
- Köthe, R. and Bock, M. (2006) Development and Use in Practice of SAGA Modules for High Quality Analysis of Geodata. Göttinger Geographische Abhandlungen, 115, 85-96.