Open Journal of Ecology
Vol.4 No.2(2014), Article ID:43052,6 pages DOI:10.4236/oje.2014.42008
Subcanopy genetics—The relationship between canopy tree size and genetic variation of the savanna species Pollichia campestris Aiton (Illecebraceae)
Institute of Botany, University of Regensburg, Regensburg, Germany; *Corresponding Author: *josef.simmel@biologie.uni-regensburg.de
Copyright © 2014 Josef Simmel et al. This is an open access article distributed under the Creative Commons Attribution License, which permits unrestricted use, distribution, and reproduction in any medium, provided the original work is properly cited. In accordance of the Creative Commons Attribution License all Copyrights © 2014 are reserved for SCIRP and the owner of the intellectual property Josef Simmel et al. All Copyright © 2014 are guarded by law and by SCIRP as a guardian.
Received 30 October 2013; revised 28 November 2013; accepted 7 December 2013
KEYWORDS:Acacia; AFLP; Directed Dispersal; Frugivore; Kalahari; Nurse Tree
ABSTRACT
In savanna vegetation, trees and their canopies provide an important, but scattered habitat. Seeds of plants growing under these nurse trees often are dispersed by animals, especially birds. In the present study, we investigated the influence of tree size and frugivore-dispersal on the genetic variation of the subcanopy species Pollichia campestris, using amplified fragment length polymorphisms (AFLP). Considering the individuals under each nurse tree as subpopulations, we found the genetic variation within subpopulations to be positively correlated with the size of the respective canopy tree. Genetic variation was very low among, but high within subpopulations (ΦPT = 0.026, P = 0.18). We conclude that the low genetic variation among subpopulations is due to effective and directed dispersal (dispersal from one canopy to another) by legitimate and frugivorous dispersal agents.
1. INTRODUCTION
Savannas are a widespread vegetation type in arid regions, characterised by the co-occurrence of a continuous matrix layer and a scattered canopy vegetation [1]. While trees are forming the canopy vegetation, the matrix layer between the trees is dominated by herbaceous plants, especially grasses [2,3]. Due to several effects, including shading, nutrient accumulation and supply of nest sites and food, the trees provide a unique habitat for animals and specialised subcanopy plants [2,4-7]. These plant species typically produce small edible fruits dispersed by frugivores, and their seeds predominantly germinate in the temperature regime found in the shade of nurse trees [6]. Some species may also occur in the matrix between the canopy trees, but especially those forming fleshy fruits show a marked concentration in the canopy environment. Frugivorous animals therefore are important dispersal vectors for subcanopy plants by feeding and defecating at the resting and nest sites in and under the canopies (directed dispersal) [5,8-10]. Small and fleshy fruits mainly are dispersed by birds [6,11,12], but also by small mammals [5]. Kos [10] found the Sociable Weaver (Philetarius socius) to be a legitimate dispersal agent of Lycium bosciifolium, and this bird species generally is considered to be an important dispersal agent for fleshyfruited plants [4,5,10].
Larger trees provide larger canopy habitats, thus potentially facilitating higher numbers of subcanopy plant individuals. Both habitat size and number of individuals strongly affect the genetic variation. The highest amounts of variation generally are found in large habitats and in individual-rich populations, due to the higher number of individuals and thus the potentially greater variety of genotypes occurring at the site [13-16]. Large individuals of Acacia erioloba nurse trees also were more frequently visited by animals (including frugivores) and held more subcanopy plants than Acacia saplings in the study of Dean et al. [5]. In consequence, considerable differences can be assumed concerning population size, fruit dispersal and genetic variation of stands of subcanopy plant under canopy trees of different crown size.
Of all plant groups tested in the study of Kos and Poschlod [6] fleshy-fruited perennials showed the strongest ecological binding to subcanopy habitats since germination rates of their seeds were very low under matrix conditions. This is especially true for Pollichia campestris Aiton (Illecebraceae) where germination was completely inhibited under matrix conditions, making the species an ideal object for further researches. There are virtually no studies on questions of genetic variation in populations of savanna subcanopy plants. However, due to the combination of scattered tree canopies and subcanopy plants with frugivore-dispersed seeds, this habitat type is an interesting topic for surveys on genetic patterns and fragmented populations.
Since the sweet-fruited frugivore-dispersed Pollichia campestris is quite exclusively found in subcanopy habitats, we wanted to test the impact of the size of the nurse trees on the genetic variation of its populations. Based on the correlation between habitat size and genetic variation larger trees should harbour bigger and genetically more diverse P. campestris subpopulations (i.e., the groups of individuals under the respective trees), while effective and directed seed dispersal from one canopy to another by frugivorous animals should maintain low values of genetic variation among the subpopulations under different trees. To test this hypothesis we applied amplified fragment length polymorphisms (AFLP) to study the genetic variation in a complex of Acacia erioloba canopy trees of different size in the southern Kalahari Desert. The aim of our study was to show 1) whether there is a relationship between canopy tree size and the number of individuals of P. campestris in the respective subpopulation; 2) whether there is a relationship between canopy tree size and genetic variation within the subpopulation under the same tree; and 3) whether there is a low genetic variation among the subpopulations of individuals under the different trees.
2. MATERIALS AND METHODS
2.1. Species Description and Sample Sites
Pollichia campestris is a frugivore-dispersed, geoor hemicryptophyte herbaceous shrublet, up to 40 cm tall, with small lineal-lanceolate leaves arranged in whorls of three to four [6,17]. The axillary inflorescences are composed of few small, yellow flowers, the bracts of which become bigger and fleshy when ripe. Thus, they form the white, very sweet fruits, containing one or two seeds [17]. Pollichia campestris is widespread on sandy soils in Africa and the Arabian Peninsula and one of the most common subcanopy species in the African savannas [3].
Our study was carried out in the “Road Reserve” in the dry valley of the Nossob river in the southern Kalahari Desert (Republic of South Africa, 26˚47’57.05”S 20˚38’12.26”E). The “Road Reserve” with an area of 0.43 km2 (ca. 2000 × 250 m) was installed in 1974 due to an outbreak of foot-and-mouth disease. The area was not grazed since that time and there is a border fence between the Republic of South Africa and the Republic of Botswana.
Acacia erioloba is the only tree species occurring in the area of the “Road Reserve”. Of all A. erioloba trees, 17 individuals had Pollichia campestris growing under their canopy. For our study, we sampled all of the 95 P. campestris plants, counted the number of individuals under each of the 17 trees and measured the maximum crown diameter of the trees. As we wanted to adress only the canopy size of the trees, their spacial distribution is not considered here. All P. campestris individuals under the same tree were considered as one subpopulation.
2.2. Molecular Analysis
DNA isolation. For molecular analyses, fresh plant material was sampled from all individuals of Pollichia campestris found under the canopy of the Acacia erioloba trees. DNA was isolated from dried plant material following the CTAB (cetyltrimethyl ammonium bromide) method [18] adapted as described in former studies [19].
AFLP analysis. AFLP procedure was carried out according to the Beckman Coulter protocol with only minor modifications as described before [20,21]. Genomic DNA (~50 ng) was used for restriction and ligation reaction with MseI and EcoRI restriction enzymes and T4 DNA Ligase (all Fermentas products) conducted in a thermal cycler for 2 h at 37˚C. Following polymerase chain reactions (PCR) were run in a reaction volume of 5 μL. Preselective amplifications were performed using primer pairs with a single selective nucleotide, MseI-C and EcoRI-A, H2O, buffer S, dNTPs and Sawady Taq (PeqLab). PCR parameters were chosen as follows: 2 min at 94˚C, 30 cycles of 20 s denaturing at 94˚C, 30 s annealing at 56˚C, and 2 min extension at 72˚C, following with 2 min at 72˚C and ending with 30 min at 60 °C. Selective amplifications were performed with the three primer combinations MseI-CTG/EcoRI-AAC(D2), MseICTT/EcoRI-ACG (D3), MseI-CAG/EcoRI-ACA (D4) and H2O, buffer S, dNTPs and Sawady Taq (PeqLab). PCRs were performed with the following touchdown profile: 2 min at 94˚C, 10 cycles of 20 s denaturing at 94˚C, 30 s annealing which was initiated at 66˚C and then reduced by 1˚C for the next 10 cycles, 2 min elongation at 72˚C, followed by 25 cycles for 20 s denaturing at 94˚C, 30 s annealing at 56˚C and 2 min elongation at 72˚C, ending with a final extension for 30 min at 60˚C. After DNA precipitation, DNA pellets were vacuumdried and dissolved with a mixture of Sample Loading Solution (SLS) and CEQ Size Standard 400 (both Beckman Coulter). The fluorescence-labelled selective amplification products were separated by capillary gel electrophoresis on an automated sequencer (CEQ 8000, Beckman Coulter). Raw data were collected and analyzed with the CEQ Size Standard 400 using the CEQ 8000 software (Beckman Coulter). Data were exported as crv-files, showing synthetic gels with AFLP fragments for each primer combination separately from all studied individuals and analyzed in bionumerics 3.0 (Applied Maths). Files were examined for strong, clearly defined bands. Each band was scored across all individuals as either present or absent.
AFLP statistics. The binomial matrix was used to analyse genetic variation within the individuals under a tree calculated as the percentage of polymorphic bands (PB) and Nei’s gene diversity [HE = 1 – sum(pi2)] [22], using the program POPGENE version 1.32 [23]. Genetic differentiation among the individuals under different trees was studied in an analysis of molecular variance (AMOVA) [24] by the program GENALEX version 5 [25]. The impact of the number of individuals on genetic variation was tested by a correlation analysis (Spearman’s rank correlation coefficient) in SPSS for Windows 12.0.
3. RESULTS
With a total of 95 Pollichia campestris individuals, the three primer combinations applied generated 92 fragments, 84 (77.28%) of which were polymorphic. No identical genotypes were detected. The percentage of polymorphic bands in the subpopulations varied between 17.39% and 68.48%, and genetic variation ranged from 0.06 to 0.3 (Table 1). AMOVA analysis showed that 97% of the molecular variance are located within the Pollichia campestris subpopulations and 3% among the subpopulations (ΦPT = 0.026, P = 0.18). The values of the AMOVA sums of squares (corrected for the number of individuals) in the subpopulations ranged from 5.17 to 11.50 (table 1). The number of individuals per tree was strongly correlated with the percentage of polymorphic bands (Spearman correlation coefficient r = 0.742, P = 0,001, N = 17) and Nei’s gene diversity (r = 0.758, P = 0.000, N = 17), but not with the AMOVA sums of squares (r = 0.283, P = 0.271, N = 17). There was no correlation between the number of individuals per tree and the size of the canopy trees (r = 0.380, P = 0.133, N = 17), but tree size was correlated with Nei’s gene diversity (r = 0.567, P = 0.018, N = 17), the percentage of polymorphic bands (r = 0.544, P = 0.024, N = 17) and the AMOVA sums of squares (corrected for the number of individuals; r = 0.524, P = 0.031, N = 17) (figure 1).
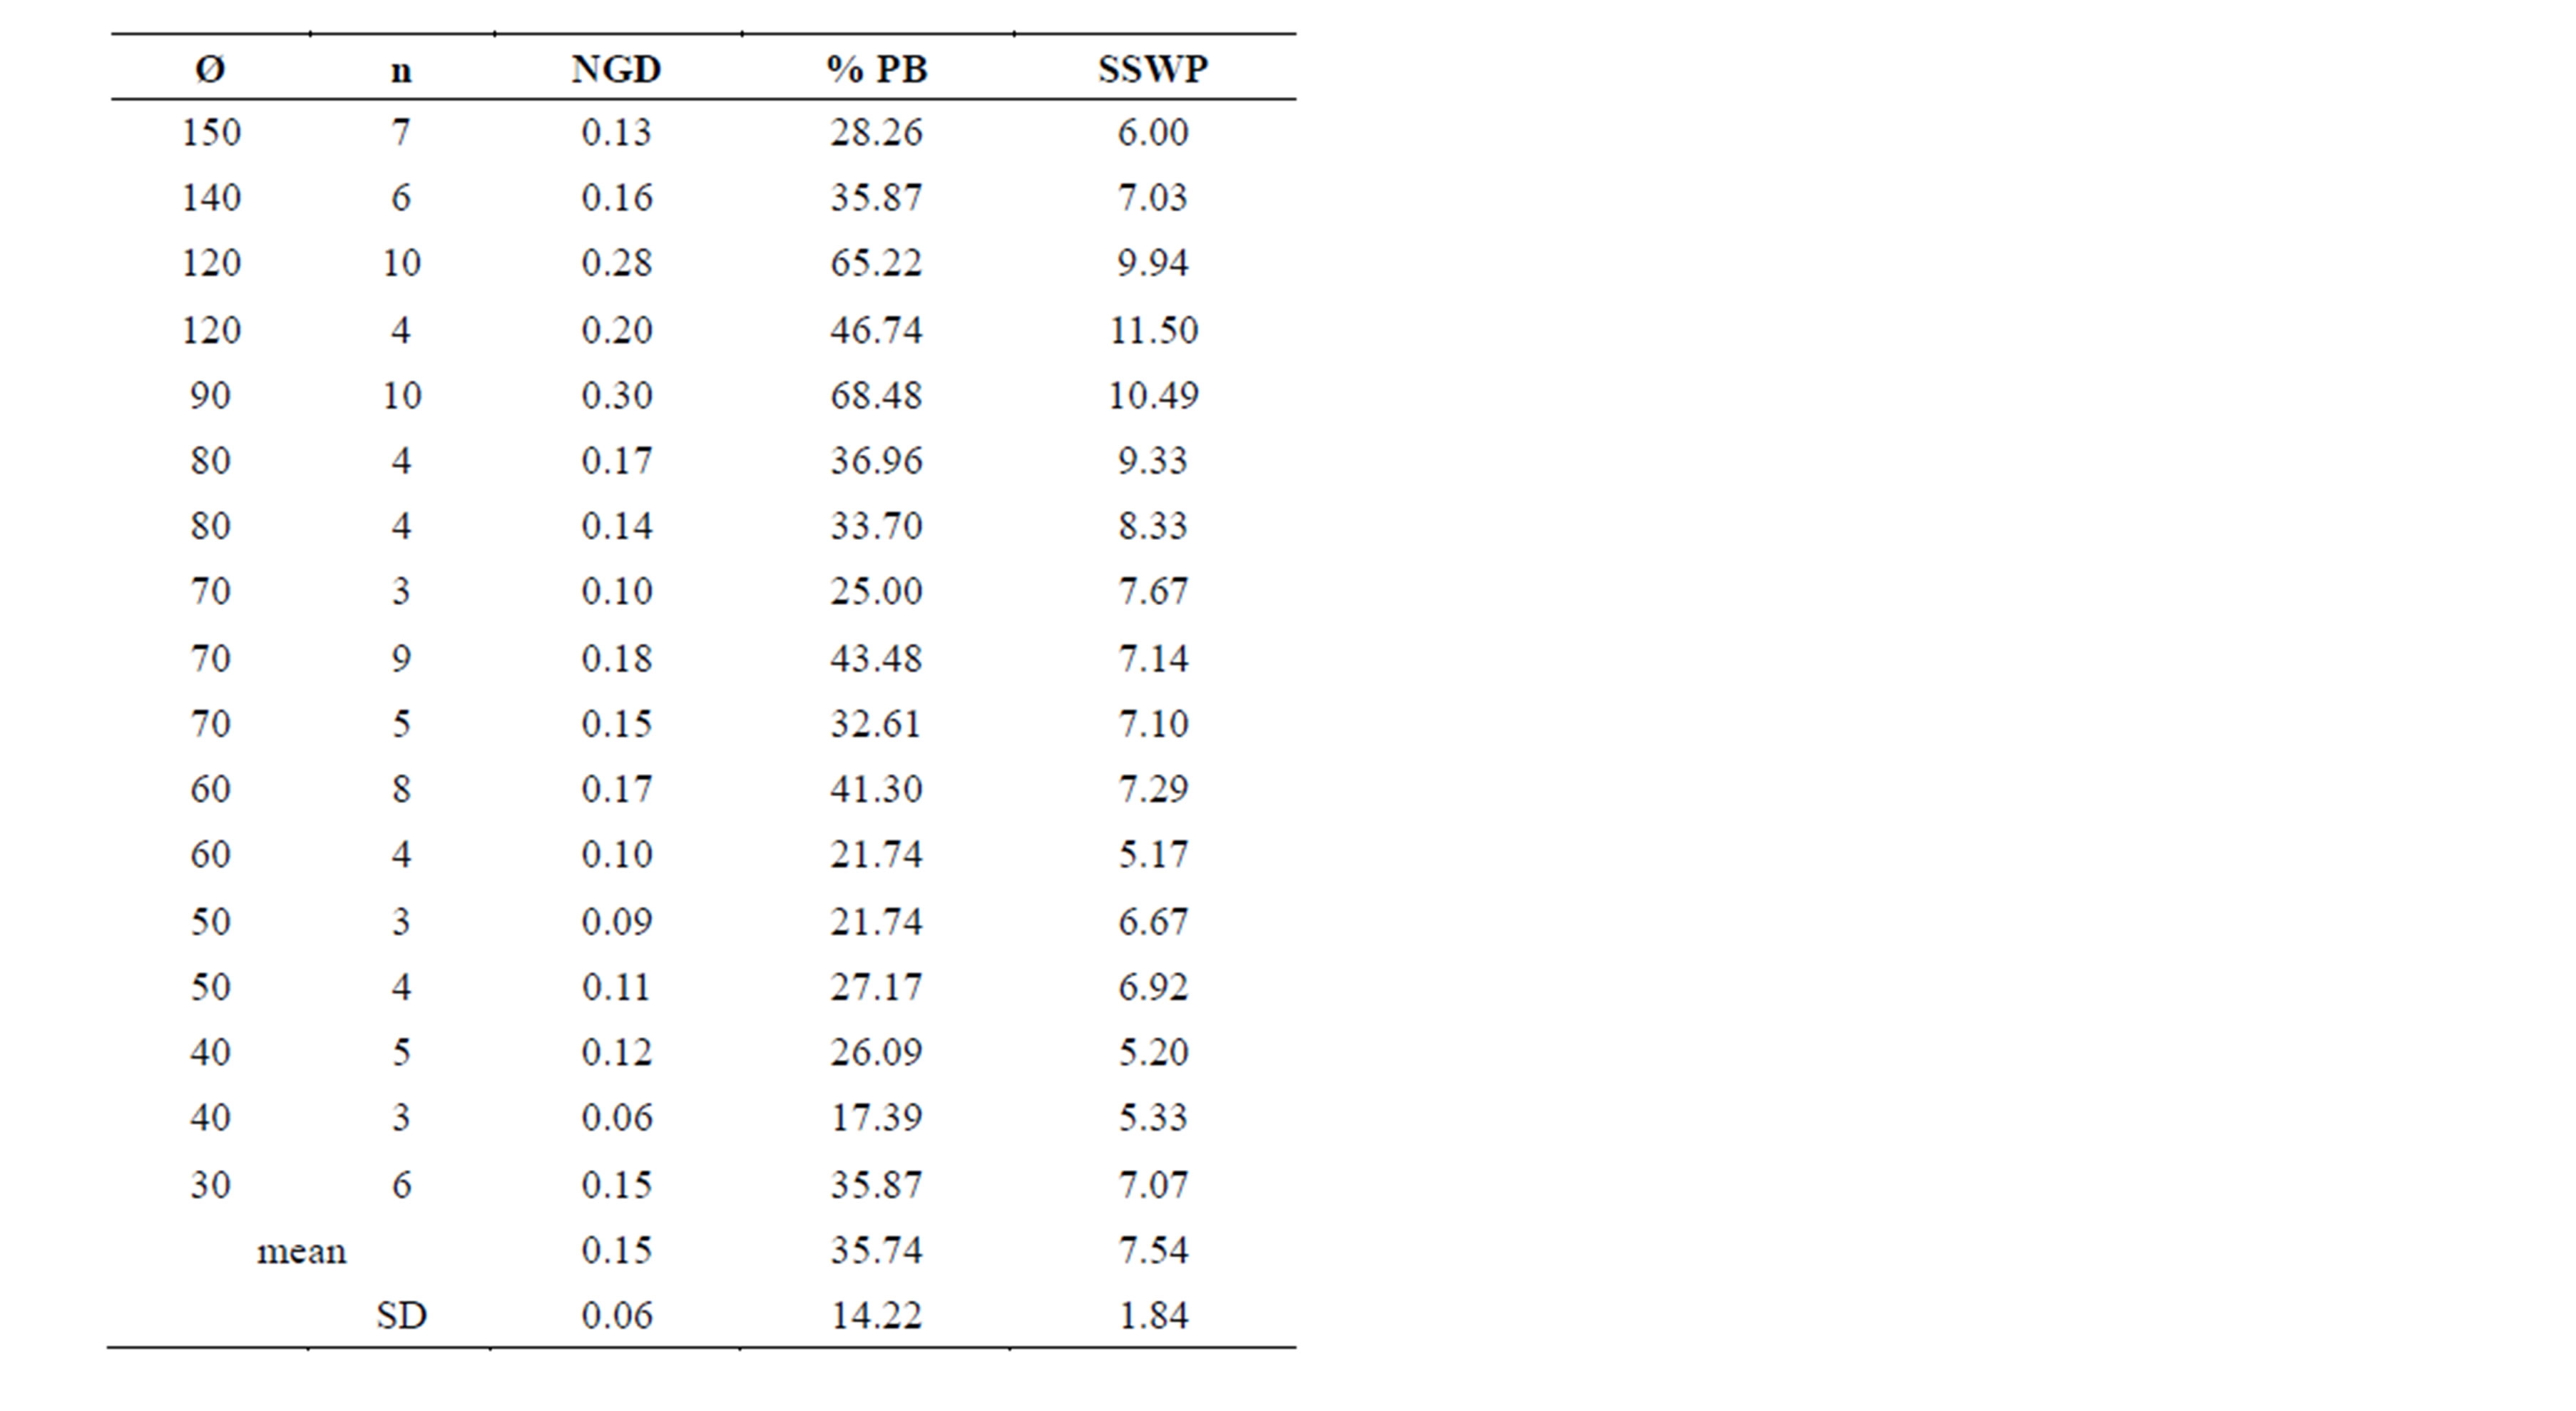
Table 1. Ø, crown diameters [cm] of the Acacia erioloba canopy trees; n, number of Pollichia campestris individuals in the group under the respective tree; NGD, Nei´s gene diversity; % PB, percentage of polymorphic bands; SSWP, AMOVA sums of squares (as SSWP/n–1, corrected for the number of individuals).
4. DISCUSSION
Crown size of the Acacia erioloba nurse trees had no influence on the number of individuals of Pollichia campestris under their canopy. However, it was significantly correlated with the genetic variation within the subpopulations (figure 1). With the canopies considered as islands in the savanna vegetation, older trees (larger canopies) harbour more variable subpopulations, in accordance with Frankham [14]. This parallels the results of other studies [16,26] that detected correlations between forest age and the genetic variation of the forest plants Dryopteris dilatata and Trillium grandiflorum, respectively, explained by founder effects in young and accumulation of genetic variation in old habitats. Founder and accumulation effects very likely also explain the levels of genetic variation in our study. The mean level of genetic variation in the subpopulations was lower than the values given by Nybom and Bartish [27] for longlived and widespread plant species with ingested seeds, probably due to the low number of individuals per tree. In contrast, these low numbers had no influence on the correlation between genetic variation and the number of individuals. This correlation is consistent with the results of the meta-analysis of Leimu et al. [15], who found the positive relationship between genetic variation and population size to be a common pattern in population biolo-
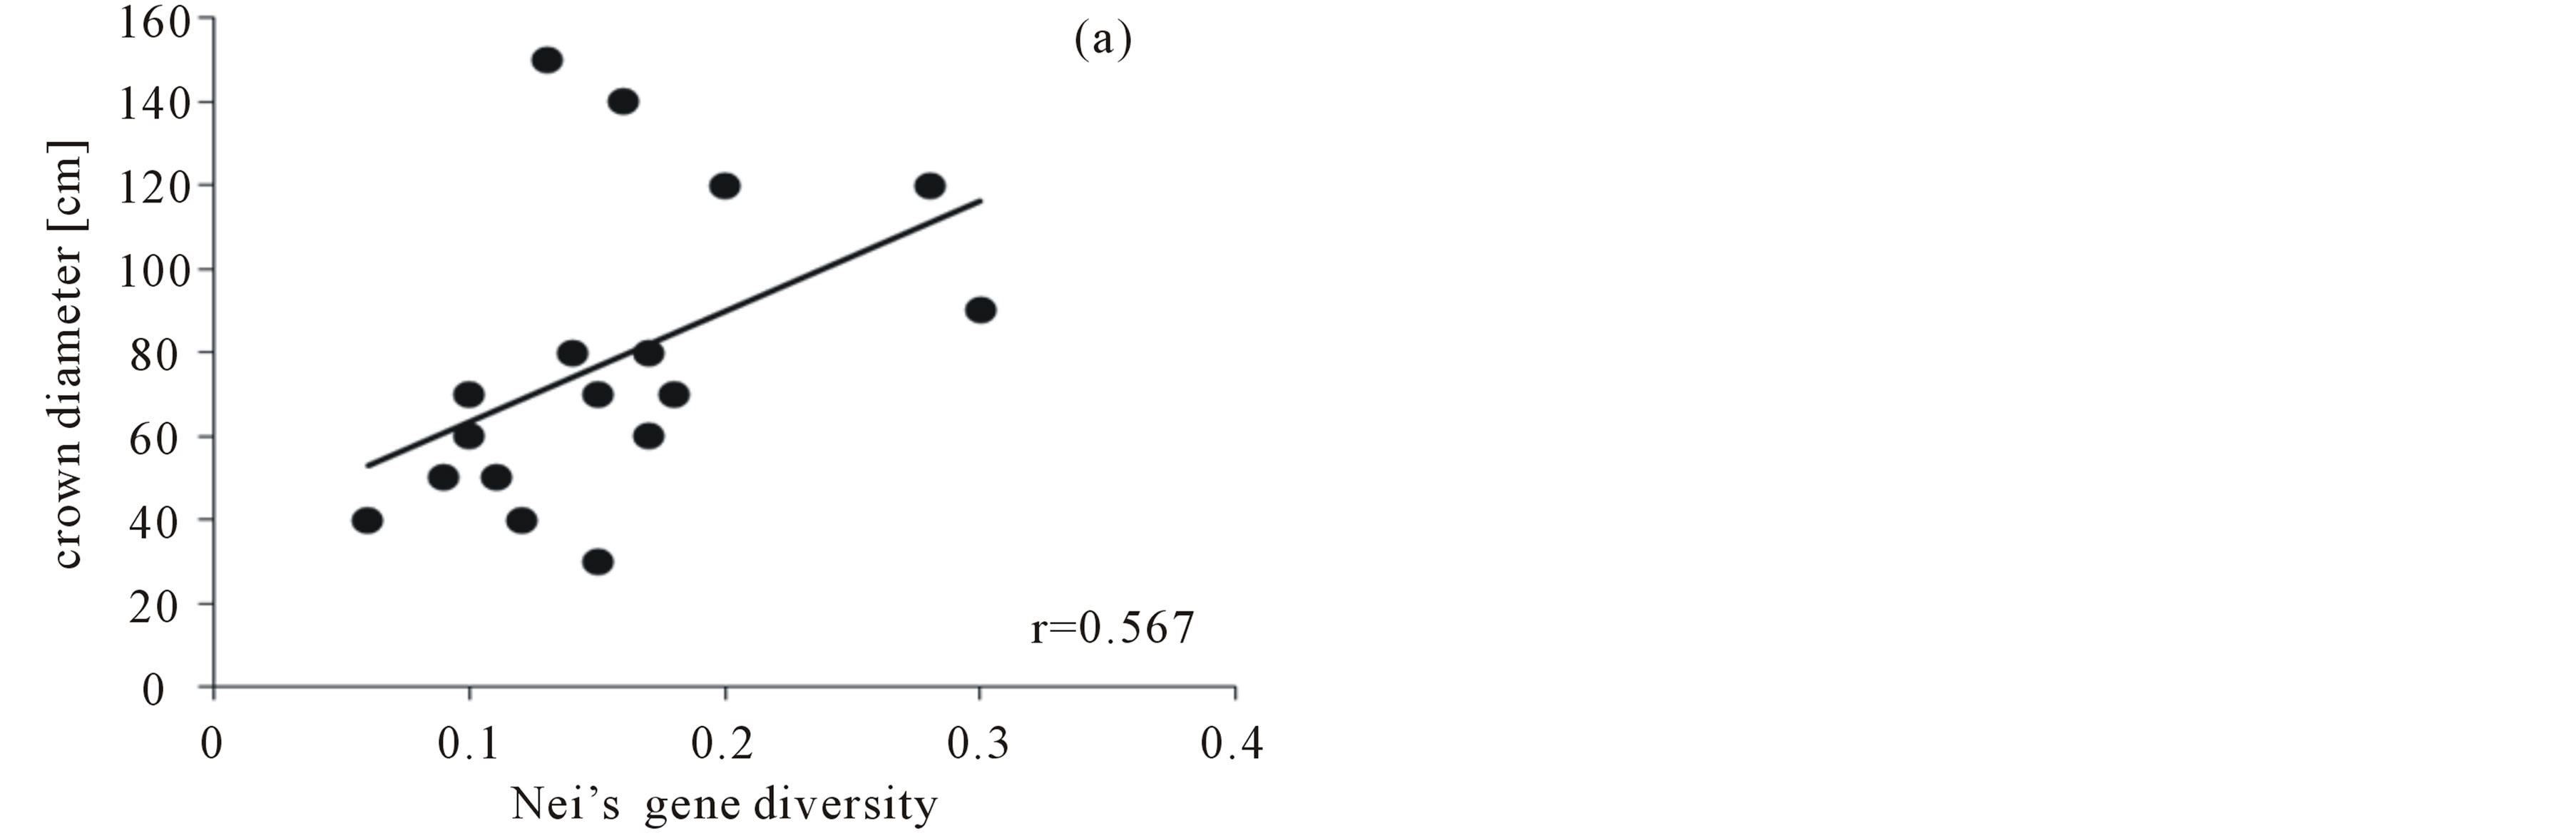
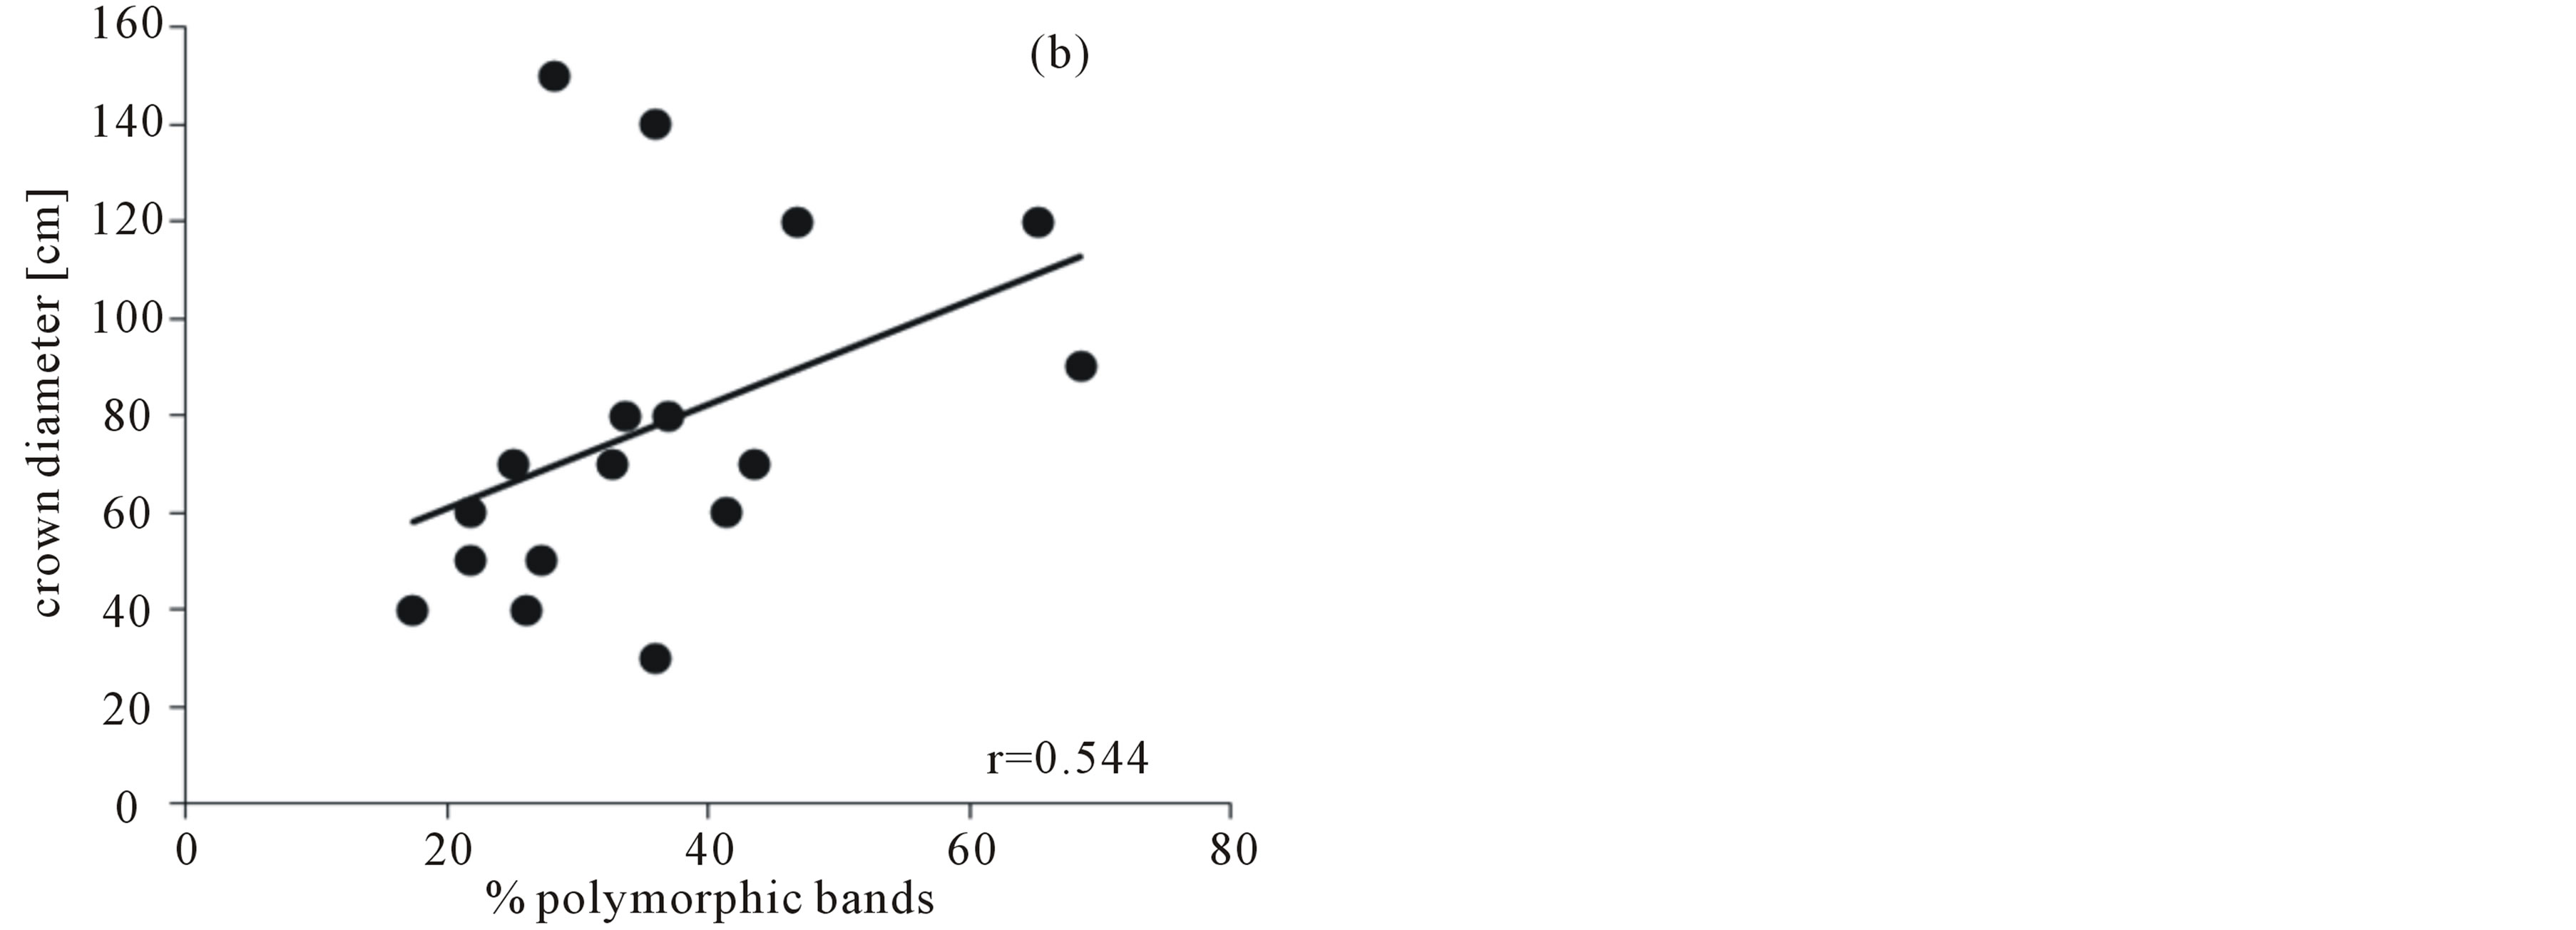
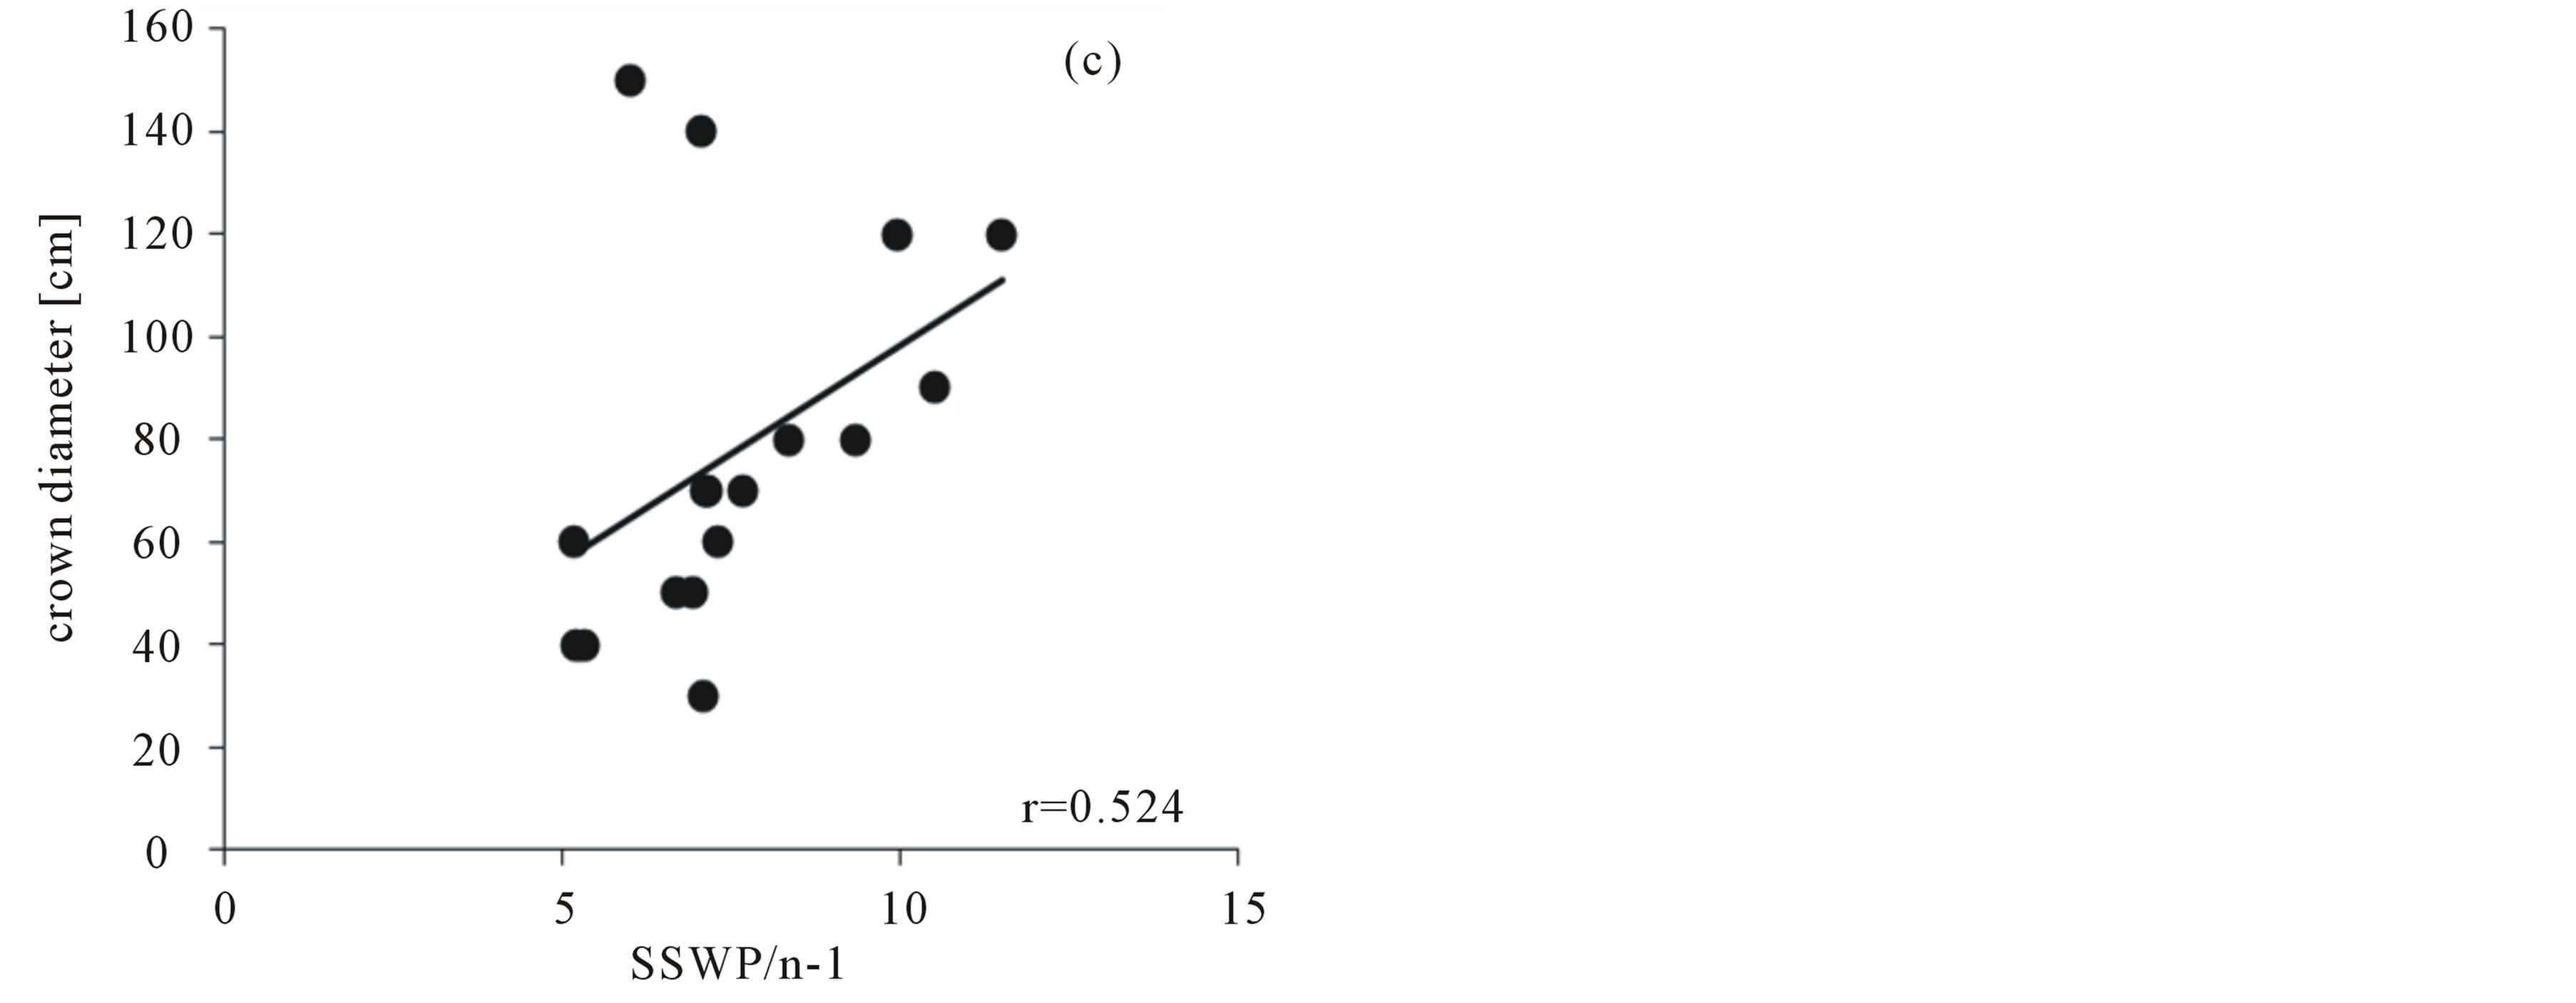
Figure 1. Correlation of the crown diameter of the canopy trees with (a) Nei´s gene diversity, (b) the percentage of polymorphic bands, (c) the AMOVA sums of squares (as SSWP/n-1, corrected for the number of individuals) of Pollichia campestris under the respective tree.
gy. As there are virtually no other studies dealing with the genetic variation of frugivore-dispersed subcanopy plants the values found for Pollichia campestris in our study site cannot be compared to the values found by others.
It seems to be contradicting that canopy tree size was correlated with the genetic variation in the P. campestris subpopulation under the respective tree, but not with the number of individuals in this subpopulation. As there were only 3 to 10 individuals of P. campestris per tree, the size of the single individuals and interspecific competition with other subcanopy species may have an undue effect, compared to larger populations. Interspecific competition may be intensified under larger trees, since P. campestris is a pioneer subcanopy species [10]. Additionally, there could be some influence by the small island effect [28]. Scattered trees are important keystone structures, providing resting and food sites for animals as well as sheltered and nutrient-enriched habitats for plants and thus patterning and diversifying landscapes [4,5,9, 29,30]. Larger trees are more attractive for animals than smaller ones [5]. This might possibly affect the subcanopy vegetation by treading, grazing, etc. especially under larger trees. Canopy shape may affect the subcanopy vegetation as well, with irregularly grown or gapped crowns yielding less suitable conditions for subcanopy plants than denser canopies, while having the same diameter.
Within the P. campestris subpopulations considerable genetic variation was detected, while variation among subpopulations was very weak. Besides the proximity of the trees, this indicates an effective short-range seed dispersal, as Nybom and Bartish [27] also found the lowest ΦST-values in species with ingested or wind-dispersed seeds. Dispersal distances greater than 30 m provided the best population models for Grewia flava, a fleshy-fruited savanna species dispersed by mammals and birds, with birds being the most effective vector for reaching Acacia canopies [9]. Seed dispersal by birds was shown to be confined to rather short distances, but extended at least up to 30 or 60 m in most cases [31-33], also including rare long-distance dispersal [33]. Thus, seeds dispersed by birds usually remain within local tree complexes and, what is most important, get placed under a canopy [5,9]. Other vectors like carnivorous mammals are more likely to disperse seeds into the matrix vegetation [9], where conditions are less favourable for subcanopy species [6, 10].
5. CONCLUSION
With the results presented above, the three questions of our study can be answered as follows: 1) crown size of the nurse trees was not correlated with the number of individuals of Pollichia campestris growing under their canopy, 2) but strongly correlated with the genetic variation within the individuals under the same tree, 3) while genetic variation among the groups of individuals under different trees was much lower than the genetic variation within the individuals under the same tree. In summary, the directed seed dispersal from one canopy to another by legitimate and frugivorous dispersal agents seems to be very efficient, leading to stands of P. campestris with a similarly high genetic variation under each nurse tree. This dispersal type therefore is very important for subcanopy plants, as it generates and maintains genetically diverse populations. The canopy trees themselves also are important keystone structures in the savanna environment, providing a quite rare habitat type for specialised animals and plants.
ACKNOWLEDGEMENTS
We thank Anne Horn and Gregor Pachmann for collecting the plant material and Petra Schitko for extensive assistance in the lab. This work was supported by the German Research Foundation (DFG) within the funding programme Open Access Publishing.
REFERENCES
- Scholes, R.J. and Archer, S.R. (1997) Tree-grass interactions in savannas. Annual Review of Ecology, Evolution, and Systematics, 28, 517-544. http://dx.doi.org/10.1146/annurev.ecolsys.28.1.517
- Vetaas, O.R. (1992) Micro-site effects of trees and shrubs in dry savannas. Journal of Vegetation Science, 3, 337- 344. http://dx.doi.org/10.2307/3235758
- Leistner, O.A. (1996) The subcanopy flora in the dynamics of the Kalahari Thornveld. In: van der Maesen, L.J.G., van der Burgt, X.M. and van Medenbach de Rooy, J.M., Eds., The Biodiversity of African Plants (Proceedings XIVth AEFTAT Congress), Kluwer Academic Publishers, Dordrecht, 163-179.
- Milton, S.J. and Dean, W.R.J. (1999) How useful is the keystone species concept, and can it be applied to Acacia erioloba in the Kalahari Desert? Zeitschrift für Ökologie und Naturschutz, 3, 147-156.
- Dean, W.R.J., Milton, S.J. and Jeltsch, F. (1999) Large trees, fertile islands, and birds in arid savanna. Journal of Arid Environment, 41, 61-78. http://dx.doi.org/10.1006/jare.1998.0455
- Kos, M. and Poschlod, P. (2007) Seeds use temperature cues to ensure germination under nurse-plant shade in xeric Kalahari. Annals of Botany, 99, 667-675. http://dx.doi.org/10.1093/aob/mcl293
- Wesuls, D., Strohbach, M., Horn, A., Kos, M., Zimmermann, J., Hoffmann, J., Geldenhuys, C., Dreber, N., Kellermann, L., van Rooyen, G. and Poschlod, P. (2010) Plant functional traits and types as a tool to analyse landuse impacts on vegetation. In: Schmiedel, U. and Jürgens, N., Eds., Biodiversity in Southern Africa, Volume 2: Patterns and Processes at Regional Scale, Klaus Hess Publishers, Göttingen and Windhoek, 222-232.
- Facelli, J.M. and Brock, D.J. (2000) Patch dynamics in arid lands: Localized effects of Acacia papyrocarpa on soils and vegetation of open woodlands of South Australia. Ecography, 23, 479-491. http://dx.doi.org/10.1111/j.1600-0587.2000.tb00304.x
- Tews, J., Moloney, T. and Jeltsch, F. (2004) Modeling seed dispersal in a variable environment: A case study of the fleshy-fruited savanna shrub Grewia flava. Ecological Modelling, 175, 65-76. http://dx.doi.org/10.1016/j.ecolmodel.2003.10.008
- Kos, M. (2007) Vegetation patterns in the Kalahari affected by Acacia erioloba: The importance of the regeneration niche. Ph.D. Thesis, University of Regensburg, Regensburg.
- Gautier-Hion, A., Duplantier, J.-M., Quris, R., Feer, F., Sourd, C., Decoux, J.-P., Dubost, G., Emmons, L., Erard, C., Hecketsweiler, P., Moungazi, A., Roussilhon, C. and Thiollay, J.-M. (1985) Fruit characters as a basis of fruit choice and seed dispersal in a tropical forest vertebrate community. Oecologia, 65, 324-337. http://dx.doi.org/10.1007/BF00378906
- Gosper, C.R., Stansbury, C.D. and Vivian-Smith, G. (2005) Seed dispersal of fleshy-fruited invasive plants by birds: contributing factors and management options. Diversity and Distributions, 11, 549-558. http://dx.doi.org/10.1111/j.1366-9516.2005.00195.x
- Ellstrand, N.C. and Elam, D.R. (1993) Population genetic consequences of small population size: Implications for plant conservation. Annual Review of Ecology, Evolution, and Systematics, 24, 217-242. http://dx.doi.org/10.1146/annurev.es.24.110193.001245
- Frankham, R. (1996) Relationship of genetic variation to population size in wildlife. Conservation Biology, 10, 1500-1508. http://dx.doi.org/10.1046/j.1523-1739.1996.10061500.x
- Leimu, R., Mutikainen, P., Koricheva, J. and Fischer, M. (2006) How general are positive relationships between plant population size, fitness and genetic variation? Journal of Ecology, 94, 942-952. http://dx.doi.org/10.1111/j.1365-2745.2006.01150.x
- Reisch, C., Mayer, F., Rüther, C. and Nelle, O. (2008) Forest history affects genetic diversity—Molecular variation of Dryopteris dilatata (Dryopteridaceae) in ancient and recent forests. Nordic Journal of Botany, 25, 366-371. http://dx.doi.org/10.1111/j.0107-055X.2008.00188.x
- Van Rooyen, N. (2001) Flowering plants of the Kalahari dunes. Ekotrust, Thatchers Field, Pretoria.
- Rogers, S.O. and Bendlich, A.J. (1994) Extraction of total cellular DNA from plants, algae and fungi. In: Gelvin, S.B. and Schilperoort, R.A., Eds., Plant Molecular Biology Manual, 2nd Edition, Kluwer Academic Publishers, Dordrecht, 1-8. http://dx.doi.org/10.1007/978-94-011-0511-8_12
- Reisch, C., Anke, A. and Röhl, M. (2005) Molecular variation within and between ten populations of Primula farinosa (Primulaceae) along an altitudinal gradient in the northern Alps. Basic and Applied Ecology, 6, 35-45. http://dx.doi.org/10.1016/j.baae.2004.09.004
- Reisch, C. (2007) Genetic structure of Saxifraga tridactylites (Saxifragaceae) from natural and man-made habitats. Conservation Genetics, 8, 893-902. http://dx.doi.org/10.1007/s10592-006-9244-4
- Bylebyl, K., Poschlod, P. and Reisch, C. (2008) Genetic variation of Eryngium campestre L. (Apiaceae) in Central Europe. Molecular Ecology, 17, 3379-3388. http://dx.doi.org/10.1111/j.1365-294X.2008.03836.x
- Nei, M. (1978) Estimation of average heterozygosity and genetic distance from a small number of individuals. Genetics, 89, 583-590.
- Yeh, F.C., Yang, R.C., Boyles, B.J., Ye, Z.H. and Mao, J.X. (1997) POPGENE, the user-friendly shareware for population genetic analysis. Molecular Biology and Biotechnology Centre, Alberta.
- Excoffier, L., Smouse, P.E. and Quattro, J.M. (1992) Analysis of molecular variance inferred from metric distances among DNA haplotypes: Application to human mitochondrial DNA restriction data. Genetics, 131, 479-491.
- Peakall, R. and Smouse, P.E. (2001) GenAlEx: Genetic Analysis in Excel. 5th Edition, Australian National University, Canberra.
- Vellend, M. (2004) Parallel effects of land-use history on species diversity and genetic diversity of forest herbs. Ecology, 85, 3043-3055. http://dx.doi.org/10.1890/04-0435
- Nybom, H. and Bartish, I.V. (2000) Effects of life history traits and sampling strategies on genetic diversity estimates obtained with RAPD markers in plants. Perspectives in Plant Ecology, Evolution and Systematics, 3, 93- 114. http://dx.doi.org/10.1078/1433-8319-00006
- Lomolino, V.M. and Weiser, M.D. (2001) Towards a more general species-area relationship: Diversity on all islands, great and small. Journal of Biogeography, 28, 431-445. http://dx.doi.org/10.1046/j.1365-2699.2001.00550.x
- Belsky, A.J. and Canham, C.D. (1994) Forest gaps and isolated forest trees. BioScience, 44, 77-84. http://dx.doi.org/10.2307/1312205
- Manning, A.D., Fischer, J. and Lindenmayer, D.B. (2006) Scattered trees are keystone structures—Implications for conservation. Biological Conservation, 132, 311-321. http://dx.doi.org/10.1016/j.biocon.2006.04.023
- Schupp, E.W. (1993) Quantity, quality and the effectiveness of seed dispersal by animals. Vegetatio, 107-108, 15- 29. http://dx.doi.org/10.1890/04-1325
- Bonn, S. and Poschlod, P. (1998) Ausbreitungsbiologie der Pflanzen Mitteleuropas. Quelle & Meyer, Wiesbaden.
- Clarke, C.J., Poulsen, J.R., Bolker, B.M., Connor, E.F. and Parker, V.T. (2005) Comparative seed shadows of bird-, monkeyand wind-dispersed trees. Ecology, 86, 2684-2694. http://dx.doi.org/10.1890/04-1325
NOTES
*Corresponding author.