Open Journal of Ecology
Vol.3 No.4(2013), Article ID:35043,13 pages DOI:10.4236/oje.2013.34036
Retrospective analysis of two Northern California wild-land fires via Landsat five satellite imagery and Normalized Difference Vegetation Index (NDVI)
![]()
1Department of Biological Sciences, California State University, Chico, USA
2Department of Ecology and Evolutionary Biology, University of California, Santa Cruz, USA; *Corresponding Author: mwjenkin@ucsc.edu
3Institute for Sustainable Development, California State University, Chico, USA
Copyright © 2013 Bennett Sall et al. This is an open access article distributed under the Creative Commons Attribution License, which permits unrestricted use, distribution, and reproduction in any medium, provided the original work is properly cited.
Received 8 April 2013; revised 19 May 2013; accepted 30 June 2013
Keywords: Wild-Land Fire; Burn Severity; Vegetation Recovery; Normalized Difference Vegetative Index (NDVI); Normalized Burn Ratio (NBR)
ABSTRACT
Wild-land fires are a dynamic and destructive force in natural ecosystems. In recent decades, fire disturbances have increased concerns and awareness over significant economic loss and landscape change. The focus of this research was to study two northern California wild-land fires: Butte Humboldt Complex and Butte Lightning Complex of 2008 and assessment of vegetation recovery after the fires via ground based measurements and utilization of Landsat 5 imagery and analysis software to assess landscape change. Multi-temporal and burn severity dynamics and assessment through satellite imagery were used to visually ascertain levels of landscape change, under two temporal scales. Visual interpretation indicated noticeable levels of landscape change and relevant insight into the magnitude and impact of both wild-land fires. Normalized Burn Ratio (NBR) and delta NBR ((NBR) data allowed for quantitative analysis of burn severity levels. (NBR results indicate low severity and low re-growth for Butte Humboldt Complex “burned center” subplots. In contrast, (NBR values for Butte Lightning Complex “burned center” subplots indicated low-moderate burn severity levels.
1. INTRODUCTION
In June 2008, two wild-land fires consumed large areas in rural Butte County, California, USA. On June 11, the Butte Humboldt Complex (BHC) fire broke out and spread rapidly to over 23,344 acres causing the destruction of 87 homes, ten injuries, and 20.5 million dollars in damages [1]. On June 21, the Butte Lightning Complex (BLC) ignited and quickly spread to over 59,440 acres, causing the destruction of 106 homes, 71 injuries, and 85.3 million dollars in damages [1]. Fire regime measurements of severity, frequency and vegetation recovery, are all directly related to fire impact, in both environmental and economic terms. These are complex and dynamic systems with factors including but not limited to climate, local weather, fuel loading and encompass scales from regional to global [2-4]. However, complicated fire regimes are to study and quantify there does seem to be one universal and coherent view; fires are and will continue to become more severe and frequent under future global climate projections [2-7].
Ground based vegetation reflectance measurements and associated reflectance indices have been effective in looking at several noteworthy vegetation reflectance trends residing in the blue and red spectral regions. The blue and red spectral regions typically denote increased absorbance, due to photosynthetic activities, and more specifically absorption by vegetation pigments [8]. Reflectance in the infrared spectral region can also be used to determine water content detection in canopies [9]. Quick and reliable measurements of plant water concentration via ground based indices can lead to important information for irrigation practices, drought assessment of natural communities, and the definition of wildfire risk [10-12].
The Normalized Difference Vegetation Index (NDVI) is well established and utilized by researchers around the globe, with a multitude of ecological applications including preand post-wild-land fire assessments, multi-time series landscape change analysis, and landscape dynamics and drought influences on wild-land fires [13,14]. NDVI has the ability to accurately utilize specific band regions of the wavelength spectrum involved with vegetation physiological characteristics [15]. More centrally, relying on links between increased absorption in the red visible region and higher chlorophyll content [16], as well as increased absorption in the near infrared region. NDVI illustrates a decreased ability of vegetation to reflect heat, denoting vegetation stress [17]. NDVI has been shown to have vegetation values spanning above zero to one [15], and can be broadly viewed with the equation (Near infrared-Red visible region/Near infrared + Red visible region) [18], with red visible region ranging from 0.63 to 0.69 µm and near infrared region ranging from 0.75 to 0.80 µm [18]. NDVI has been shown to be effective in shrub-land communities for detection of vegetation responses related to drought influences as well as monitoring vegetation development [13].
Technological advancements in recent decades in high resolution spectral imaging sensors and analysis software have permitted remote sensing to emerge as a valuable tool to comprehend, measure, and investigate a variety of different environments in a biological, physical, and chemical nature with high levels of accuracy and have been instrumental in gaining a better understanding of trends involved with vegetation physiology and plant stress [19-22]. This approach may provide a better alternative to traditional field methods because it is less costly and destructive allowing for results to be obtained in a timelier manner for analysis [20,23,24].
Research has also revealed by way of satellite derived indices, utilization of the near IR and mid infrared regions and more specifically, water absorption bands ranging from 0.950 to 0.970 µm, 1.150 to 1.260 µm, and 1.520 to 1.540 µm, to be highly effective in assessment of water content in canopies in relation to visible and near infrared regions [9]. These wavelengths are able to be absorbed further into the canopy structure, providing a larger more accurate representation of water content in comparison to the visible region, due to increased reflectance [9].
Entire areas affected by the Butte Humboldt and Lightning Complexes were examined via satellite remote sensing Landsat 5 imagery and ENVI 4.8 analysis software [25,26]. In an effort to gain a unique qualitative sense of magnitude and impact of these fires on vegetation and associated landscape change, as well as to properly designate unburned, burned edge, burned center, and reference subplot locations.
Burn severity can be described as the amount of change inflicted by fire disturbance on a particular area [27]. Fire disturbance has been shown to affect vegetation in numerous ways including the decreased water content and health, changes in soil properties, density, species types, and arrangements [28]. In the near infrared and mid infrared regions of wavelength spectrum, changes linked to wild-land fire can be observed using Landsat Enhanced Thematic Mapper Plus (ETM+) and previous counterpart Landsat Thematic Mapper (TM) [28]. In post-wild-land fire landscapes, reflectance in the near infrared region and more specifically band 4, has been shown to be lower, while in contrast, mid infrared regions associated with band 7, has been shown to have the largest reflectance escalations [31]. DNBR results from subtraction of preand post-wild-land fire NBR values, then multiplied by a 1000 [29,30], with known values spanning from −1 to 1 [32]. Positive DNBR values indicate decreased amounts of vegetation with negative NBR values indicating increased vegetation growth between image acquisition dates [32].
Collection of pre-, post-NBR, and DNBR data from original BHC and BLC subplots allowed for quantitative and applicable assessment of burn severity levels [31]. Low fire severity for savannah grassland type ecosystems have been reported, with observed fire behavior to be rapidly sweeping in nature, however, differences still exist among severity levels between savannah and chaparral communities, both of which encompass BHC affected areas [33]. Nevertheless, low burn severity levels are expected for BHC, with increasing burn severity levels expected for BLC.
Based on the close proximity between BHC and BLC, both surrounding landscapes share similar vegetation types and compositions [34]. However, BHC encompasses lower elevation with savannah type grasslands and a mosaic of sparsely spatially oriented large oaks (P. santrons), foothill pine (Pinus sabiniana), and California Buckeye (Aesculus californica) [34]. An understory of herbaceous shrubs and herbs are present and include Christmas berry (Heteromeles arbutifolia), California coffeeberry (Rhamnus californica), fescue bunchgrasses (F. occidentalis, Festuca californica), and hedge nettle (Stachys rigida) [34]. As elevation increases, the landscape transitions into chaparral type vegetation that include Manzanita (Arctostaphylos sp.), Scrub oak (Quercus dumosa), and chamise (Adenostoma fasciculatum) [34]. In contrast, areas affected by the BLC were at an overall higher elevation and located in the Sierra Nevada Mountain Range in Plumas National Forest [34]. This mixed conifer forest has dense softwood vegetation that include Jeffrey pine (Pinus jeffreyi), Ponderosa pine (Pinus ponderosa), and Incense cedar (Calocedrus decurrens) along with an understory of shrubs consisting of Greenleaf Manzanita (Arctostaphylos patula), Squaw Carpet (Ceanothus prostratus), and Rabittbush Goldenweed (Haplopappus bloomeri) [34].
In an effort to quantify wildfire vegetation recovery and visually interpret landscape change, ground based reflectance indices, remote sensing techniques including multi-temporal imagery, NDVI grey-scale imagery, and burn severity indices were incorporated into this study to gain a more diverse perspective of preand post-wildland fire landscapes.
2. MATERIALS AND METHODS
2.1. Ground Based Remote Sensing
With the use of original satellite subplot coordinates, a total of thirty subplots were identified using a hand held GPS unit [35], on April 19, 21, and 23, 2010. A total of ten individual reflectance scans per subplot were collected using a Unispec SC portable spectrometer [36]. The objective of this field sampling process was to stay within the 30 by 30 meter barriers, while also striving for an even and broad distribution of individual scan locations within each subplot, in an effort to gain a uniform composite of the landscape. At each subplot locations reflectance measurements were taken at a distance of approximately one meter from the ground, with the optic sensor held slightly offset and angularly away, in a vertical out-stretched arm, while standing to insure the least possible interference due to human appendages, such as feet, and also to gain fair representation vegetation diversity. At this height, the Unispec SC portable spectrometer scans the landscape in a helical cone shape becoming larger as height is increased, with a measured circular pattern of 2 m2 [36]. Each individual scan provided an individual complete spectral signature ranging from 310 to 1100 nm, in 10nm increments [36]. Following field spectrometer instructions and protocol, a white reflectance board was used to minimize differences in light versus cloudy conditions between scan which enabled calibration by means of reference [36,37]. Applying dark scans prior to data collection to achieve increased accuracy reduced device noise. Reflectance values for each wavelength increment across the spectrum were calculated for each subplot by dividing the subplot data by reference white board data, with averages for each subplot used to derive NDVI values [36].
2.2. Satellite Remote Sensing Imagery
In an effort to visually determine varying levels of landscape change, magnitude and direction of affected areas, multi-temporal false color RGB images were constructed using Landsat 5 images, WRS path 44 row 32 and ENVI 4.8 computer software [25,26]. Two time comparisons featuring seven-year pre wild-land fire and one year preand post-wild-land fire were selected for both Butte Humboldt and Lightning Complexes. Starting with the longer time period of seven year pre wild-land fire, multi-temporal false color images for both complexes were constructed by shifting the red monitor pixels to become the most recent entire Landsat 5 image taken on 04/02/2008, then shifting both green and blue monitor pixels further back in time to the entire Landsat 5 image taken on 04/28/2000 [25,26]. Next, the same methods were repeated for one-year preand post-wildland fires with Landsat 5 images taken on 04/05/2009 and 04/02/2008, respectively. Burned center two subplot coordinates for each complex were selected to give an overall uniform orientation of images for visual analysis. A zoom magnification factor of two was utilized, with an estimated coverage distance of over twenty miles between vertical and horizontal borders.
Selection of subplot locations involved the use of post-fire images for both Butte Humboldt and Lightning Complexes. Based on the observable burn scars, subplot locations were determined. Each subplot was given labels that correspond to its location in relation to the fire disturbances. For both Complexes, three subplots were designated as burned center, three subplots were designnated as unburned, three subplots were designated as burned-edge, and one subplot was designated as reference, totaling ten subplots per fire.
Time-based data imagery was acquired by downloading eighty-five available Landsat 5 images for spring and summer months dating back twelve years from USGS Landsat data archives WRS path 44, Row 32 [25]. Spectral analysis was performed using ENVI 4.8 computer software for each of the 30 total designated subplots, with NDVI values recorded for the months of April, May, June, July, and August, starting with April 2010 and spanning back 12 years to April 1998. April thru August months were selected for the NDVI temporal based data analysis in an effort to minimize phenological vegetation differences occurring throughout yearly summer-winter vegetation cycles, as well as achieving the optimal time frame for studying Butte Humboldt and Lightning Complexes preand post-wild-land fire vegetation responses and recovery.
The time intervals associated with these wild-land fires made for ideal spectral measurement properties associated with peak vegetation growth. Other benefits included reduced cloud cover and rainfall amounts in relation to winter months and ideal crowning vegetation growth. The onsets of both wild-land fires occurring in early summer in conjunction with related seasonality contributed to the improved accuracy of noted results. The NDVI values were recorded at each subplot location with an individual pixel size of 30 by 30 meters. Using Landsat 5 imagery and ENVI software analysis with a 30 by 30 meter pixel size was ideal for overall spatial resolution because of the vast areas associated with wild-land fire.
2.3. Burn Severity Assessment
Burn severity, pre-NBR (Normalized Burn Ratio), post-NBR, and DNBR values were calculated for both Butte Humboldt and Lightning Complex original subplots. The burn severity index NBR is composed of bands (B4-B7)/(B4 + B7) [29,30], and has been shown to be connected to moisture levels of vegetation [14]. Based on previous research illustrating the ecological relevance of post-wild-land fire data collection within a year time frame [28], Landsat 5 images dated 04/02/2008, 04/05/ 2009, and 08/14/2010 were selected to perform bandmath calculations to collect preand post-NBR values, using ENVI 4.8 computer software. DNBR was calculated by subtracting Pre-NBR from post-NBR values, then multiplied by 1000 [29,30].
3. RESULTS
3.1. Study Sites
Located in the eastern foothill regions of Chico, CA spanning towards Paradise, CA, ten 30 by 30 meter subplots were designated in Butte Humboldt Complex fire affected areas (Table 1, Figure 1). Additionally, located north east of Concow, California, ten 30 by 30 meter subplots were designated in Butte Lightning Complex fire affected areas (Table 1, Figure 1). All subplots were selected and categorized as unburned, burned edge, burned center, and control (Table 1, Figure 1).
3.2. Ground Based Reflectance and NDVI
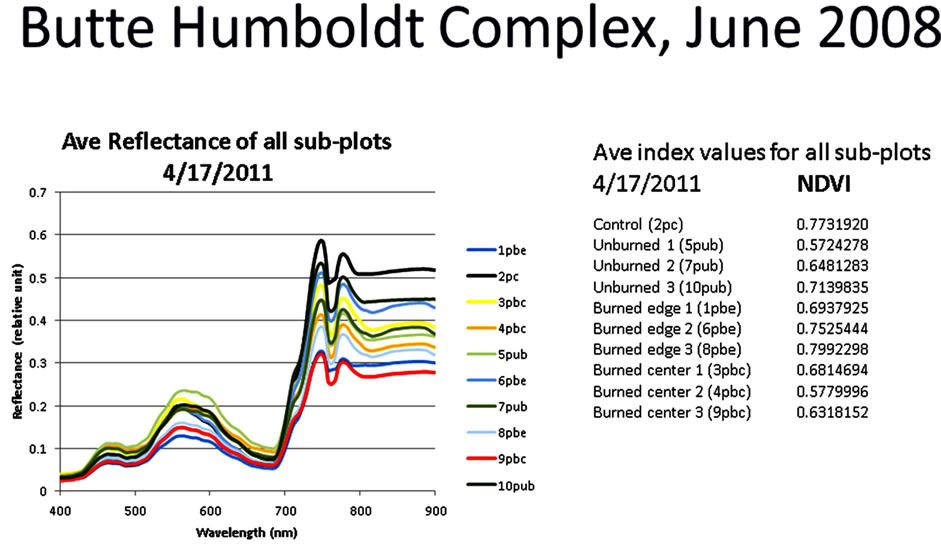
BHC and BLC post-wild-land fire ground based NDVI values revealed vegetation recovery for both BHC and BLC in burned edge and burned center subplots (Figure 2). BHC and BLC control showed higher NDVI values in relation to other subplot categories, with a couple execptions (Figure 2). Both BHC and BLC unburned subplots illustrated a range of NDVI values similar but slightly enhanced to burned edge and burned center subplot categories (Figure 2).
3.3. Satellite Remote Sensing Imagery
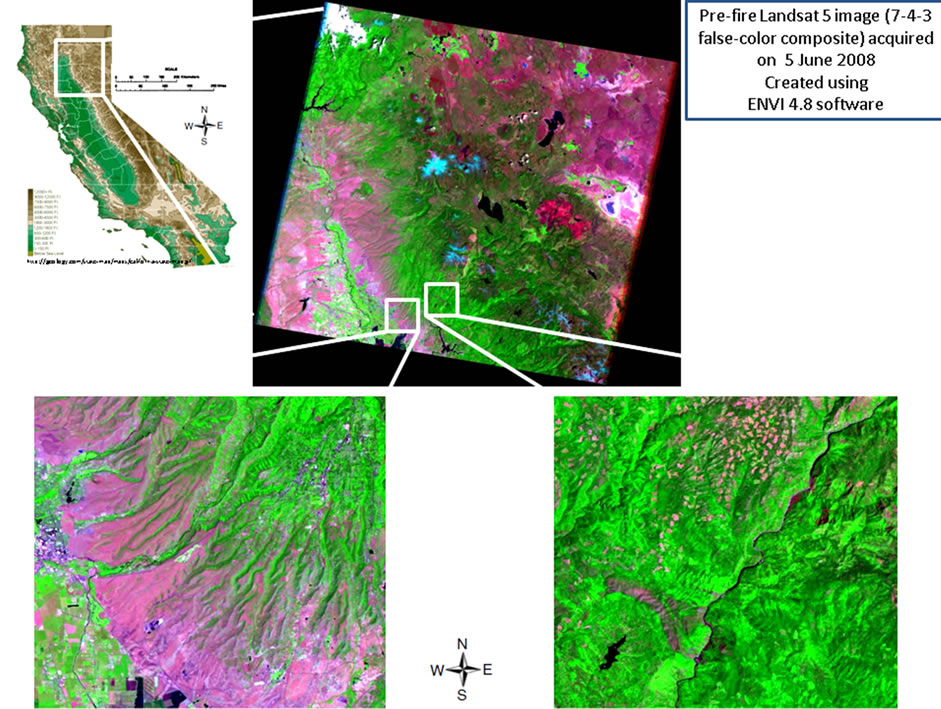
Multi-temporal Landsat 5 images of the areas affected by BHC were visually assessed using band five (1.55 - 1.75 µm): R (04/02/2008), G (04/28/2000), B (04/28/ 2000) spanning over a seven-year period prior to the wild-land fire and band five (1.55 - 1.75 µm): R (04/05/ 2009), G (04/02/2008), B (04/02/2008) spanning over a one-year period preand post-wild-land fire (Figure 3). Multi-temporal image spanning over seven years prior to the wild-land fire showed a light red hue over the entire region (Figure 3). In contrast, the multi-temporal image spanning over a year preand post-wild-land fire
 (a)
(a)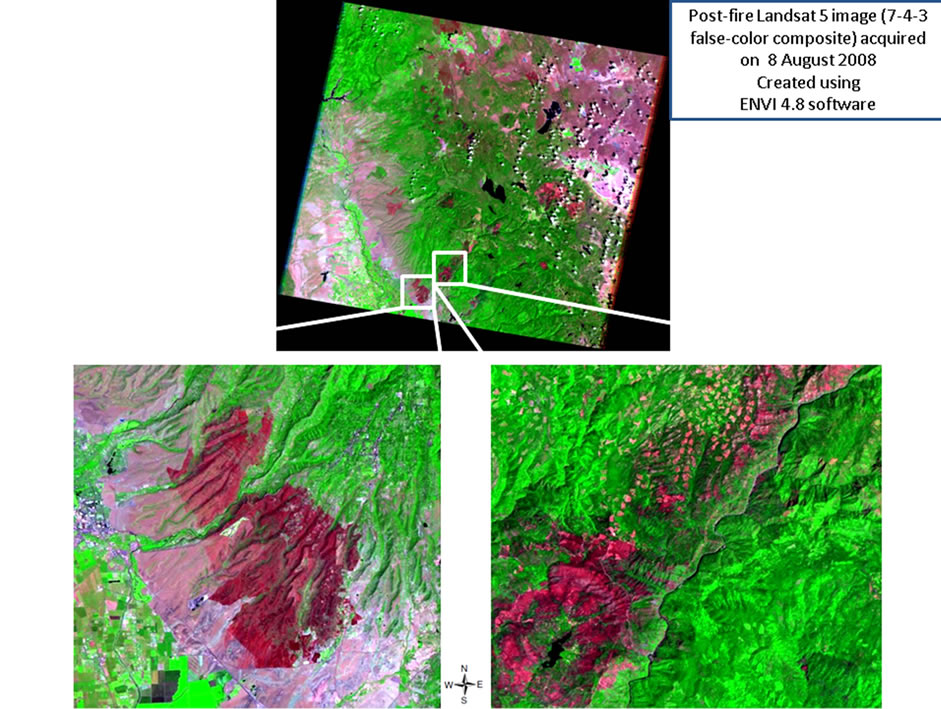 (b)
(b)
Figure 1. Pre-fire Landsat 5 image (7-4-3 false-color composite) acquired on 5 June 2008 and Post-fire Landsat 5 image (7-4-3 false-color composite) acquired on 8 August 2008. Both created using ENVI 4.8 software.
showed a light blue hue with regions of slightly lighter shades of blue present.
Multi-temporal Landsat 5 images of the areas affected by BLC were also visually assessed using band five (1.55 - 1.75 µm): R (04/02/2008), G (04/28/2000), B (04/ 28/2000) spanning over a seven-year period prior to the wild-land fire (Figure 2 left, and band five (1.55 - 1.75 µm): R (04/05/2009), G (04/02/2008), B (04/02/ 2008) spanning over a one-year period preand post-wild-land fire (Figure 3). Multi-temporal image spanning over seven years prior to the wild-land fire showed both dark red and deep bright blue regions, while in contrast, the multi-temporal image spanning over a year preand postwild-land fire showed affected areas in bright intense red (Figure 3).
Landsat 5 NDVI grey-scale images of pre-(04/02/2008) and post-(04/05/2009) BHC were visually assessed (Figure 3). In contrast, the post-wild-land fire image clearly
 (a)
(a)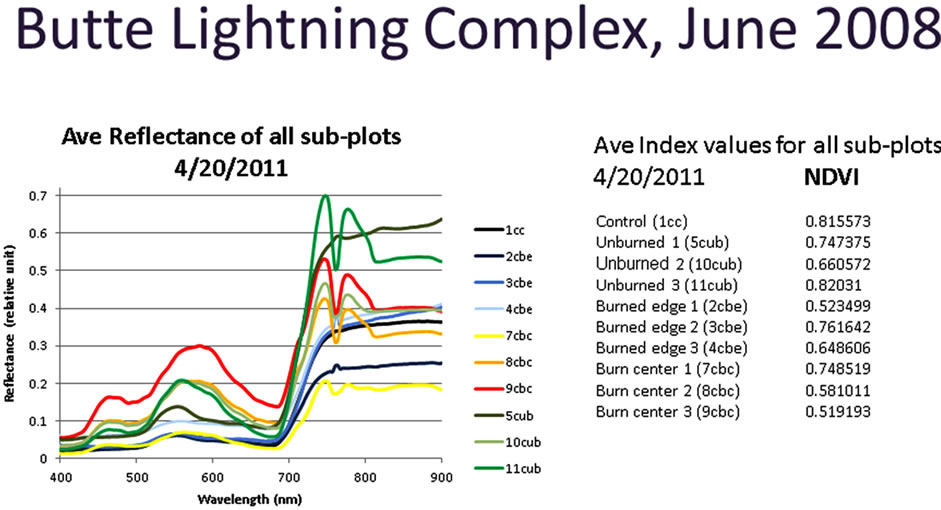 (b)
(b)
Figure 2. Ground based reflectance measurements of Butte Humboldt Complex and Butte Lightning Complex subplots.
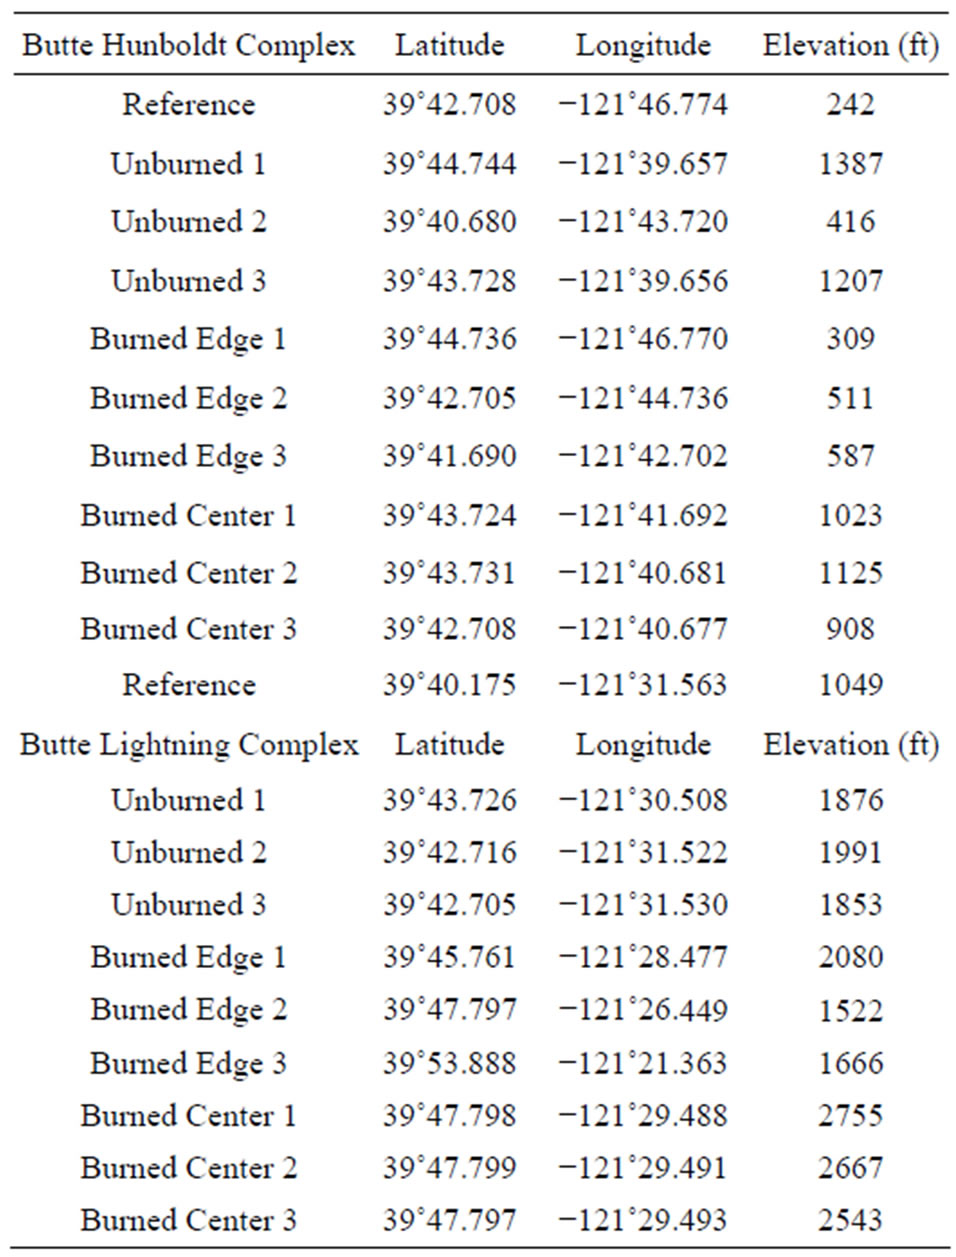
Table 1. Butte Humboldt Complex and Butte Lightning Complex subplot locations and elevations.
showed visible signs of destruction illustrated by the magnitude and direction of the subsequent burn scar (Figure 3). Landsat 5 NDVI grey-scale images of pre- (04/02/2008) and post-(04/05/2009) BLC were visually assessed (Figure 3). The pre-wild-land fire NDVI greyscale image showed the presence of healthy vegetation with a slight semi-circular ring of destruction in the upper center area (Figure 3). In contrast, the post-wild-land fire image clearly showed visible signs of sizable destruction illustrated by the magnitude and direction of the subsequent burn scar (Figure 3).
Analysis of satellite derived NDVI for BHC reference and unburned subplots, April thru August, over a twelveyear span, showed temporal oscillation patterns with unburned subplot number three, consisting of the highest overall NDVI values followed by unburned one subplot, reference subplot, and unburned sub-plot two (Figure 4). Unburned sub-plot three NDVI values decreased to no data from 7/7/2008 to 8/8/2008, followed by a sharp increase, with the highest NDVI value for this increase occurring on 5/7/2009, and a slightly lower than the previous NDVI oscillation pattern observed thereafter (Figure 4). Unburned sub-plot two followed a similar trend with the lowest NDVI values overall recorded on 7/7/ 2008 and 7/23/2008 (Figure 4). Unburned sub-plot two there was a sharp increase in NDVI values on 6/5/2002 followed by a decrease to no data from 6/21/2002 to 8/ 24/2002 (Figure 4). A decrease in NDVI values was also observed for both unburned sub-plot two and reference sub-plots on 8/22/2007. Unburned sub-plot one maintained temporal oscillation patterns throughout the entire time duration (Figure 4).
Analysis of NDVI for BHC reference and burned edge subplots, April thru August, over a twelve-year span, showed temporal oscillation patterns, with burned edge one and two subplots showing the highest overall NDVI values followed by reference and burned edge three subplots (Figure 4). Burned edge three subplot decreased to no data from 7/7/2008 to 7/23/2008 followed by a sharp increase in NDVI values with the highest NDVI value for this increase occurring on 4/5/2009 (Figure 4). Burned edge sub-plot three showed a decrease in NDVI values relative to the oscillation trends on 7/7/2002 (Figure 4). Both burned edge two and reference subplots maintained NDVI temporal oscillation patterns throughout the time duration, except for a decrease to near zero for reference subplot occurring on 8/22/2007 (Figure 4).
Analysis of NDVI for BHC reference and burned center subplots, April thru August, over a twelve-year span, showed temporal oscillation patterns, with burned center two and three subplots showing the highest overall NDVI values followed by burned center one and reference subplots (Figure 4). Burned center one and three subplots showed initial decreases in NDVI prior to the
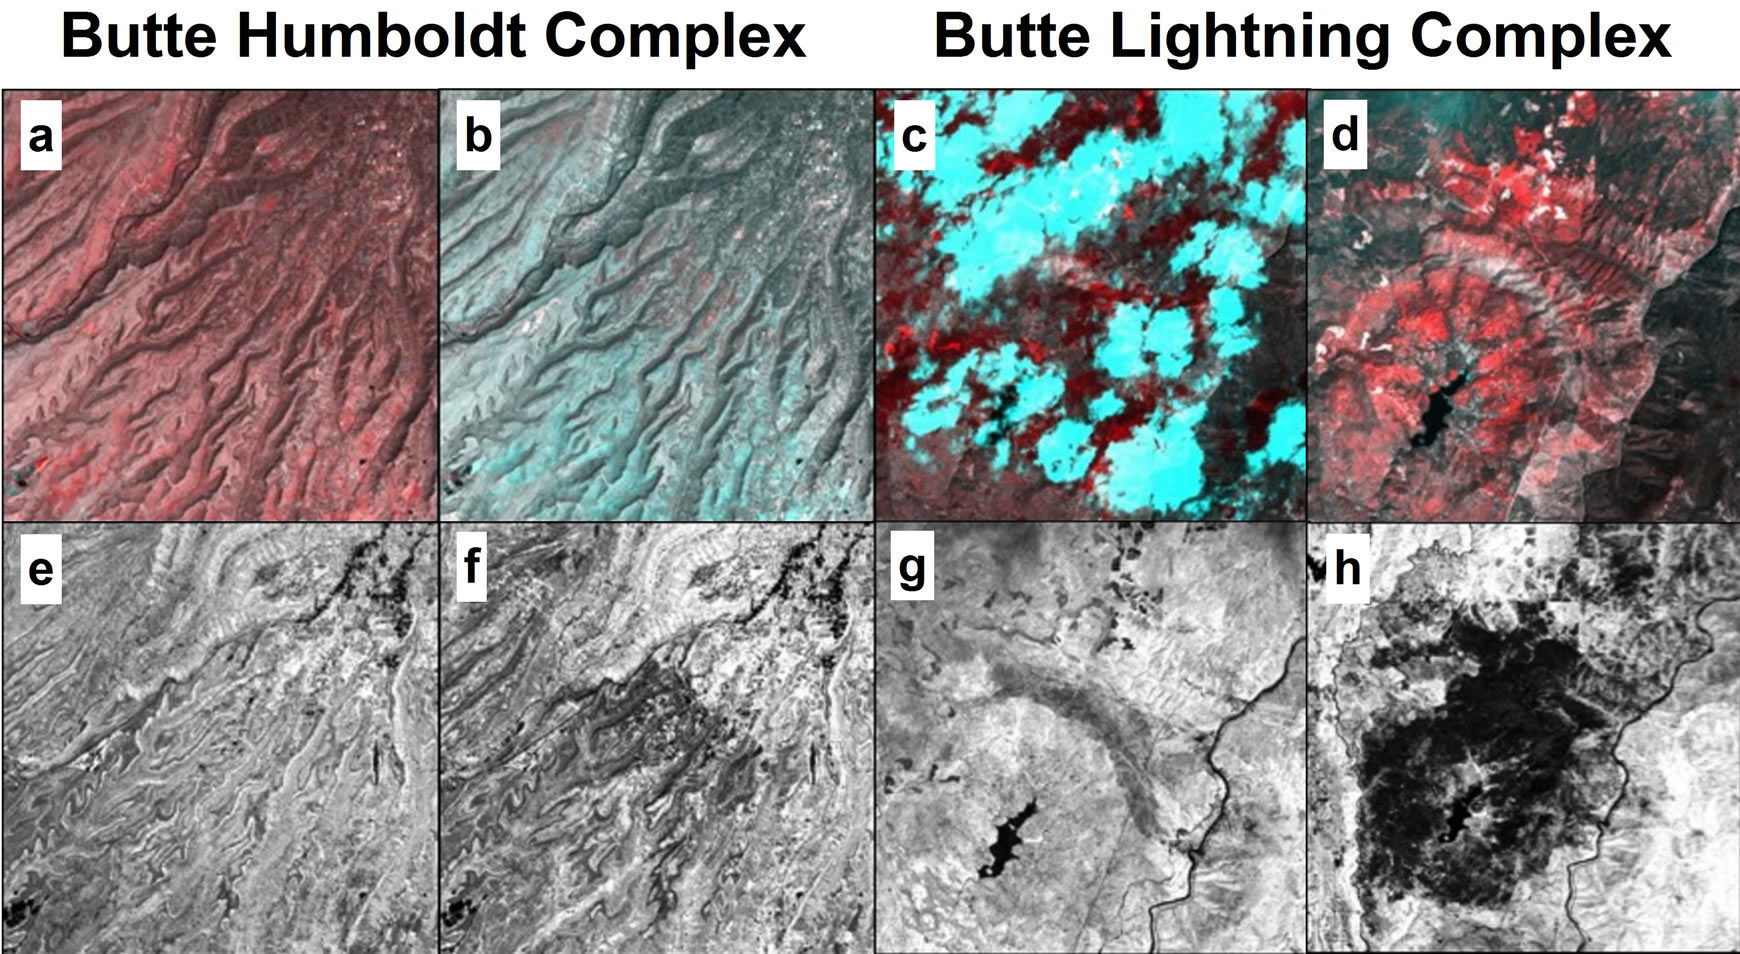
Figure 3. Landsat TM and ETM+ derived false color composites multi-temporal images of (a) (b) Butte Humboldt Complex, band five: (a) Red (04/02/2008), Green (04/28/2000), Blue (04/28/2000); (b) Red (04/05/2009), Green (04/02/2008), Blue (04/02/2008)/(c) (d) Butte Lightning Complex, band five: (c) Red (04/02/ 2008), Green (04/28/2000), Blue (04/28/2000); (d) Red (04/05/2009), Green (04/02/2008), Blue (04/02/2008)/NDVI preand post-wild-land fire grey-scale images of (e) (f) Butte Humboldt Complex: (e) (04/02/2008) and (f) (04/05/2009)/(g) (h) Butte Lightning Complex: (g) (04/02/2008) and (h) (04/05/2009) (Landsat 5 images, thor atmospherically corrected, WRS path 44, row 32) (USGS 2010; ENVI 4.8 2010).
BHC, then both subplots decreased further to no data from 7/7/2008 to 7/23/2008, followed by a sharp increase in NDVI with the highest NDVI values for these increases occurring on 4/5/2009 (Figure 4). Burned center two subplot decreased to near zero from 7/7/2008 to 7/23/2008, followed by an increase in NDVI with the highest NDVI value for this increase occurring on 4/5/ 2009 (Figure 4). Reference subplot maintained NDVI temporal oscillation patterns throughout the entire time duration, except for a decrease to near zero occurring on 8/22/2007 (Figure 4).
Analysis of NDVI for BLC reference and unburned subplots, April thru August, over a twelve-year span, showed temporal oscillation patterns, with the reference subplot showing the highest overall NDVI values, followed by unburned two, unburned three, and unburned one subplots (Figure 4). Unburned one subplot started the time duration with most NDVI values resulting in above 0.4, and then decreased significantly to below 0.05 from 5/4/2002 to 8/24/2002, followed by an increase and oscillation pattern not reaching NDVI values above 0.35 (Figure 4). Unburned two, three, and reference subplots maintained NDVI temporal oscillation patterns throughout the entire time duration except for the reference subplot showing three noticeable decreases in NDVI values on 5/1/2001, 8/11/2003, and 7/23/2008 (Figure 4).
Analysis of NDVI for BLC reference and unburned subplots, April thru August, over a twelve-year span, showed temporal oscillation patterns, with burned edge one and two subplots showing the highest overall NDVI values. However, burned edge one subplot showed no data on 4/28/2000 (Figure 4). Reference and burned edge three subplots both showed lower NDVI values overall with three noticeable decreases (Figure 4). Decreased NDVI values were observed on 5/1/2001, 8/11/2003, and 7/23/2008 for reference subplot and 4/28/ 2000, 4/26/2005 and 4/2/2008 for burned edge three subplot (Figure 4).
Analysis of NDVI for BLC reference and burned center subplots, April thru August, over a twelve-year span, showed temporal oscillation patterns, with the reference and burned center three subplots showing the highest overall NDVI values, followed by burned center two and one subplots (Figure 4). Burned center one, two, and three subplots showed oscillation patterns with noticeable decreases on 4/28/2000 and an increases on 7/23/ 2002 for burned center two subplot and on 5/18/2007 for burned center one subplot (Figure 4).
Reference subplot showed temporal oscillation patterns throughout the entire time duration except for three noticeable decreases in NDVI values on 5/1/2001, 8/11/2003, and 7/23/2008 (Figure 4). Burned center one subplot showed an initial slight decrease in NDVI values from 5/4/2008 to 6/5/2008, then decreasing further to no data from 7/7/2008 to 7/23/2008, with a zero value observed on 8/8/2008 (Figure 4). Burned center one sub-
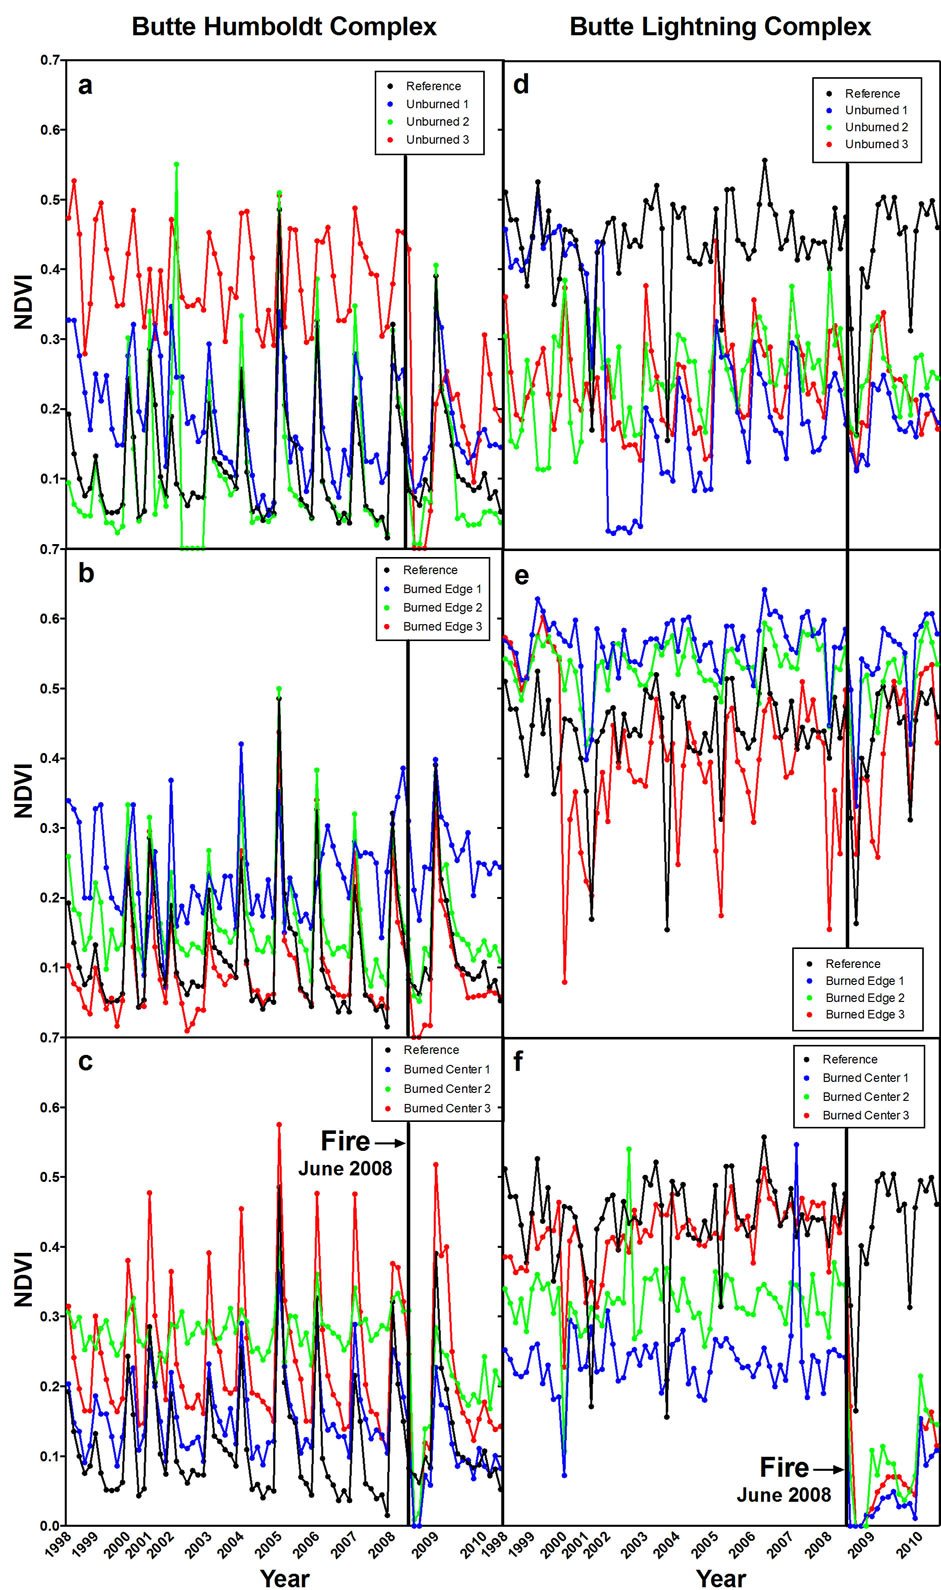
Figure 4. Butte Humboldt Complex (a-c) and Butte Lightning Complex (d-f) 12-year (1998-2010) April through August, Landsat derived NDVI time based data. (a, d) reference and unburned subplots, (b, e) reference and burned edge subplots, (c, f) reference and burned center subplots.
plot then showed a slight increase and decrease in NDVI values staying below .05 from 8/24/2008 to 8/27/2009, followed by an increase on 6/27/2010 (Figure 4). Burned center two subplot showed an initial slight decrease in NDVI values from 5/4/2008 to 6/5/2008, and then decreased to below an NDVI value of 0.1 on 7/7/2008, followed by a further decrease to no data from 7/23/2008 to 8/24/2008 (Figure 4). Burned center two subplot then observed a low NDVI value on 4/5/2009, trailed by a small oscillation and decreasing NDVI values incrementally from 4/21/2009 to 7/26/2009, with a subsequent increase in NDVI values recorded from 8/11/2009 to 6/27/ 2010 (Figure 4). Burned center three subplot showed an initial slight increase in NDVI values from 5/4/2008 to 6/5/2008, then decreased to below 0.2 on 7/7/2008, followed by a further decrease to no data on 7/23/2008, with a zero value observed on 8/8/2008 (Figure 4). Burned center three subplot then observed a near zero value on 8/24/2008, followed by a slight increase and decrease in NDVI values staying below 0.08 from 4/5/2009 to 8/27/2009, followed by an increase on 6/27/2010 (Figure 4).
3.4. Re-NBR, Post-NBR, and (NBR Values for Subplots
The majority of preand post-NBR values were within normal ranges and not above or below a value of 1 (Table 2) [32]. Exceptions were observed for BLC burned center one subplot with a value of zero and burned center two and three subplots with large post-NBR values (Table 2). Delta NBR values for BHC unburned three subplot and BLC unburned two and burned center one subplots indicated low to moderate levels of burn severity (Table 2).
DNBR values for BHC unburned three subplot and BLC unburned two and burned center one subplots indicated low to moderate levels of burn severity (Table 2). In contrast, BHC unburned one and two, and burned edge two subplots indicated a burn severity of unburned (Table 2). Also, BLC reference, unburned one and three subplots, and all burned edge subplots observed DNBR values indicating unburned levels of burn severity (Table 2). DNBR values for BHC reference, burned edge one and three, and burned center three subplots indicated low re-growth (Table 2). DNBR values for BHC burned center one and two subplots indicated low levels of burn severity (Table 2). Unexpectedly, DNBR values for burned center subplots two and three were not identifiable. However, more recent post-NBR imagery of BLC burned center two and three subplots, yielded values within normal ranges, with DNBR values indicating low and mid to high burn severity (Table 2).
4. DISCUSSION
4.1. Ground-Based Reflectance and NDVI
Ground based reflectance spectra for the BHC fire in the control subpolt shows the maximum reflected PAR in the UV wavelength region (Figure 2). BLC reflectance spectra for unburned subplots 1 and 3 shows the maximum reflected PAR in the UV wavelength region (Figure 2). Increased reflectance in the UV wavelength region is generally indicative of vegetations ability to reflect photons of non-photosynthetically active wavelengths under stressful conditions, via secondary pigments such as xanthophylls and caronenoids [38,39]. Expected trends in shifts of the red-edge region and enhanced absortion of PAR for control and unburned subplots vs. burned edge and burn center subplots were not observed (Figure 2). However, a few of the burn center and burned edge subplots in both fires do show
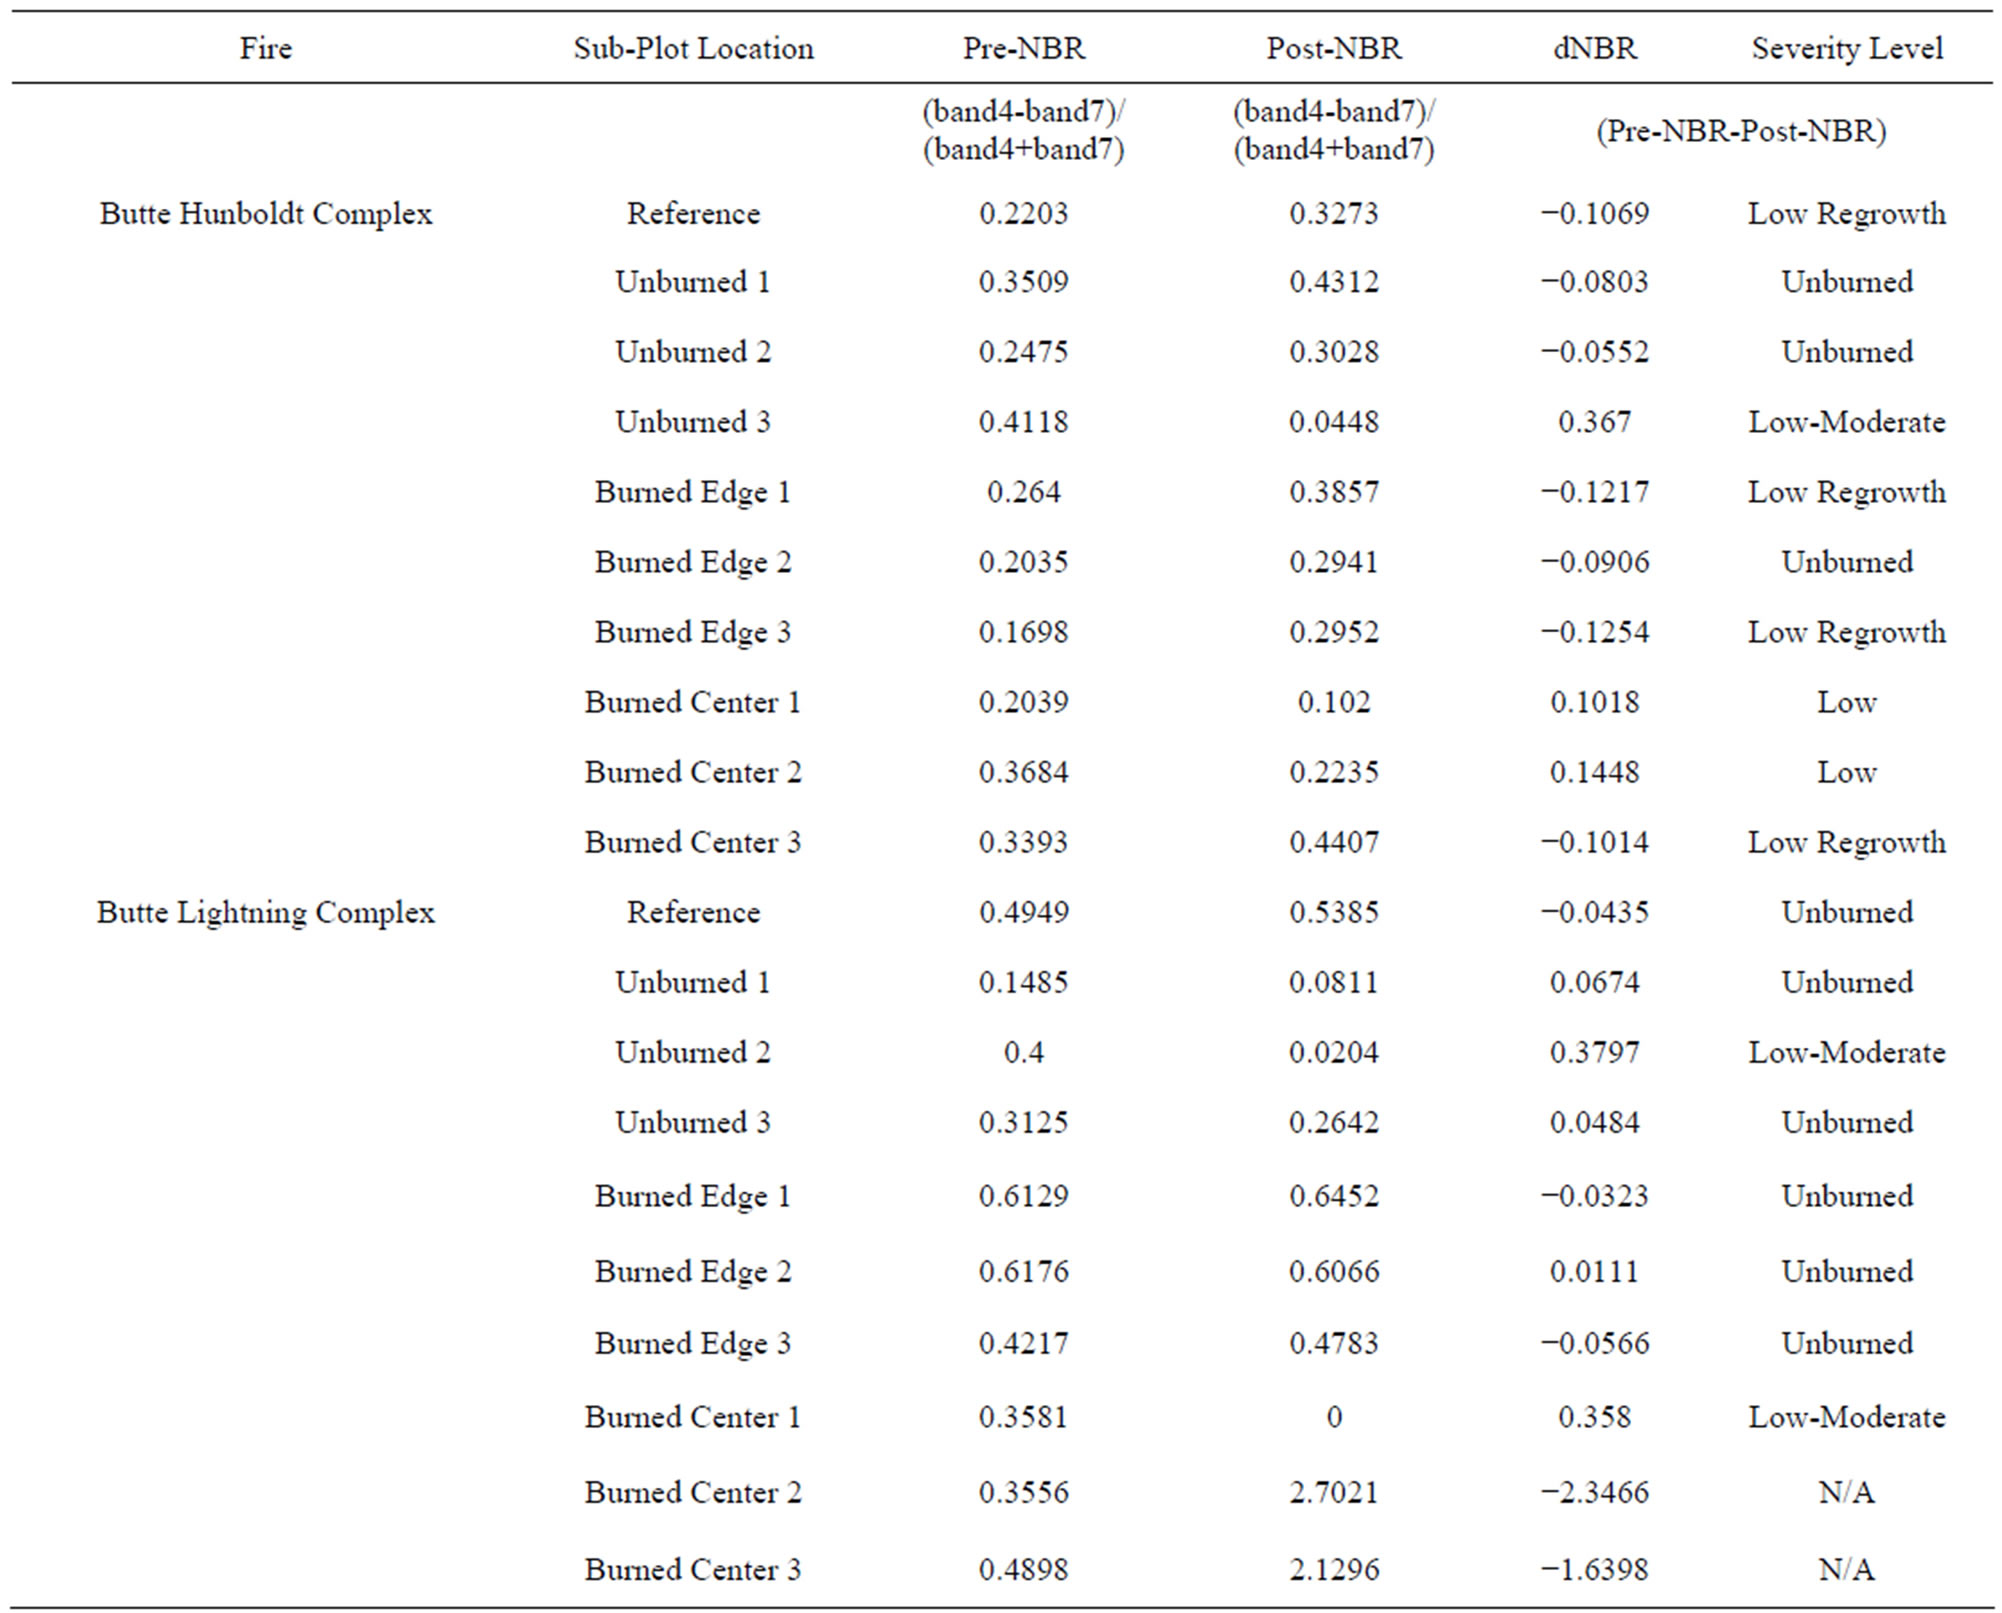
Table 2. Pre-NBR, Post-NBR, DNBR and corresponding burn severity level for sub-plots of Butte Humboldt Complex and Butte Lightning Complex.
enhanced reflectance in the visable spectum, which has been previously described as chlrophyll degredation [38,39]. General expected trends of NDVI values were observed in most subplots in both fires, with higher NDVI observations found in control and unburned subplots with a few exceptions (Figure 2). Caution must be taken when examining this studies ground based reflectance results and discussion must include the well documented varaiable shifts in reflectance and NDVI values when measurements include temoral differences, vegetation types and post-fire recovery.
4.2. Multi-Temporal Imagery
Multi-temporal imagery has revealed relationships associated with the colors red and blue and the shade and intensity of the red and blue colors and the corresponding visual representation of various levels of landscape change [22]. The color red and its shade and intensity
(Figures 3(a)-(d)) may represent negative ecosystem impacts, such as deforestation from logging as well as other possible disturbances, while in contrast, blue and it’s shade and intensity (Figures 3(a)-(d)) may denote new vegetation growth [22].
The seven-year pre-fire multi-temporal image of BHC fire showed the area of study encompassed in a low intensity red hue (Figure 3(a)), which represents negative landscape change and may be attributed to previously documented fire disturbances, water stress and/or a combination of environmental vegetative stressors [1,22]. In contrast, one-year pre-and post-wild-land fire multitemporal image of BHC showed the entire area encompassed in a light blue hue (Figure 3(b)), which indicates some form of vegetation re-growth [22]. This positive re-growth may possibly be linked to increased recovery due to the elasticity of species typical of savannah grassland type vegetation in relation to fire disturbance [22,40,41]. Both multi-temporal images of BHC displayed noticeable levels of landscape change.
Multi-temporal images in areas affected by the BLC revealed extensive levels of landscape change (Figures 3(c) and (d)). The seven-year pre-wild-land fire multitemporal image showed patchy areas of deep blue and deep red (Figure 3(c)), which may indicate noticeable levels of both positive and negative landscape change. However, the bright blue patches in the seven-year pre-wild-land fire are likely representative of atmospheric interference, more specifically cloud formations (Figure 3(c)). One year preand post-wild-land fire multi-temporal image showed the entire area encompassed in varied red color intensity (Figure 3(d)), indicating various possible levels of fire induced negative landscape change. Comparison of multi-temporal images illuminated significant visual differences between both time periods (Figures 3(c) and (d)). While the seven year pre-wild-land fire multi-temporal image consisted of both positive and negative differences in growth potentials, the one year preand post-wild-land fire image revealed a uniquely comprised array of various shades and intensity of red (Figures 3(c) and (d)).
4.3. NDVI Grayscale Imagery
One-year preand post-fire NDVI images for BHC and BLC fires were incorporated into this study as another efficient and relatively quick tool to visually interpret fire impact on vegetation and landscape change. Comparison of NDVI grey scale images of BHC and BLC fires yielded visually apparent differences in preand post-fire vegetation (Figures 3(e) and (h)). BHC pre-fire areas displayed the presence of light pixel regions representative of healthy vegetation (Figure 3(e)) [22]. The BHC post-fire affected areas displayed very low vegetation values mainly occurring in the fire scar, which is easily evident in the post-fire image (Figure 3(f)). The pre-fire NDVI image of BLC affected area revealed a semi-circular region of dark pixels indicative of decreased NDVI values and stressed vegetation, which could possibly be linked to prior fire disturbances (Figure 3(g)) [22,40,42]. Comparison of both complexes post-fire NDVI images gives a unique sense of scale and magnitude in relation to each other. A significantly larger and darker post-fire burn scar was observed for areas affected by the BLC (Figure 3), which indicates greater vegetation damage and potential landscape change, and may be attributed to the prior abundance of woody vegetation, typically observed in this mixed conifer area [22,34]. Vegetation types and post-fire vegetation regrowth dynamics are believed to have been contributing factors leading to less noticeable BHC burn scar and increased NDVI recovery (Figures 3(e) and (h)) [22,40, 41]. Results of the NDVI post-fire image comparisons between complexes, however, may have been influenced by differences in NDVI recovery time, because in efforts aimed at consistency, collection of post-fire NDVI images for both complexes were derived from a further dated singular post-fire image, then transformed into NDVI grey-scale images. This inconsistency resulted in the BHC experiencing a longer recovery time due to image acquisition date and prior containment in relation to the BLC. Consistency among multi-temporal imagery is difficult to maintain, due to a combination of potential variations including but not limited to sensor characteristics, atmospheric conditions, solar angle, and sensor view angle [22].
4.4. Satellite Derived NDVI
The time based NDVI data leading up to the fire complexes of 2008 yielded interesting and informative results (Figure 4). During this twelve year pre-fire span, all subplots for both complexes observed NDVI temporal oscillations patterns indicative of the vegetation seasonality [17,45], which has been shown to be linked to climate fluctuations in precipitation and temperature (Figure 4) [46]. Peak NDVI values were observed occurring at the height of vegetation growth around August, proceeded by minimum NDVI values occurring in the spring months of April and May (Figure 4). Timing of these NDVI temporal oscillation patterns corresponded with precipitation and maximum and minimum temperatures (Figure 4). More specifically, when precipitation was high (climate data not shown), while minimum and maximum temperatures were low [47], decreased NDVI values were observed for the same time period, with an opposite trend observed for drier and hotter months (Figure 4).
These results while adding further evidence to the relationship between NDVI and meteorological data was not an unexpected outcome because of previously documented relationships between oscillation trends in NDVI values and meteorological variability [42,46]. There were however, several anomalies including decreases and increases of NDVI values as well as no data observed being inconsistent with associated seasonal oscillation patterns (Figure 4) [46]. Closer examination revealed several trends that are consistent with previous studies illustrating correlations between NDVI decreases and wildland fire disturbance (Figure 4) [40,42]. For example, BHC unburned subplot two displayed an increase in NDVI values on 6/5/2002, followed by a decrease to no data from 6/21/2002 to 08/24/2002 (Figure 4). In addition, BLC unburned one showed a significant decrease in NDVI values starting on 5/4/2002 and continuing through 8/24/2002 (Figure 4). During this time period the presence of fire disturbance in BHC unburned two subplot area was verified through local fire records [1]. Other decreased NDVI values were recorded for several subplots prior to the onset of BHC and BLC and may be contributed to one or many factors including fire disturbance, vegetation stress, decreased temperatures, increased precipitation, and cloud cover [15,40,48].
Prior studies have established relationships between lack of precipitation and drought to decreased NDVI values [40,42,46,49]. Comparison of local meteorological data to NDVI values of burned center subplots leading up to of the onset of both BHC and BLC illustrated similar trends (Figure 4). Paradise weather stations noted low precipitation associated with drought-like conditions occurred for an extended time period prior to both wildland fires [47]. BHC and BLC burned center subplots experienced normal NDVI values in the spring months of April and May prior to both fire disturbances (Figure 4) indicating gradual vegetation growth, due to relationships between NDVI and above ground net primary production [45]. However, decreased NDVI values were observed directly before both onsets for BHC and BLC, burn center subplots one and three and one and two respectively (Figure 4). A likely explanation could be related to a combination of drought-like conditions and elevated temperatures associated with mid-summer months, coupled with previous buildup of vegetation growth becoming drier and moisture stressed, led to decreased NDVI values prior to fire onset [40,42,46,49], which may have added significant influence on both ignition and nature of both fire disturbances [15]. Other fire studies have found similar results [50]. For example, the Lookout fire occurring in 1999, in north east areas of Plumas National Forest, caused extensive damage of over a thousand (ha) hectares with the onset attributed to lack of precipitation coupled with increased temperatures associated with early, mid, and late summer months [50]. During the temporal period when both Butte Complexes were active, NDVI values for BHC burned center subplots one and three and BLC burned center subplots one, two, and three decreased to no data (Figure 4). NDVI decreases of this nature indicate vegetation loss and exposure of bare rock and soil [22].
NDVI post-fire recovery trends were clearly observed for both BHC and BLC burned center subplots, though spatially different in nature. BHC burned center subplots showed a steady linear post-wild-land fire recovery with NDVI values peaking on 04/05/2009 (Figure 4), while on the same date, BLC burned center two subplot had just started NDVI recovery with an initial recorded low value after experiencing a no data period previously (Figure 4). In addition, BLC burned center one and three subplots exhibited small gradual bell shaped curves, followed by all three BLC burned center subplots exhibiting steady increases in NDVI values (Figure 4). Previous research has noted the possibility of full regeneration of forest type vegetation to pre-fire conditions in a time period of thirteen years following a major wild-land fire [40]. Changes in species composition and initial increases in species abundance have been observed in the first stages of forest recovery [51], on temporal scale of one to three years, followed by lower levels in subsequent years [41,52]. However, increased levels of wild-land fire severity have been shown to decrease overall species abundance [53]. It is believed this initial post-fire temporal period which illustrated NDVI recovery for BLC (Figure 4), represents along with existing burned and partially burned vegetation, an understory re-growth consisting of herbs, forbs, and annuals, which have been shown to advantageously colonize previously unexposed areas [51]. Following this initial period, species abundance has been observed to decrease over time with increased competition from softwood and shrub species shaping the landscape [51].
This 12-year retrospective analysis was able to illustrate post-wild-land fire NDVI recovery of vegetation to pre-wild-land fire NDVI levels. More specifically, BLC burned center three subplot exhibited a full recovery to pre-wild-land fire NDVI levels, with burned center one and two subplots exhibiting slightly less enhanced values (Figure 4). In contrast, even though the onset of BLC was documented approximately ten days later, BLC postwild-land fire NDVI values for all three burned center subplots were not able to achieve full recoveries during the course of this study (Figure 4). It is important to note, however, that while NDVI can temporally display overall vegetation responses in designated areas, limitations including lack of ability to individually discriminate plant types and sensitivities involved with mountainous terrain, slope, and aspect can affect spectrometer sensors and cause associated errors [22,40]. Also, diverse elevations and plant community structure at subplot locations may have added further complications to NDVI results [46]. Previous research has reported variability in NDVI results among different plant community types, related to different ranging elevations and weather conditions involving, cloud cover, temperature, and precipitation fluctuations occurring at individual locations [46,48] There is a possibility that due to the short time span of twelve years pertaining to this time based study, trends associated with longer durations may not be distinguishable and or present [42].
4.5. Interpretation of NBR and (NBR Results
The majority of preand post-NBR values for BHC and BLC unburned, burned edge subplots, were above zero indicating vegetation growth, resulting in DNBR values corresponding to burn severities ranging from unburned to low re-growth (Table 1) [32]. This illustrates that these areas most likely either remained relatively unchanged or experienced slight increased vegetation growth [31,32]. Negative preand post-NBR values represent locations with no vegetation growth [32]. More specifically result in band 4 having a smaller reflectance in relation to band 7 [32]. BHC unburned three and BLC unburned two subplots observed DNBR values indicating low-moderate burn severity (Table 2). BHC burned center three subplot observed DNBR values indicating low re-growth, while in contrast, BLC burned center subplots two and three revealed high negative DNBR values and thus could not be identified (Table 2). Noted discrepancies, however, resided in high positive post-wild-land fire NBR values, particular to BLC burned center two and three subplots, thus effecting DNBR values (Table 2). However, through the use of a later post-NBR acquisition date, NBR values for BLC burned center two and three subplots revealed normal ranges of post-NBR values (data not shown), and were consistent with low and mid to high burn severity levels respectively [32].
Previous studies also have shown the NBR index can be sensitive to differences in types of vegetation classes [27]. NBR values have been shown to be more accurate for forest types in relation to savannah-grasslands areas, while post-fire forest areas with an abundance of burned woody material remnants may cause spectral shifts [27]. An additional study found recovery in riparian areas in the mixed coniferous forest of Plumas National Forest to consist of focal competitors such as white fir sugar pine, mountain alder, Douglas fir, and red-osier dogwood [50]. These softwood vegetation types have been shown to prevail in post-fire re-growth and recovery and can be attributed to fire resistance capabilities, seed bank, and dispersal dynamics [50]. Post-wild-land fire vegetation re-growth in Savannah type grassland areas in contrast have been observed to be less predictable and inconsistent with broad areas ranging from bare ground and sparse grasses and herbs to densely situated fire adapted shrubs and forbs which may have affected accuracy and discrepancies in results [27,53].
BLC burn center one subplot showed a zero post-NBR value, which in turn resulted in a DNBR value indicating low to moderate severity burn (Table 2). Previous research has established a wide range of possibilities for the zero post-NBR values found in BLC burned center one subplot, such as sunlight, thickness and dimensions of pre-wild-land fire vegetation, angles of terrain, and elevation [40]. Previous fire severity assessments illustrated low severity burn levels for Sierra Nevada foothill and mountain regions [55].
DNBR indicating low severity burn for BHC burned center one and two subplots, may be generally described by low-land surface type fires, contrasted with elevated mortality of undersized trees [33]. In contrast, DNBR indications of low to moderate fire severity for BLC burned center one subplot may also be related and consistent with burned bark on surviving trees, along with significant destruction of undersized and crown tree species [33]. BHC and BLC vegetation types may be dissimilar in species and composition. However, they both occupy Mediterranean type ecosystems and are comprised of numerous species of vegetation resistant and well fitted to fire disturbances [40].
5. CONCLUSION
This study’s practical approach allowed for real world application and integration of biological principles with a variety of remote sensing techniques and applications. NBR and DNBR values yielded relevant insight into both BHC and BLC, fire affected ecosystems. The majority of BHC and BLC DNBR results quantified burn severity dynamics; while satellite imagery illustrated differences between BHC and BLC preand post-wild-land fire impacts on vegetation and possible landscape change.
REFERENCES
- Calfire (2010) http://www.fire.ca.gov
- Conedera, M., Tinner, W., Neff, C., Meurer, M., Dickens, A. and Krebs, P. (2008) Reconstructing past fire regimes: Methods, applications, and relevance to fire management and conservation. Quaternary Science Reviews, 28, 555- 576. doi:10.1016/j.quascirev.2008.11.005
- Taylor, A. and Beaty, R. (2005) Climate influences of fire regimes in northern Sierra Nevada Mountains, Lake Tahoe Basin, Nevada, USA. Journal of Biogeography, 32, 425-438. doi:10.1111/j.1365-2699.2004.01208.x
- Fried, J., Torn, M. and Mills, E. (2004) The impact of climate change on wildfire severity: A regional forecast for Northern California. Climatic Change, 64, 161-191. doi:10.1023/B:CLIM.0000024667.89579.ed
- Flannigan, M.D., Stocks, B.J. and Wotton, B.M. (2000) Climate change and forest fires. Science of the Total Environment, 262, 221-229. doi:10.1016/S0048-9697(00)00524-6
- Dale, V.H., Joyce, L.A., McNulty, S., Neilson, R.P., Ayres, M.P., Flannigan, M.D., Hanson, P.J., Irland, L.C., Lugo, A.E., Peterson, C.J., Simberloff, D., Swanson, F.J., Stocks, B.J. and Wotton, B.M. (2001) Climate change and forest disturbances. BioScience, 51, 723. doi:10.1641/0006-3568(2001)051[0723:CCAFD]2.0.CO;2
- Whitlock, C., Shafer, S.L. and Marlon, J. (2003) The role of climate and vegetation change in shaping past and future fire regimes in the northwestern US and the implications for ecosystem management. Forest Ecology and Management, 178, 5-21. doi:10.1016/S0378-1127(03)00051-3
- Zomer, R.J., Trabucco, A. and Ustin, S.L. (2009) Building spectral libraries for wetlands land cover classification and hyperspectral remote sensing. Journal of Environmental Management, 90, 2170-2177. doi:10.1016/j.jenvman.2007.06.028
- Sims, D.A. and Gamon, J.A. (2003) Estimation of vegetation water content and photosynthetic tissue area from spectral reflectance: A comparison of indices based on liquid water and chlorophyll absorption features. Remote Sensing of Environment, 84, 526-537. doi:10.1016/S0034-4257(02)00151-7
- Chandler, C., Cheney, P., Thomas, P., Trabaud, L. and William, D. (1983) Fire in forestry. Forest Fire Behavior and Effects, Vol. I. John Wiley & Sons Ltd., New York.
- Peñuelas, J., Filella, I., Biel, C., Serrano, L. and Savé, R. (1993) The reflectance at the 950 - 970 nm region as an indicator of plant water status. International Journal of Remote Sensing, 14, 1887-1905. doi:10.1080/01431169308954010
- Peñuelas, J., Piñol, J., Ogaya, R. and Filella, I. (1997) Estimation of plant water concentration by the reflective water index WI (R900/R970). International Journal of Remote Sensing, 18, 2869-2875. doi:10.1080/014311697217396
- Filella, I., Peñuelas, J., Llorens, L. and Estiarte, M. (2004) Reflectance assessment of seasonal and annual changes in biomass and CO2 uptake of Mediterranean shrubland submitted to experimental warming and drought. Remote Sensing of Environment, 90, 308-318. doi:10.1016/j.rse.2004.01.010
- Veraverbeke, S., Verstraeten, W.W., Lhermitte, S. and Goossens, R. (2010) Evaluating Landsat Thematic Mapper spectral indices for estimating burn severity of the 2007 Peloponnese wildfires in Greece. International Journal of Wildland Fire, 19, 558-569. doi:10.1071/WF09069
- Pettorelli, N., Olav Vik, J., Mysterud, A., Gaillard, J.M., Tucker, C.J. and Stenseth, N.C. (2005) Using the satellite-derived NDVI to assess ecological responses to environmental change. Trends in Ecology and Evolution, 20, 503-510. doi:10.1016/j.tree.2005.05.011
- Lichtenhaler, H.K., Wenzel, O., Buschmann, C. and Gitelson, A. (1998) Plant stress detection by reflectance and fluorescence. Annals of the New York Academy of Sciences, 851, 271-285. doi:10.1111/j.1749-6632.1998.tb09002.x
- Guerschman, J.P., Paruelo, J.M. and Burke, I.C. (2003) Land use impacts on the Normalized Vegetation Index in temperate Argentina. Ecological Applications, 13, 616- 628. doi:10.1890/1051-0761(2003)013[0616:LUIOTN]2.0.CO;2
- Tucker, C.J. (1979) Red and photographic infrared linear combinations for monitoring vegetation. Remote Sensing of Environment, 8, 127-150. doi:10.1016/0034-4257(79)90013-0
- Salazar. L., Kogan, F. and Roytman, L. (2007) Use of remote sensing data for estimation of winter wheat yield in the United States. International Journal of Remote Sensing, 28, 3795-3811. doi:10.1080/01431160601050395
- Rosso, P.H., Pushnik, J.C., Lay, M. and Ustin, S.L. (2005) Reflectance properties and physiological responses of Salicornia virginica to heavy metal and petroleum contamination. Environmental Pollution, 137, 241-252. doi:10.1016/j.envpol.2005.02.025
- Ustin, S.L. and Gamon, J.A. (2010) Remote sensing of plant functional types. New Phytologist, 186, 795-816. doi:10.1111/j.1469-8137.2010.03284.x
- Horning, N., Robinson, J.A., Sterling, E.J., Turner, W. and Spector, S. (2010) Remote sensing for ecology and conservation: A handbook of techniques. Oxford University Press, New York, 4-371.
- Inoue, Y. (2003) Synergy of remote sensing and modeling for estimating ecophysiological processes in plant production. Plant Production Science, 6, 3-16.
- Black, S.C. and Guo, X. (2008) Estimation of grassland CO2 exchange rates using hyperspectral remote sensing techniques. International Journal of Remote Sensing, 29, 145-155. doi:10.1080/01431160701253220
- US Geological Survey (2011) www.usgs.gov/
- ENVI 4.8 (2010) Exelis visual information solutions. Boulder, CO. www.exelisvis.com
- Epting, J., Verbyla, D. and Sorbel, B. (2005) Evaluation of remotely sensed indices for assessing burn severity in interior Alaska using Landsat TM and ETM+. Remote Sensing of Environment, 96, 328-339. doi:10.1016/j.rse.2005.03.002
- Soverel, N.O., Perrakis, D.D.B. and Coops, N.C. (2010) Estimating burn severity for Landsat dNBR and RdNBR indices across western Canada. Remote Sensing of Environment, 114, 1896-1909. doi:10.1016/j.rse.2010.03.013
- Smith, A.M.S., Lentile, L.B., Hudak, A.T. and Morgan, P. (2007) Evaluation of linear spectral unmixing and ∆NBR for predicting post-fire recovery in a North American ponderosa pine forest. International Journal of Remote Sensing, 28, 5159-5166. doi:10.1080/01431160701395161
- Key, C.H. and Benson, N.C. (2006) Landscape assessment: Sampling and analysis methods: Firemon: Fire effects monitoring and inventory system. General Technical Report. USDA Forest Service, Rocky Mountain Research Station, Fort Collins CO., RMRS-GTR-164-CD.
- Van Wagtendonk, J.W., Root, R.R. and Key, C.C. (2004) Comparison of AVIRIS and Landsat ETM+ detection capabilities for burn severity. Remote Sensing of Environment, 92, 397-408.
- Miller, J.D. and Thode, A.E. (2007) Quantifying burn severity in a heterogeneous landscape with a relative version of the data Normalized Burn Ratio (dNBR). Remote Sensing of Environment, 109, 66-80. doi:10.1016/j.rse.2006.12.006
- Skinner, C. and Chang, C. (1996) Fire regimes, past and present. Sierra Nevada Ecosystem Project: final report to Congress. http://gis.fs.fed.us/psw/programs/ecology_of_western_forests/publications/publications/1996-01-SkinnerChang.pdf
- Barbour, M.G. and Major, J. (1977) Terrestrial vegetation of California. University of California Davis, Davis, 18- 906.
- Garmin (2008) Garmin International Inc. KS 66062, Olathe. www.garmin.com/
- Unispec, S.C. (2008) PP Systems International Inc., Amesbury. www.ppsystems.com
- Letts, M.G., Phelan, C.A., Johnson, D.R.E. and Rood, S.B. (2008) Seasonal photosynthetic gas exchange and leaf reflectance characteristics of male and female cottonwoods in a riparian woodland. Tree Physiology, 28, 1037-1048. doi:10.1093/treephys/28.7.1037
- Jenkins, M., Krofcheck, J.D., Pushnik, J., Teasdale, R. and Houpis, J. (2012) Exploring the edge of a natural disaster. Open Journal of Ecology, 2, 222-232.
- Furuuchi, H., Jenkins, M., Houpis, J., Senock, R. and Pushnik, J. (2013) Estimating plant crown transpiration and water use efficiency by vegetative reflectance indices associated with chlorophyll fluorescence. Open Journal of Ecology, 3, 122-132.
- Vicente-Serrano, S.M., Perez-Cabello, F. and Lasanta, T. (2011) Pinus halepensis regeneration after a wildfire in a semiarid environment: Assessment using multitemporal Landsat images. International Journal of Wildland Fire, 20, 195-208. doi:10.1071/WF08203
- Hernandez-Clemente R., Cerrillo R.M., HernandezBermejo, J.E., Royo, S. and Kasimis, N.A. (2009) Analysis of postfire vegetation dynamics of Mediterranean shrub species based on terrestrial and NDVI data. Environmental Management, 43, 876-887. doi:10.1007/s00267-008-9260-x
- Van Leeuwen, W.J.D., Casady G.M., Neary, D.G., Bautista, S., Alloza, J.A., Carmel, Y., Wittenberg, L., Malkinson, D. and Orr, B.J. (2010) Monitoring postwildfire vegetation response with remotely sensed time series data in Spain, USA and Israel. International Journal of Wildland Fire, 19, 75-93. doi:10.1071/WF08078
- Ustin, S.L. and Xiao, Q.F. (2001) Mapping successional boreal forests in interior central Alaska. International Journal of Remote Sensing, 22, 1779-1797.
- Chen, X., Vierling, L. and Deerling, D. (2005) A simple and effective radiometric correction method to improve landscape change detection across sensors and across time. Remote Sensing of the Environment, 98, 63-79. doi:10.1016/j.rse.2005.05.021
- Paruelo, J.M. and Lauenroth, W.K. (1995) Regional patterns of normalized difference vegetation index in North American shrublands and grasslands. Ecology, 76, 1888- 1898. doi:10.2307/1940721
- Gomez-Mendoza, L., Galicia, L., Cuevas-Fernandez, M.L., Magana, V., Gomez, G. and Palacio-Prieto, J.L. (2008) Assessing onset and length of greening period in six vegetation types in Oaxaca, Mexico, using NDVIprecipitation relationships. International Journal Biometeorology, 52, 511-520. doi:10.1007/s00484-008-0147-6
- National Oceanic and Atmospheric Administration (2010) www.noaa.gov/
- Zhong, L., Ma, Y., SuhybSalama, M. and Su, Z. (2010) Assessment of vegetation dynamics and their response to variations in precipitation and temperature in the Tibetan Plateau. Climatic Change, 103, 519-535. doi:10.1007/s10584-009-9787-8
- Lloret, F., Lobo, A., Estevan, H., Maisongrande, P., Vayreda, J. and Terradas, J. (2007) Woody plant richness and NDVI response to drought events in Catalonian (northeastern Spain) forests. Ecology, 88, 2270-2279. doi:10.1890/06-1195.1
- Kobziar, L.N. and McBride, J.R. (2006) Wildfire burn patterns and riparian vegetation response along two northern Sierra Nevada streams. Forest Ecology and Management, 222, 254-265. doi:10.1016/j.foreco.2005.10.024
- Kavgaci, A., Carni, A., Basaran, S., Basaran, M.A., Kosir, P., Marinsek, A. and Silc, U. (2010) Long-term post-fire succession of Pinus brutia forest in the east Mediterranean. International Journal of Wildland Fire, 19, 599-605. doi:10.1071/WF08044
- Tarrega, R. and Calabuig, E.L. (1987) Effects of fire on structure dynamics and regeneration of Quercus pyrenaica ecosystems. Ecologia Mediterranea, 13, 79-86.
- Keeley, J.E., Brennan, T. and Pfaff, A.H. (2008) Fire severity and ecosystem responses following crown fires in California shrublands. Ecological Applications, 18, 1530- 1546. doi:10.1890/07-0836.1
- Epting, J., Verbyla, D. and Sorbel, B. (2005) Evaluation of remotely sensed indices for assessing burn severity in interior Alaska using Landsat TM and ETM+. Remote Sensing of Environment, 96, 328-339. doi:10.1016/j.rse.2005.03.002
- Perry, D.A., Hessburg, P.F., Skinner, C.N., Spies, T.A., Stephens, S.L., Taylor, A.H., Franklin, J.F., McComb, B. and Riegel, G. (2011) The ecology of mixed severity fire regimes in Washington, Oregon, and Northern California. Forest Ecology and Management, 262, 703-717. doi:10.1016/j.foreco.2011.05.004