Journal of Surface Engineered Materials and Advanced Technology
Vol.2 No.1(2012), Article ID:16996,8 pages DOI:10.4236/jsemat.2012.21006
Glass Marking with CO2 Laser: Experimental Study of the Interaction Laser-Material
![]()
1Laboratoire Génie Civil et Géo-Environnement, Université de Lille Nord-de-France, Faculté des Sciences Appliquées, Technoparc Futura, Université d’Artois, Béthune, France; 2Laboratory of Mechanical Engineering, Universitatea de Nord Baia Mare, Baia Mare, Romania; 3Centre d’Application des Lasers de Flandres Artois (CALFA), Institut Universitaire de Technologie de Béthune, Béthune, France.
Email: pascal.deprez@univ-artois.fr
Received November 9th, 2011; revised December 1st, 2011; accepted December 17th, 2011
Keywords: Laser; Glass; Marking; Experimental Design
ABSTRACT
Laser marking is a laser processing technology used in many fields of industry like automotive [1], aerospace [2], microelectronic [3] and medecine [4]. CO2 laser is an appropriate source for marking glasses [5]. Compared to the other techniques of marking, the principal advantages of the use of the laser are: made inalterable, high degree of accuracy and the smoothness of the features, the possibility of marking at difficult to reach places, and the fact of being able to mark fragile materials like ceramic and glass [6]. In this experimental work, the influence of marking parameters like interaction time laser-glass, laser power, shooting time etc. on the micromarking precision are reported. A “melt” depth prediction model has been established.
1. Introduction
Glass is a solid, transparent and homogeneous material wich is breakable. It is an amorphous solid product, obtained by solidification of a molten material. Generally it consists of oxide of silicon (SiO2 silica). Glasses constitute a whole extremely varied of products whose properties are many, those depend mainly on the composition [7] but also on the treatments, in particular thermal [8], undergone by material.
The marking of glass presents two principal aspects, namely the purely decorative side and the aspect traceability or identification of products. Indeed, it makes it possible to include in a permanent way of the job numbers, matric code of data or any other important information on parts and articles.
Many techniques allow to carry out marking: mechaniccal engraving, hot stamping, the jet of ink, tampography or serigraphy. These techniques are completed with more and more by the laser marking which combines flexibility and indelibility. The lasers available make it possible to practically mark all materials like glass with a very great flexibility. The depths of engraving spread out few microns with some tenth of millimetre.
The arguments in favour of marking by laser are strong. It is a technique fast, flexible, reliable and permanent. Marking is done without contact. It is about a light or major machining according to material or the interest of the detail. It should be noted that no ink is employed.
During engraving, the material is marked by the laser beam while melting or while evaporating locally. So in basic material like glass, the condition first is the absorption of the laser radiation which depends initially of the laser wavelength [9].
The aim of the study was to establish a modeling of laser-glass interaction, in the case of marking by laser CO2, concerning the parameters of the laser.
2. Principle of Laser Marking
Two techniques are usually used. The first technique, marking by transfer of image, consists in clarifying the surface of the part to be marked through a mask (kind of negative to print) placed on the way of the beam. The pulsated lasers CO2 deliver impulses of high energy, each impulse allowing the marking of a part [10]. The second technique, marking by displacement of the beam, uses the focusing of the beam of a laser pulsated of average energy, as in general a YAG solid laser, on surface to mark [5]. A combination of mirrors galvanometric of weak inertia directs the beam [11]. In addition, recent developments on microablation of glass materials allow the use of excimer lasers [12].
Many laser parameters influence the quality of marking. The choice of the laser is guided by the whole of the physical parameters of the material and the laser which make it possible to reach the temperature of vaporization with the greatest effectiveness. Consequently, the absorption coefficient of the material with respect to the wavelength of the laser is crucial. For example, glass is a difficult material to ablate at certains wavelengths due to its transparency and ability to reflect the radiation [9]. The laser CO2 is appropriate better for glasses in particular. Indeed, for the wavelength of the laser CO2 (10.6 μm), glass is very absorbent. This is due to silica present in this material. The thermal conductivity of material also plays a part in the choice of the laser: if it is very weak (wood, paper etc.), vaporization will be immediate but limit the cut out thickness; if it is raised, the choice of the laser will take account of the thickness of material. Some authors showed the influence of glass substrate thickness in laser scribing of glass [13]. The choice of the laser depends also of the flexibility of the positioning of the beam CO2 or YAG, gas of assistance (oxygen or inert gas), of sequentially of the operations to be carried out. Other parameters also influence the quality of marking such as energy and temporal parameters: the laser can be continuous or pulsated. If it is pulsated, various elements will play a part, namely: energy by impulse, duration of impulse, the rate of repetition, the power peak and average power.
The irradiation of the object, under conditions of energy specific high, led to the passage of material in the liquid state and especially to its vaporization, even with the formation of a plasma. Thus, the type of gas of assistance and its flow have an important role. Indeed, the high pressure created on the surface of the part is made profitable to ensure the expulsion of liquid material.
The laser beam is partly reflected by the surface of the irradied material. Its structure, its chemical composition, its mechanical characteristics (density, hardness etc.), its surface quality and its electric, thermal and optical properties influence the effectiveness of laser marking. For glass, one notes 94% of absorption with the laser CO2 (wavelength of 10.6 μm). This coefficient increases with the temperature of material.
3. Experimental Conditions
3.1. Laser Treatments
The marking tests were carried out on workpieces of traditional glass of glazing says “glass float” of 3.5 mm thickness. A 1.5 kW continuous wave (CW) CO2 laser (Cilas CI 2000) with a wavelength of 10.6 μm was used as the heat source. The output beam mode was a Gaussian (TEM00). A ZnSe lens with a focal length of 127 mm and with a diameter of 38 mm was used as a focussing optic. The laser beam has a diameter of 0.6 mm on the surface of the workpiece. The marking tests were carried out in pulsated mode, with the beam normal to the workpiece surface.
The main marking parameters studied are the power level of the CO2 laser beam and the interaction time. The surface marking treatments were carried out, under a protective nitrogen atmosphere (1.5 bar), for different beam energy densities and interaction times. The incident power was varied between 70 and 680 W. Typical interaction times were in the range 0.5 - 1 ms. With the aim of estimating the influence of the number of shootings on the marking, test workpieces marked by series from 1 to 10 superimposed shootings were studied.
3.2. Evaluation of the Volumes of the Cavities
The diameters and the depths of the impacts were measured. Measurements of diameter were taken under a microscope. Measurements of depth generated difficulties. Indeed, the first measurements were realized on “mono” impact but it proved that inclusions of glass in the height of the cavity prevented from measuring this height correctly. Taken measurement corresponded to the height between the surface of glass and inclusion and not between the surface of glass and the lower part of the cavity. To measure the depth of the impacts correctly, while freeing itself from inclusions, “squares” of adjacent impacts with 50% overlap were carried out (Figure 1).
The value depth of the impacts was established from the average of 6 depths measured on each “square” of impacts.
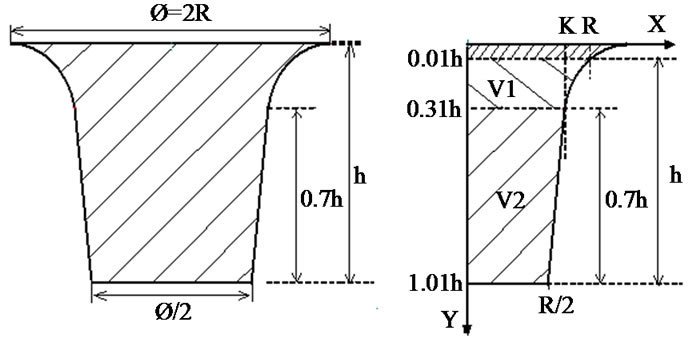
In order to evaluate the volumes of the cavities, these are considered as volumes of revolution, resulting from the rotation of a particular profile around the axis y (Figure 2).
The following hypothesis were considered:
• The depth h of the cavity is measured between the surface of the workpiece and the bottom of the impact
• the diameter of the bottom of the impact is equal to half of the diameter of the impact on the surface of the workpiece (Figure 2(a))
• the higher part of the profile, i.e. 30%, is considered as Gaussian,
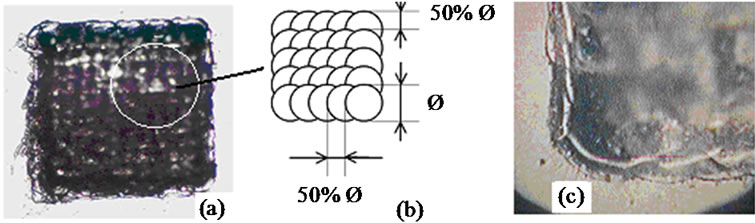
Figure 1. (a) Optical micrograph showing “square” of impacts; (b) Adjacent impacts with 50% of overlapping; (c) Detail of (a).
 (a) (b)
Figure 2. (a) Profile of the cavity; (b) Parameters setting of the profile of the cavity.
• the non Gaussian part of the profile, i.e. 70%, is considered as linear
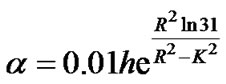
• the depth h and diameter higher ∅ of the cavity are in experiments given
• the Gaussian function not being able to be null, a parameter of shift was arbitrarily selected, namely 0.01 h. The equation of the profile being y = f(x), the expression of f(x) is Gaussian between 0.01h and 0.31h; linear between 0.31h and 1.01h (Figure 2(b)).
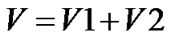
The reciprocal function g of f is defined per g(y) = x for any point (x, y) pertaining to the profile of the impact. The volume of the cavity is the sum of the volumes generated by each portion of the profile, V1 for the Gaussian part and V2 for the linear part.
3.2.1. Volume V2 of the Linear Part of the Cavity
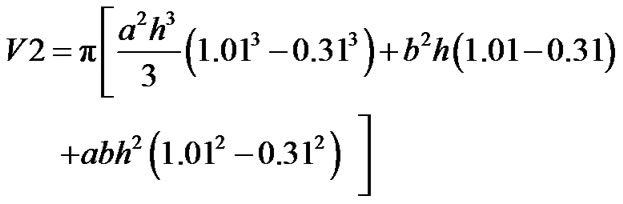 (1)
(1)
with 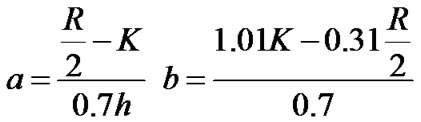
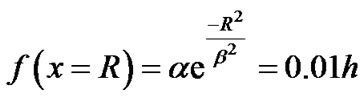
and, K the value of the Gaussian at x = 0.31h, i.e. the radius of the cavity.
3.2.2. Profile Equation of the Gaussian Part of the Cavity
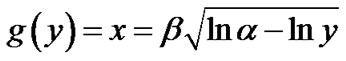
Hypothesis: the radius of the cavity corresponds to the value of x for which y = 0.01h. This value of 0.01 is arbitrary and allows to model, for y between 0.01h and 0.31h, the profile of the cavity with a Gaussian function.
For an impact with the parameters h and R experimentally determined, the Gaussian profile has the form:
 (2)
(2)
Boundary conditions:
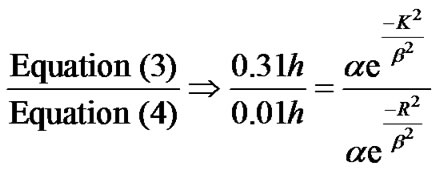
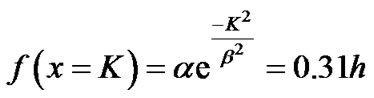 (3)
(3)
 (4)
(4)
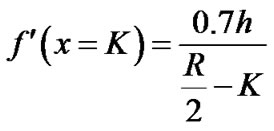
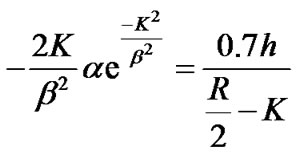
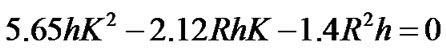
According to the principle of continuity of slope at x = K, the derivative Gaussian (for x = K) is equal to the derivative of the linear part (for x = K)
Slope of the linear part for x = K (from Figure 2(b)):
 (5)
(5)
Slope of the Gaussian part for x = K (from Equation (2)):
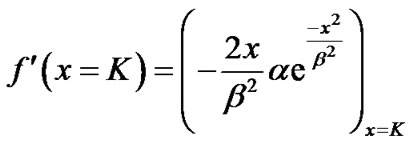 (6)
(6)
From Equation (5) and Equation (6),
 (7)
(7)
with 
Determination of the coefficients a and b in fonction of R and K,
 (8)
(8)
We deduce:
 (9)
(9)
and from Equation (4) and Equation (9),
 (10)
(10)
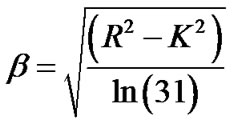
From Equations (7), (9) and (10), one obtained:
A solution satisfies this quadratic equation and the conditions imposed, i.e. K > 0 and K > R/2,
 (11)
(11)
with R and h experimentally determined The coefficients α and β are determined by R and K (Equations (9) and (10)). However, the coefficient K is expressed as a function of the radius R and h (Equation (11)). So, the Gaussian profile of the cavity is perfectly defined, as a function of R and h, between y = 0 and y = 0.3h.
The reciprocal function g of f being defined per g(y) = x for any point (x, y) pertaining to the Gaussian profile of the impact between 0.01h and 0.31h, from Equation (2) one obtained :
3.2.3. Volume V1 of the Gaussian Part of the Cavity
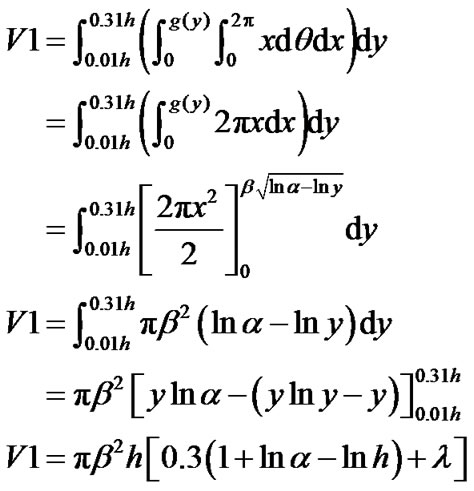 (12)
(12)
with, 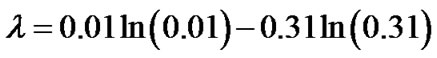
From Equation (1) and Equation (12),
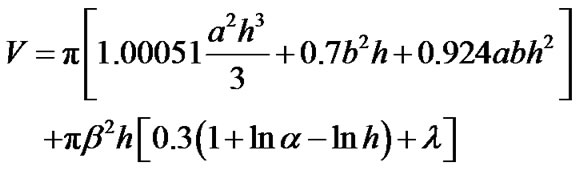 (13)
(13)
the coefficients a, b, α, β, λ, and K are defined based on the experimental data R and h.
4. Results and Discussion
With an aim of controlling the quality of marking, the influence of the parameters laser power and time of shooting on the depth and the diameter of the cavities carried out were studied. A first serie of tests made it possible to determine, for unit shootings, the field in which the couples laser power/time of shooting produce impacts of good quality (Table 1). Glass being a material not very resistant to the thermal shock, many impacts generated crackings. The experimental results obtained show that a time of long shooting with a too important energy generate a cracking of the glass workpiece.
In the field of study selected (Table 1), the diameters and the depths of the cavities obtained were measured. The volumes V of the cavities (Figure 3) generated were evaluated from Equation (13).
The density of glass being of 2500 Kg·m–3, the ejected matter masses of the cavities were calculated. Table 2 shows the results obtained.
The depths and the diameters of the impacts increase, for a fixed time of shooting, with the increase of the incident energy E (Figure 4). Thus, the mass of glass ejected, determined with the diameter and the depth of the generated cavity, also increases for a fixed time of shooting with the increase of E (Figure 5).
For a shooting time of 5 ms, the depth of the cavity increases less quickly, with the increase of the incident energy E, than with shooting times of 0.5 and 0.6 ms. It also is to note that for a shooting time of 0.8 ms, the diameter of the cavity increases less quickly as a function of E than for shooting times of 0.5 ms, 0.6 ms and 0.7 ms. This last behavior observed is confirmed for a shooting time of 0.9 ms.
The influence of the repetition of the shootings on the characteristics (diameter, depth, volume, ejected matter mass) of the cavities generated, as a function of the number of shootings, for an interaction time of 0.5 ms, a laser power of 230 W and an incident energy of 115 mJ were studied. Table 3 shows the results obtained.
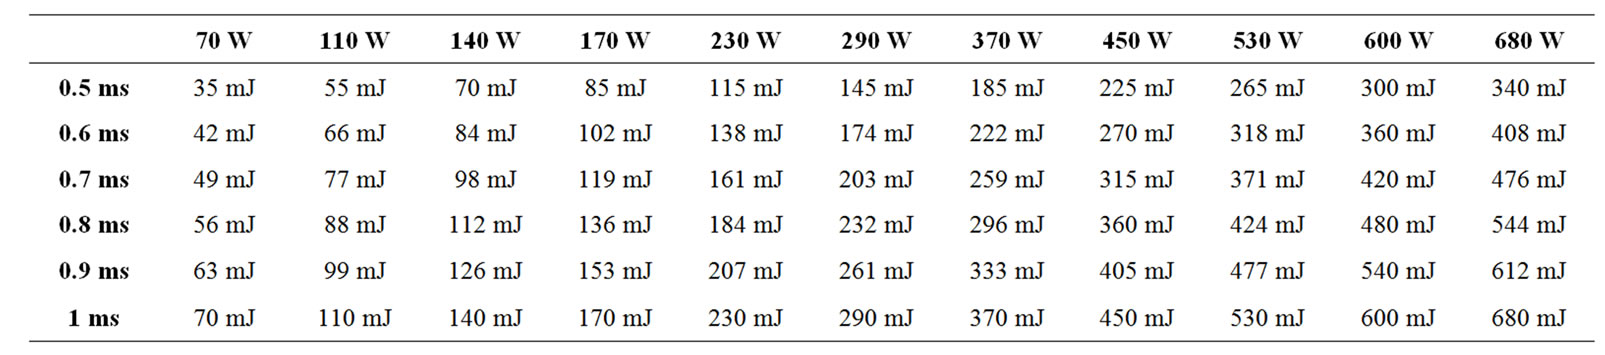
Table 1. Incident energy as a function of the laser parameters used (laser power, shooting time). The grayed zone corresponds to the field in which the couples laser power/time of shooting produce impacts of good quality.
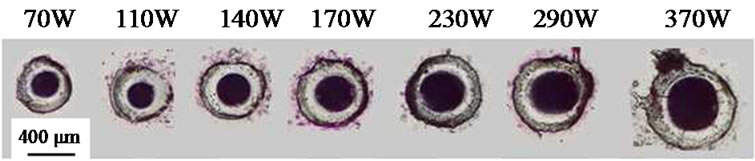
Figure 3. Optical micrograph showing the cavities generated as a function of the laser power for a shooting time of 0.5 ms.


Table 2. Characteristics (diameter, depth, volume, ejected matter mass) of the cavities generated as a function of the interaction time, the laser power and the incident energy.
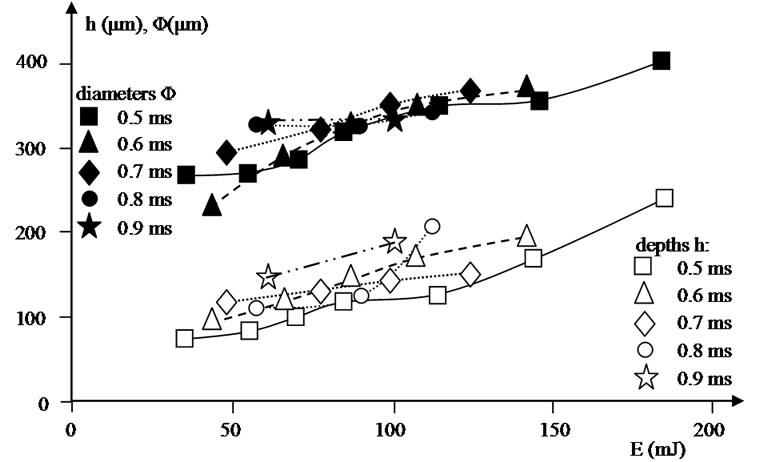
Figure 4. Measured depths and diameters of the cavities generated, as a function of the incident energy, for different times of shooting.
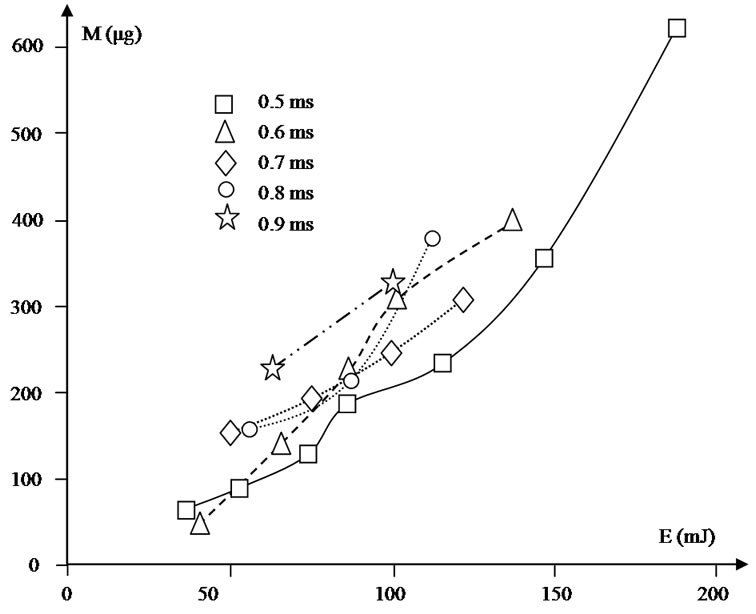
Figure 5. Mass of glass ejected, as a function of the incident energy, for different times of shooting.
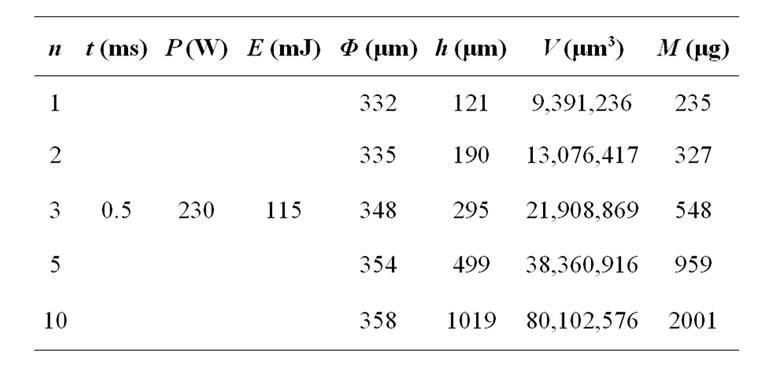
Table 3. Characteristics (diameter, depth, volume, ejected matter mass) of the cavities generated as a function of the number of shootings, for an interaction time of 0.5 ms, a laser power of 230 W and an incident energy of 115 mJ.
The multiplication of the number of shootings, with the same parameters laser, generates a linear increase depth of the generated cavity whereas its diameter remains almost constant (Figure 6). It should be noted that for these experimental conditions, the value limits depth of the generated cavity is reached starting from ten shootings.
The mass of glass ejected also increases, for the same experimental conditions, with the increase of the number of shootings (Figure 7).
5. Influence of Laser Parameters Studied in Depth and Diameter of the Cavities Generated
This study is conducted with the Taguchi method by means of “orthogonal array” experiments [14,15]. This method based on orthogonal array experiments gives much reduced variance for the experiment with optimum settings of control factors. The Taguchi approach provides also more complete interaction information than typical fractional factorial designs. In order to investigate the
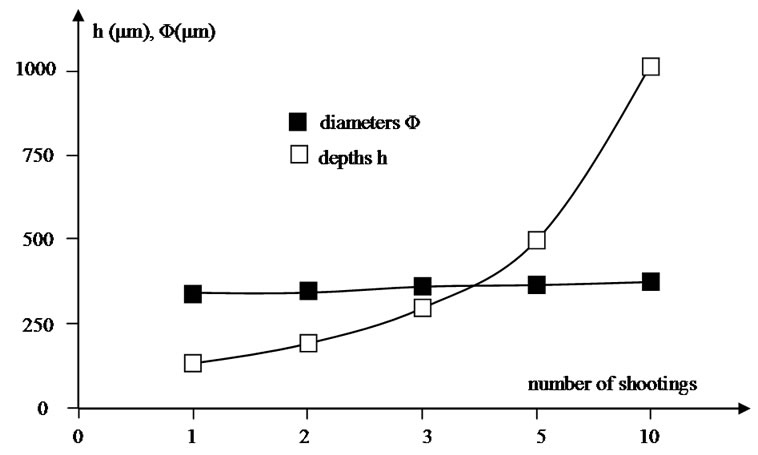
Figure 6. Measured depths and diameters of the cavities generated, as a function of the number of shootings, for an interaction time of 0.5 ms, a laser power of 230 W and an incident energy of 115 mJ.
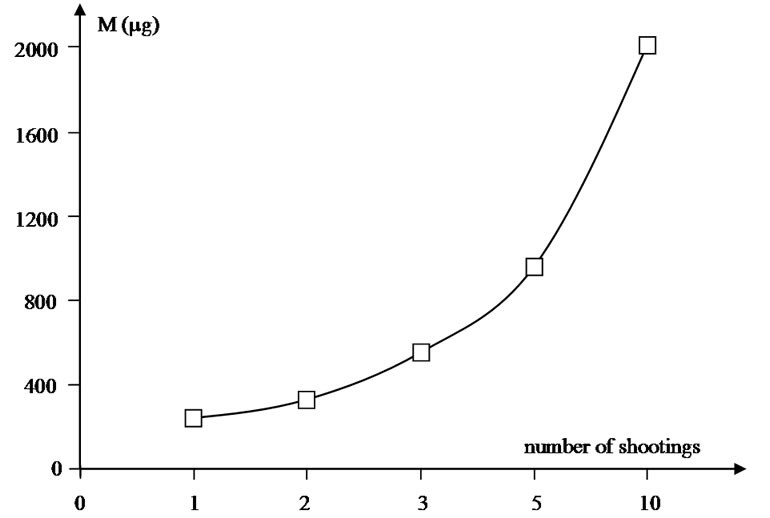
Figure 7. Mass of glass ejected, as a function of the number of shootings, for an interaction time of 0.5 ms, a laser power of 230 W and an incident energy of 115 mJ.
depth (h) and the diameter higher (∅) of the cavity, a suitable orthogonal array [L8(27)] was selected for carrying out the experimentation. Three factors are considered. Each of them has two levels: the number of shooting (level 1: 1 pulse, level 2: 5 pulses), the time of shooting (level 1: 0.6 ms, level 2: 1.4 ms) and the laser power (level 1: 60 W, level 2: 210 W). These factors and levels used in the orthogonal analysis and the 3 combinations of these 3 factors, arranged according to the 7 columns of the orthogonal array L8(27), are shown in Table 4. This method allows for the collection of the necessary data to determine which factors and interactions most affect the depth and the diameter higher of the cavity. The 8 various tests, according to the 8 lines of the orthogonal array L8(27) which corresponds to 23 factorial experiment design, were realised. Table 4 shows the experimental results obtained. An analysis of variance on the collected data from the Taguchi design of experiments can be used to identify significant factors and interactions between the factors.
Factor levels for each studied factor:
F1: number of shooting (level 1: 1 pulse, level 2: 5
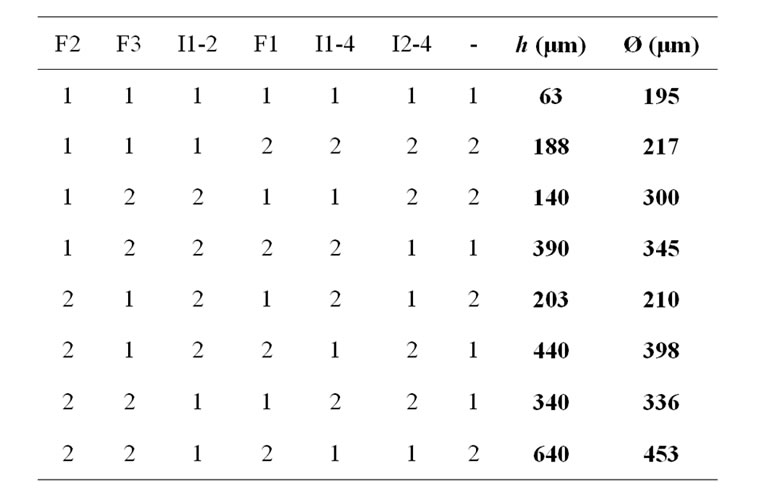
Table 4. Taguchi orthogonal array L8 (27) and linear graph associated.
pulses)
F2: time of shooting (level 1: 0.6 ms, level 2: 1.4 ms)
F3: laser power (level 1: 60 W, level 2: 210 W)
Combinations between factors:
Ix-y: interaction column between the two factors allocated to columns x and y
Experimental results:
h: depth of the cavity
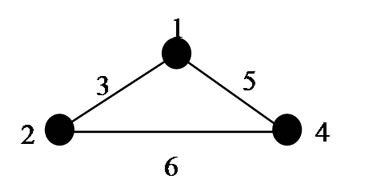
∅ diameter higher of the cavity The linear graph associated with the Taguchi orthogonal array L8(27) allows to affect the interactions (level 2) between the three studied factors. For example, it shows two points labeled 1 and 2, indicating that two factors can be assigned to columns 1 and 2 of the orthogonal array L8(27). The line 3 connecting them indicates that the interaction beetween columns 1 and 2 is present in column 3.
6. Results and Discussion
For the studied process to be optimized, three control factors which directly decide the value of the depth and of the diameter of the cavities generated are considered. The Taguchi method based on “orthogonal array” experiments gives much reduced variance for the experiment with “optimum settings” of control factors. The “orthogonal array” experiments help also in data analysis and prediction of optimum results. For that purpose, the following formulae will be considered.
The middle effect of factor A at the level i is:
EAi = (average of the responses R when the factor A is at the level i) – Ravg
with Ravg the general average of the responses Ri
The interaction effect of factor A at level i and factor B at level j is:
EAiBj = (average of responses R when factor A is at level i and B at level j) – EAi – EBj – Ravg
The total squares sum is:
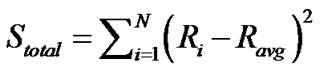
The squares sum of factor A is:
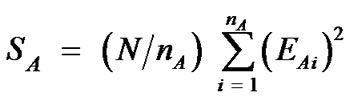
The squares sum of the interaction factor A and factor B is:

with N = 16 (number of tests), nA the number of factor A levels and nB the number of factor B levels.
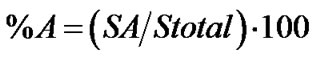
The percentage of contribution of factor A on the response is:
The percentage of contribution of the interaction factor A and factor B on the response is:
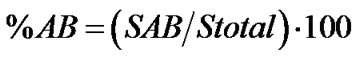
Figure 8 shows that the three studied factors have an influence on the depth of the cavity. Indeed, the level change of factors induces a variation of the value of this depth. The most significant factor influencing the depth of the cavity generated is the number of shooting (factor F1). On the other hand, the transition from a power of 60 W to 210 W induces the smallest variation of the depth.
If the effect of a factor is influenced by the level change of another factor, there is phenomenon of interaction between these two factors. Figure 9 shows that the effect of the 3 studied factors is not influenced by the level change of the other factors (parallel segments).
Figure 10 gives the influence of the three studied factors on the diameter of the cavity. The obtained results show that these factors have an influence on this depth.
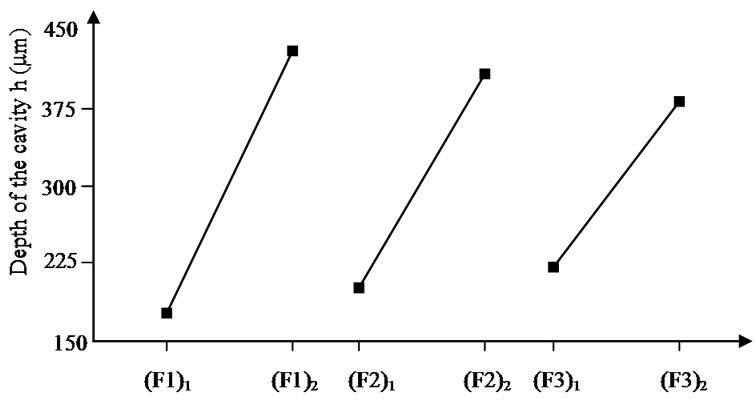
Figure 8. Influence of the studied factors on the depth of the cavity (h).
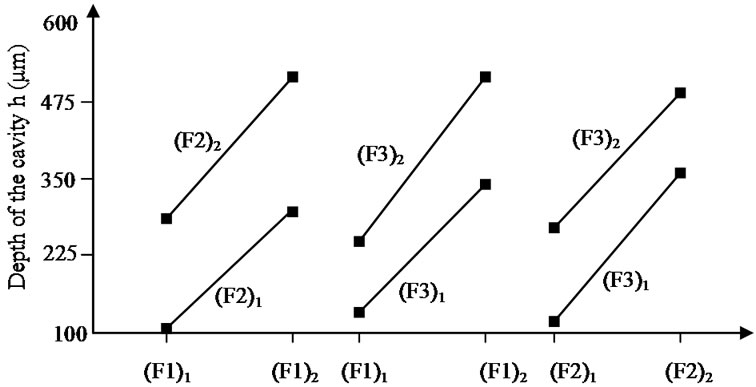
Figure 9. Influence of the studied factors interactions on the depth (h).
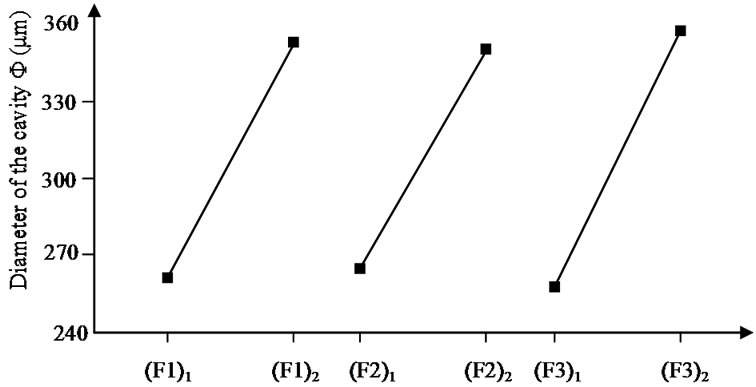
Figure 10. Influence of the studied factors on the diameter of the cavity (Φ).
Figure 11 shows that the effect of the number of shooting (F1) on the diameter of the cavity generated is influenced by the level change of the time of shooting (F2). Indeed, the two segments are not parallel.
An analysis of the variance allows determining the percentage of contribution of every significant factor and interaction on the depth and diameter of the generated cavities. These percentages of contribution of the three studied factors and of their interactions are shown in Table 5.
F1: number of shooting (level 1: 1 pulse, level 2: 5 pulses)
F2: time of shooting (level 1: 0.6 ms, level 2: 1.4 ms)
F3: laser power (level 1: 60 W, level 2: 210 W)
The percentages of contribution, on the depth (h) and diameter (Φ), reveal that the influence of the three studied factors is significant. On the other hand, these factors acting in interaction with another factor have not a signifycant influence, except the interaction (number of shooting/time of shooting) on the diameter (Φ), with a percentage of contribution on the diameter superior to 11%.
7. Conclusions
This experimental study investigated the glass marking with CO2 laser. The first part of this paper is about the calculation of the volumes of the cavities generated by the interaction laser-material. The volume of the cavities prediction model is established with the following
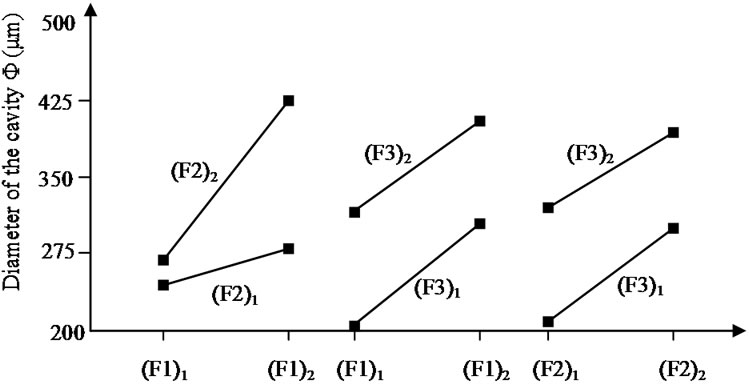
Figure 11. Influence of the studied factors interactions on the diameter of the cavity (Φ).

Table 5. Percentage of contribution of every factor and interaction on the depth (h) and diameter (Φ) of the generated cavities.
hypothesis: the cavities are considered as volumes of revolution with the higher part of their profiles considered as Gaussian, and the non Gaussian parts as linear.
In a second part, the influence of marking factors like interaction time laser-glass, laser power, shooting time and number of shootings on the micromarking precision are reported. With an aim of controlling the quality of marking, the influence of the laser factors as laser power, time of shooting and number of shooting were studied. An experimental design based on the Taguchi method has been applied to investigated the effects of these three factors and their interactions (level 2) on the depth, the diameter and the volume of the cavities carried out. An analysis of the variance confirms that the three studied factors have a significant influence on the depth, the diameter and consequently on the volume of the generated cavities. On the other hand, except the interaction number of shooting/time of shooting on the diameter, these factors acting in interaction with another factor have not a significant influence.
REFERENCES
- J. H. Abloud, K. Y. Benyounis, A. G. Obabi and M. S. J. Hashmi, “Laser Surface Treatments of Iron-Based Substrates for Automotive Application Original Research Article,” Journal of Materials Processing Technology, Vol. 182, No.1-3, 2007, pp. 427-431. doi:10.1016/j.jmatprotec.2006.08.026
- C. Y. Yeo, S. C. Tam, S. Jana and M. W. S. Lau, “A Technical Review of the Laser Drilling of Aerospace Materials,” Journal of Materials Processing Technology, Vol. 42, No. 1, 1994, pp. 15-49. doi:10.1016/0924-0136(94)90073-6
- O. Mende and D. Niggemeyer, “A Multifunctional Laser Linking and Cutting Structure for Microelectronic Circuits,” Applied Surface Science, Vol. 168, No. 1-4, 2000, pp. 280-283. doi:10.1016/S0169-4332(00)00624-3
- D. G. Waugh, J. Lawrence, C. D. Walton and R. B. Zakaria, “On the Effects of Using CO2 and F2 Lasers to Modify the Wettability of a Polymeric Biomaterial,” Optics & Laser Technology, Vol. 42, No. 2, 2010, pp. 347- 356. doi:10.1016/j.optlastec.2009.08.004
- Th. Dumont, T. Lippert, A. Wokaun and P. Leyvraz, “Laser Writing of 2D Data Matrices in Glass,” Thin Solid Films, Vol. 453-454, No. 1, 2004, pp. 42-45. doi:10.1016/j.tsf.2003.11.148
- Y. Md. Noor, S. C. Tam, L. E. N. Lim and S. Jana, “A Review of the Nd: YAG Laser Marking of Plastic and Ceramic IC Packages,” Journal of Materials Processing Technology, Vol. 42, No. 1, 1994, pp. 95-133.
- S. Iftekhar, J. Grins and M. Edén, “Composition—Property Relationships of the La2O3-Al2O3-SiO2 Glass System,” Journal of Non-Crystalline Solids, Vol. 356, No. 20-22, 2010, pp. 1043-1048. doi:10.1016/j.jnoncrysol.2010.01.017
- A. Nishara Begum, V. Rajendran and H. Ylänen, “Effect of Thermal Treatment on Physical Properties of Bioactive Glass,” Materials Chemistry and Physics, Vol. 96, No. 2-3, 2006, pp. 409-417. doi:10.1016/j.matchemphys.2005.07.031
- S. Shuttleworth, “Optimisation of Laser Wavelength in the Ablation Sampling of Glass Materials,” Applied Surface Science, Vol. 96-98, 1996, pp. 513-517. doi:10.1016/0169-4332(95)00505-6
- V. Kozhukharov, D. Dimitrov and D. Tonchev, “Interaction of CO2 Laser Radiation with Glasses,” Infrared Physics, Vol. 29, No. 2-4, 1989, pp. 415-422. doi:10.1016/0020-0891(89)90083-3
- J. F. Coutouly, P. Déprez, P. Vantomme and A. Deffontaine, “Simple Is Best for Real-Time Beam Analysis,” Optics & Laser Europe, Vol. 58, 1999, pp. 34-37.
- A. A. Tseng, Y. T. Chen, C.-L. Chao, K.-J. Ma and T. P. Chen, “Recent developments on Microablation of Glass Materials Using Excimer Lasers,” Optics and Lasers in Engineering, Vol. 45, No. 10, 2007, pp. 975-992. doi:10.1016/j.optlaseng.2007.04.003
- K. Yamamoto, N. Hasaka, H. Morita and E. Ohmura, “Influence of Glass Substrate Thickness in Laser Scribing of Glass,” Precision Engineering, Vol. 34, No. 1, 2010, pp. 55-61. doi:10.1016/j.precisioneng.2009.03.007
- M. S. Phadke, “Quality Engineering Using Design of Experiment, Quality Control, Robust Design and Taguchi Method,” Warsworth & Books, California, 1998.
- R. Ranjit, “Design of Experiment Using the Taguchi Approach,” John Wiley & Sons Inc., New York, 2001.