World Journal of Nuclear Science and Technology
Vol.2 No.1(2012), Article ID:16563,5 pages DOI:10.4236/wjnst.2012.21006
U and Th Determination in Natural Samples Using CR-39 and LR-115 Track Detectors
Department of Ionizing Radiation, National Institute for Standards, Giza, Egypt
Email: aelsersy@yahoo.com
Received June 17, 2011; revised August 29, 2011; accepted October 27, 2011
Keywords: U; Th; CR-39 and LR-115
ABSTRACT
In this work, a simple and accurate method for U and Th determination in natural samples is proposed. This method is based on simplified calculations of the efficiency factor of the solid state track detector using a thin source approach. Samples were firstly saluted using a concentrated H2SO4 acid and then distributed on a glassy slide where the thickness of the sample was about 7 µm. CR-39 and LR-115 track detectors were exposed to the thin layer of the natural samples for few days and then the track densities were obtained. By the mean of originated track densities in CR-39 and LR-115 as a function of exposure time and sample weight, the concentration of U and Th in Bq/kg were obtained by the thin source approach of SSNTD.
1. Introduction
Solid State Nuclear Track Detectors, SSNTD are widely used in different applications related to α-track registration [1-4]. One of the most applications is the U and Th determination in natural materials. Th in natural samples is usually more abundant than U by a factor of about 4, so it is necessary to calculate the ratio of Th/U in order to perform a quantitative analysis of uranium and thorium in natural samples [5,6] but this ratio is related to the geological structure of samples.
Different tools have been used for Th content as isotope dilation mass spectroscopy chromatography. Inductive coupled plasma mass spectrometry, neutron activetion analysis, α-spectrometry using SSNTD. The use of SSNTD has many advantages than the others due to the long term exposure property and the alpha track counting is performed without any electronic attachment.
Using SSNTDs, the general relation used for concentration determination of U or Th in CR-39 or LR-115 are given in Equations (1) through (4) [5].
 (1)
(1)
 (2)
(2)
where  and
and  are the registered track densities of U and Th, series respectively. CU and CTh are the concentrations of U and Th in the natural sample. kU and kTh are the α registration efficiency from U and Th series, respectively and so for LR-115 CU and CTh are:
 (3)
(3)
 (4)
(4)
Then the total track density of CR-39 is
 (5)
(5)
And for LR
 (6)
(6)
From Equations (5) and (6), the track density ratio of CR-39 to LR-115 is
 (7)
(7)
The efficiency factor for thick source is given by Equations (8) and (9):
 (8)
(8)
 (9)
(9)
where Ri and θci are the range and the critical angle of isotopes in U and Th series, respectively [7].
2. Method of Calculations
From Equations (8) and (9), both of α range (R) and the critical angle of etching (θc ) should be determined for efficiency calculation. For accurate calculation the α range from U and Th series, chemical analysis should be performed for the natural containing radioactive material. Also θc for 14 different alpha energies should be obtained, which sometimes very sophisticated.
In this work, a thin source approach was proposed, where the efficiency factor in Equations (8) and (9) could be written as for U and Th:
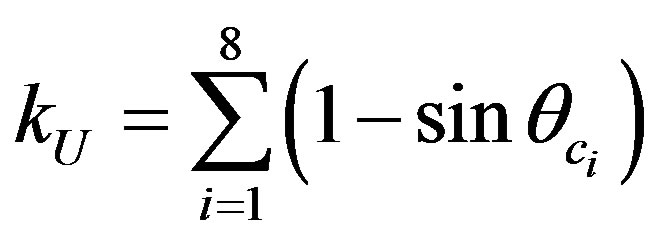 (10)
(10)
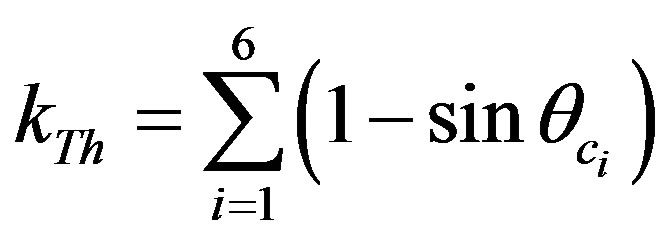 (11)
(11)
From Equations (10) and (11), one can notice that efficiency depends only on the critical angle θc which is easily known as a function of α energy [7].
Using the thin source technique, with CR-39 Equation (5) can be rewritten as:
 (12)
(12)
where kU thin and kTh thin can be calculated from Equations (10) and (11) which yield to the determination of CU + CTh. So other relations are needed to get both CU and CTh, which can be obtained from LR-115 data.
By considering Th series [9-10], one can notice that the series contains 6 alpha particle emitters with energies higher than 4.5 (window of LR-115 detector [8]) only 232Th has α energy of value 4.08 MeV [9,10]. So when thin layer of sample is used with LR-115 it will only register the 4 α from U-series with energy smaller than 4.5 MeV, then
 (13)
(13)
From Equations (12) and (13) both of CU and CTh are easily obtained.
3. Experimental
Natural samples are collected from Oil fields at the beach of the Meditraian Sea near Domiat and Kafer El-Skeekh north east of Cairo, Egypt. Samples were grinded to very small grain size. A very small mass of each sample was added to concentrated solution of H2SO4 acid. The resulted solution was distributed on a glass slide where the thickness of the sample on the slide is in the range of 7 μm.
CR-39 and LR-115 detectors were exposed, in closed contact, to the samples for few days. Detectors were collected and etched at the optimum etching conditions. Track density originated in CR-39 and LR-115 was counted using an image analyzer model ELBEK SAMICA, Germany.
4. Results and Discussion
Colleted samples were coded with numbers from 1 to 10 and about 300 mg of sample was used and distributed on a glassy slide. The originated tracks (cm–2·g–1·sec–1) in CR- 39 and LR-115 within 15 day exposure were counted and illustrated in Figure 1.
From the track densities in CR-39 and LR-115, two methods of calculation were used. These methods were method 1 where the contribution of track density in LR-115 from Th is neglected and Method 2 where track density from Th in LR is considered.
4.1. First Method
Values of alpha energies in U and Th series are given in references 9 and 10.
In this approximation neglecting the contribution in track density from Th series in LR-115, the U activity concentration can be determined from Equation (13) and represented in Figure 2.
From the obtained U concentration, and by substituting in Equation (12), the Th concentration is obtained and illustrated in Figure 3.
4.2. Second Method
In this method, all alpha energies closed to 4.5 MeV or below are considered in LR-115 registration from both U and Th series. In this method Equation (13) can be written as:
 (14)
(14)
The obtained U concentration from this method is

Figure 1. Originated track density in CR-39 and LR-115 exposed to natural samples.

Figure 2. Activity concentration of U (Bq/kg) calculated from Equation (13).

Figure 3. Th activity concentration (Bq/kg) for the studied samples.
illustrated in Figure 4.
The Th concentration is calculated from Equations (13) and (14) using the values of CU and represented in Figure 5.
To cheek the variation between these two methods, a comparison between U concentrations calculated from the two approximations is represented in Figure 6. From Figure 6, one can notice that, the U concentration calculated by Method 1 is slightly grater that obtained from Method 2.
By the same procedure a comparison between Th concentrations calculated by the two methods is represented in Figure 7 where nearly same value of Th concentration is noticed.
From Figures 6 and 7, one can notice that, there is a good agreement between theses two methods of U and Th calculations where a correlation factor of 86% and 89% for U and Th, respectively. Also one can use Method 1 as an easy method for U and Th calculation using SSNTDs with reasonable accuracy.
To assure the U and Th concentrations obtained from this study, one has two directions. The first one is the confirmation of the results by other technique used for U and

Figure 4. Activity concentration of U (Bq/kg) calculated by Method 2.
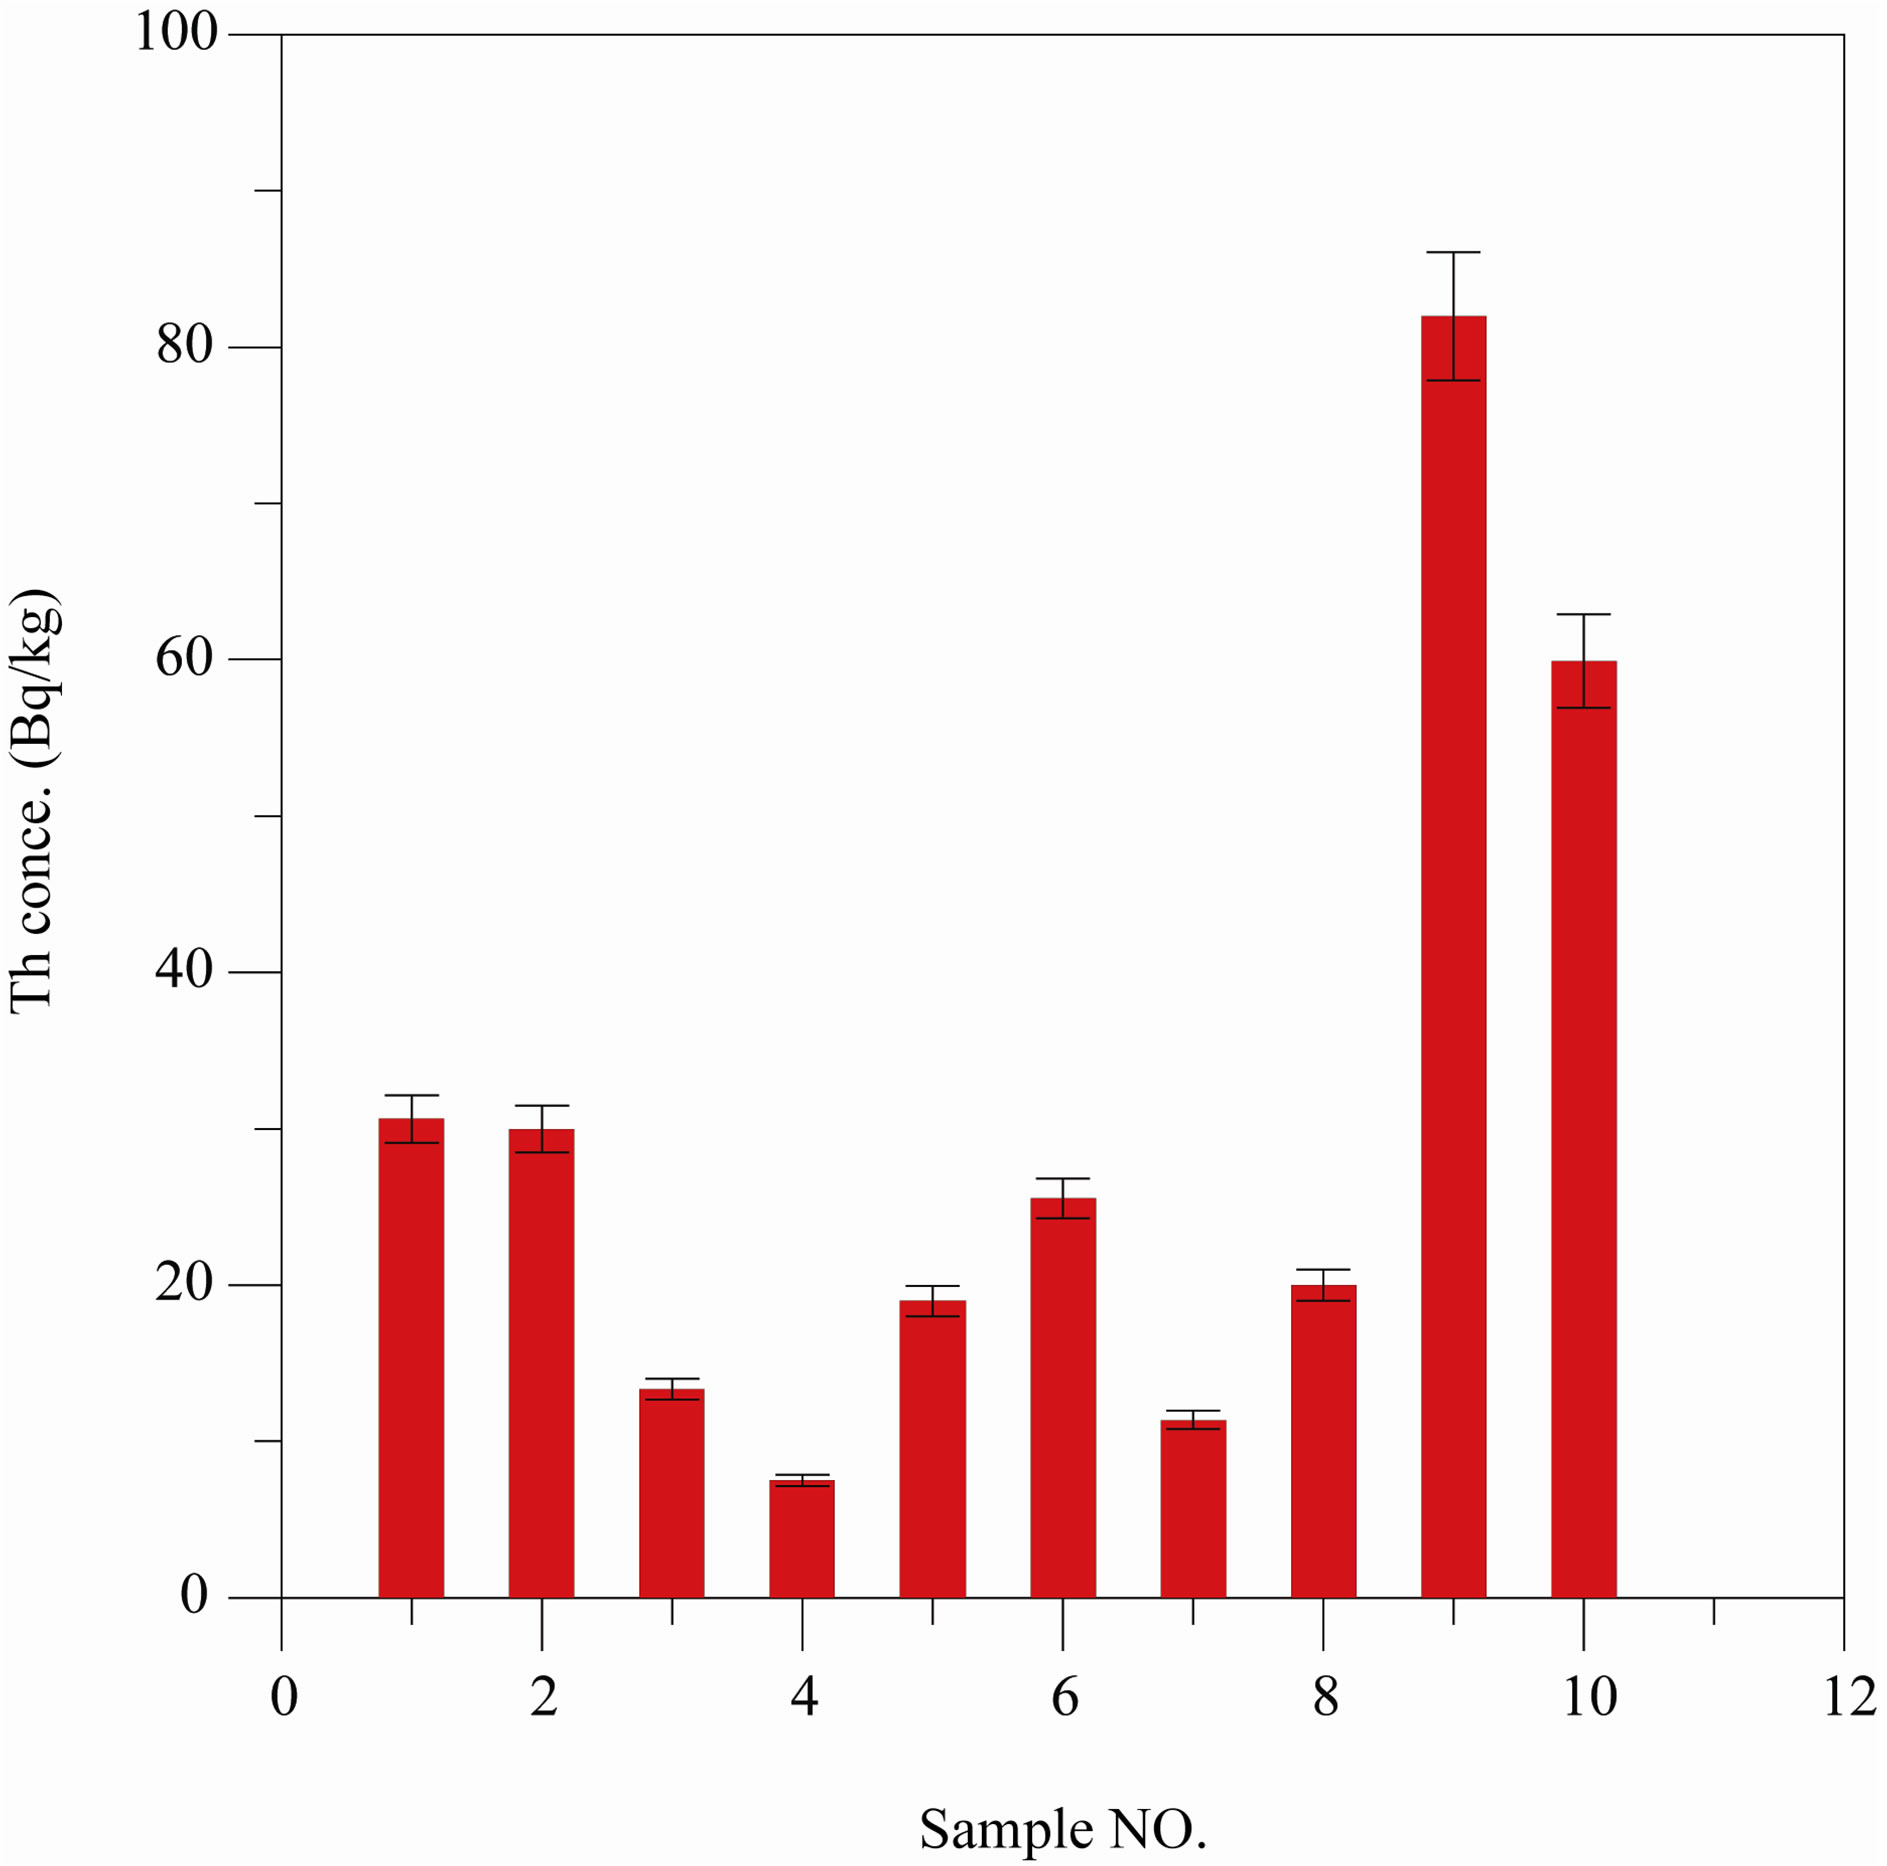
Figure 5. Th activity concentration (Bq/kg) calculated by method 2.

Figure 6. Comparison between U concentrations as calculated by the two methods.

Figure 7. Comparison between Th concentrations as calculated by the two methods.
Th detection. Three samples were selected and then the content U and Th were measured by gamma spectroscopic technique calibrated by a standard multi-radionuclide source traceable to the National Institute for Standard and Technology (NIST) at USA. The obtained correlation coefficient is 87% and 84% for U and Th concentrations that reflects a good agreement between the two techniques.
The second direction of confirmation is the comparison of the obtained data with that published in the literature. The world average of U and Th concentrations as re-
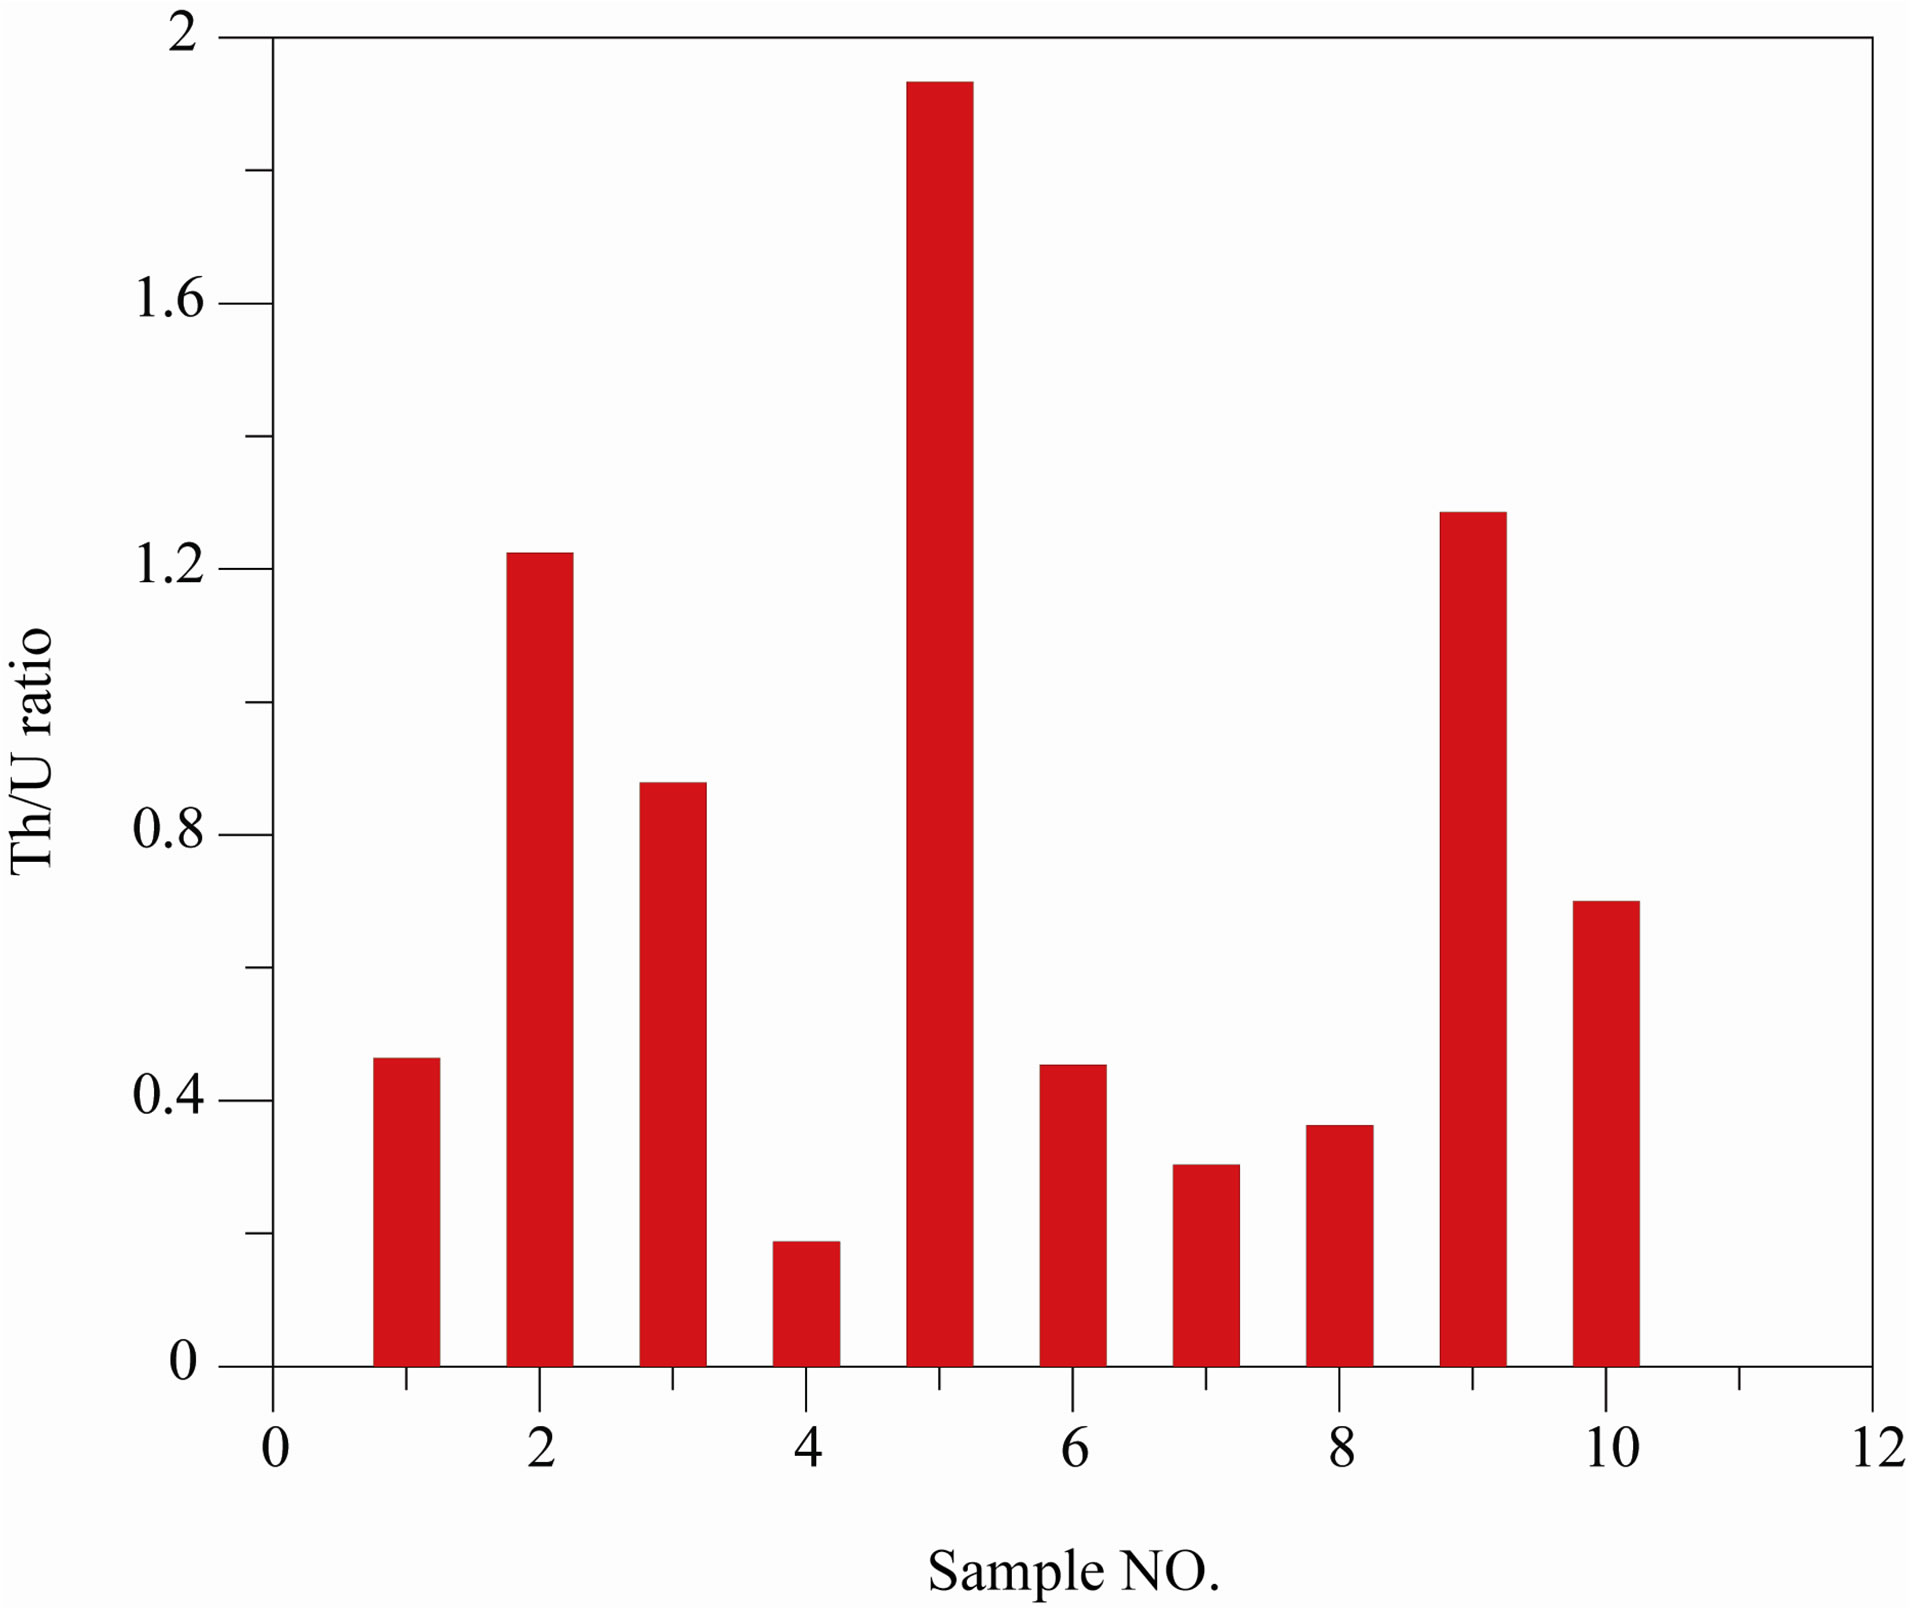
Figure 8. Values of Th/U ratio for the studied samples.
ported in the UNSCEAR, 1988 [11] is 25 Bq/kg. The average U and Th concentrations in the studied samples as obtained from Method 2 are 46.38 and 31.02 Bq/kg, respectively. From this data, one can notice that the obtained results are in the same order of that obtained in the UNSEAR and El-Daly et al., 2008 [12].
Ratio of Th/U is calculated and represented in Figure 8 where the average ratio for all samples is 0.80 with stander deviation of 0.55. The variation of this ratio may be attributed to the collection of the studied samples was from one zone and different depth that reflected the difference of the geological stricture for each depth.
5. Conclusion
From this work, one can conclude that, SSNTDs can be used for U and Th determination in natural samples. The suggested thin source used is applicable for U and Th determination without sophisticated calculations. Also, the first approximation is accurate and easy for U and Th determination. The correlation between the two methods of calculations is 88% and 86% for U and Th values that reflected the applicability of method one. Also the obtained U and Th concentrations were in a good agreement with the gamma spectroscopic technique.
REFERENCES
- T. EL-Zakla, H. A. Abdel-Ghny and A. M. Hassan, “Natural Radioactivity of Some Local Fertilizers,” Romanian Journal of Physics, Vol. 52, No. 5-7, 2007, p. 731.
- H. Florou, K. Kehagia, C. H. Chaloulou, V. Koukouliou and C. H. Lykomitrou, “Determination of Radionuclide in Mystiques Galloprovicialis by Alpha and Gamma-Spectroscopy,” Mediterranean Marine Science, Vol. 5, No. 1, 2004, p. 117.
- C. A. Simion, C. Cimpeanu, C. Barna and E. Duta, “The Uranium Determination in Commercial Iodine Salt,” Romanian Journal of Physics, Vol. 51, No. 7-8, 2006, p. 845.
- N. W. El-Dine, A. El-Shershaby, F. Ahmed and A. S. Abdel-Haleem, “Measurement of Radioactivity and Radon Exhalation Rate in Different Kinds of Marbles and Granites,” Applied Radiation and Isotopes, Vol. 55, 2001, p. 853. doi:10.1016/S0969-8043(01)00107-5
- T. A. Salama, U. Seddik, T. M. Dsoky, A. Morsy and R. Asser, “The Influence of the Nature of Soil and Plant and Pollution on the 238U, 232Th, 222Rn and 220Rn Concentrations in Various Natural Honey Samples Using Nuclear Track Detectors: Impact on the Adult Consumers,” Indian Academy of Sciences, Vol. 62, No. 2, 2006, p. 269.
- H. Surbeck, “Alpha Spectrometry Sample Preparation Using Selectively Adsorbing Thin Films,” ICRM Conference on Low Level Radioactivity Measurement Techniques, Mol, Belgium, 18-22 October, 1999, pp. 97-100.
- M. M. El-Hawary, M. M. Mansy, A. Hussein, A. A. Ammar and A. R. El-Sersy, “Construction of a Charged Particle Irradiation Chamber for the Use with Plastic Detectors,” Radiation Physics and Chemistry, Vol. 54, 1999, p. 547. doi:10.1016/S0969-806X(98)00292-8
- H. El-Samman, M. Mansy, A. Hussein, M. El-Hawary and A. R. El Sersy, “Registration Efficiency of Some SSNTDs with Source Area Included,” Nuclear Instruments and Methods in Physics Research Section B, Vol. 155, 1999, p. 426. doi:10.1016/S0168-583X(99)00485-1
- “Uranium Series ICRP 68 Dose Coefficients for Workers,” 2003. http://www.wise-uranium.org/rdfi68.html
- National Service Center for Environmental Publications (NSCEP), 2007. http://www.epa.gov/radiation/heast/docs/heast2
- UNSCEAR (United Nations Scientific Committee on the Effects of Atomic Radiation), “Sources Effects and Risks of Ionizing Radiation,” Report to the General Assembly, With Annexes, United Nations, New York, 1988.
- T. A. El-Daly and A. S. Hussein, “Natural Radioactivity Level in Environmental Samples in North Western Desert of Egypt,” Proceedings of the 3rd Environmental Physics Conference, Aswan, Egypt, 19-23 February 2008, pp. 79- 88.