American Journal of Molecular Biology
Vol. 2 No. 4 (2012) , Article ID: 23989 , 8 pages DOI:10.4236/ajmb.2012.24036
Mutated elements of a complex promoter (Amh) can help to demonstrate the role of certain elements in controlling differential gene expression
![]()
The Ashworth Laboratory, The University of Edinburgh, Edinburgh, UK
Email: david.dresser@btinternet.com
Received 15 May 2012; revised 26 June 2012; accepted 19 July 2012
Keywords: Anti-Mullerian Hormone; SDM; Site Directed Mutation; Murine; SMAT-1; TM4; Sertoli Cell Lines; KK1; Granulosa Cell Line
ABSTRACT
Amh is a single copy gene which is expressed in different ways during mammalian development. Several potential promoter elements have been identified using physiological experimentation and on the basis of interspecific sequence comparison. The role of putative promoter elements in controlling gene expression has been investigated by many workers over the last two decades and here by individually mutating each element. Expression was measured in vitro in cells of Sertoli descent by flowcytometry using EGFP as a reporter gene. Three lines of murine cells were used; preand post-pubertal Sertoli and granulosa cells. Differences between the three lines of cells, support the view that differentiation in this in vitro model system is likely to be at the level of available transcription factors at given points in development.
1. INTRODUCTION
The level of expression of a gene involved in differentiation may vary with time and place. For example, in male mammals the gene for anti-Mullerian hormone (Amh; a member of the TGFbeta family) is expressed in the testis by Sertoli cells at high levels for a short while at the start of sexual differentiation; at lower levels up to the time of puberty; and at very low levels thereafter. In contrast in the ovary, granulosa cells which are derived from the same early stem cell stock as Sertoli cells, express Amh at a relatively low level from the time of puberty until the end of reproductive life.
In general a promoter consists of an ordered series of elements, each element specifically bound by a transcription factor (tf): each tf being eventually a constituent part of a functional spliceosome. The promoter can therefore be seen as a specific assembly template. With a complex promoter such as Amh, the ensuing level of gene expression is therefore likely to depend on the mix of tfs available at a given point in the differentiation pathway.
The role of individual elements of the mouse Amh promoter has been tested by mutating individual elements and using the modified promoters to drive the expression of a reporter gene (d2EGFP), measuring the level of expression by flowcytometry in cells of established lines derived from different points in the sexual differentiation pathway (see Appendix Figure A1).
More specifically, in embryonic male mice there is a strong peak in Amh expression at 12 - 13 days post conception which decreases to a lower level and finally to exceedingly low levels at puberty [1-3]. The termination of Amh expression in the testis coincides with the appearance of the transcription factor GATA-1 [4]: it seems possible that there is a causal relationship between these events. In females, granulosa cells start to express Amh at a modest level, from about the time of puberty [5] until the end of active reproductive life. Appendix Figure A1 illustrates where the lines of cells used here fit into the general scheme of sexual development in mice: each line adapted for growth in vitro but retaining properties of the originating stage of development [6-8]. In this study each of the eleven potential promoter elements has been individually mutated and the consequences for EGFP (as a surrogate for Amh) expression was measured. A reduction in expression shown by some promoters with a particular mutation, indicates that some elements play a significantly positive role in promoting EGFP expression in one line of cells but not necessarily in another and vice versa with the ablation of other element(s). However there is one element in particular (proxGata) which may plays a negative (repressive) role, since mutation leads to a significant increase in the expression index in all lines of cells tested. It is concluded that the Amh promoter has a wide range of possible levels and places of response when driving Amh expression in vivo.
The evidence obtained from in vitro experiments using the reporter gene d2EGFP supports the generally held view that differentiation largely depends on the availability of appropriate transcription factors.
2. MATERIALS AND METHODS
Cells were grown adherent to standard tissue culture plastic-ware, in DMEM-F12 medium and glutamax with 10% foetal calf serum (FCS) with penicillin and streptomycin [9]. The AGM (aorta, gonad and mesonephros stem) cells were grown in the same medium but with 20% FCS and on plastic-ware which had been pretreated with gelatin [10]: about a third of the medium was preconditioned by 48 hours culture of AGM cells but with the exception specified in the legend to Figure 3. Expression assays were based on triplicate or quadruplicate cultures in Costar 24-well plates (1 − 3 × 10⁵ cells/well). This technique and the amounts of DNA used for transfection, together with details of the later flow cytometric analysis of EGFP expression and the maintenance of the cell lines, have been described previously [9]: the conditions for KK1 and AGM were as described previposly for SMAT.
An index of EGFP (green) fluorescence was measured using a flowcytometer monitoring red (texas red) and green (fluorescein) channels. This enables autofluorescence to be defined accurately to allow a window of EGFP specific fluorescence to be defined (see Appendix Figure A2). The index is the product of the number of cells in the green window expressed as a percentage of total live cells and their geometric mean brightness (I = % xGm). The index for cells transfected with control DNA or not transfected, was <1000 for SMAT cells.
Site directed mutagenesis (SDM), by double overlapping extension PCR [11,12] was used to change the nucleotide sequence of putative promoter elements. Overlapping forward and reverse oligo-nucleotide primers were prepared containing the desired mutated sequence (4 - 8 nt) nested in 5’ and 3’ non-mutated arms, each arm with an estimated Tm of 55˚ - 65˚. For the PCR the following ingredients were mixed at 0˚; 39 ml distilled water; 5 ml thermopol buffer (NEB); 1 ml of 100 mM MgSO4; 1 ml dNTP (containing 25 nMol of each); 1 ml of each oligo at 100 pMol/ml; 1 ml Deep Vent polymerase (NEB); and 1 ml (1 - 5 ng) of plasmid DNA template (d2EGFP; 2 hr intra cellular half-life; Invitrogen), containing an Amh promoter sequence immediately 5’ of the EGFP gene (see Figure 1). The PCR program was 94˚ for 2 min 30 sec followed by 12 to 17 cycles of 94˚ for 1 min; 60˚ for 1 min; 75˚ for 2 min per Kb template and finally 4˚ for up to 18 hrs. Methylated template DNA, synthesised in DH10B bacteria, was destroyed by 2 hrs digestion at 37˚ with DpnI. All mutated constructs were identified and verified by DNA sequencing.
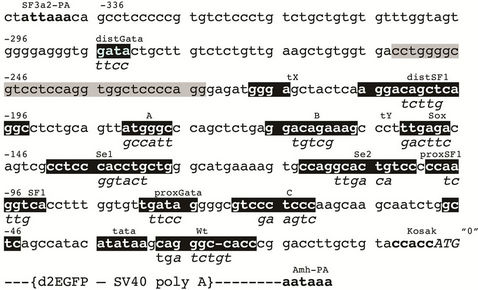
Figure 1. Nucleotide sequence (5’®3’) of a mouse Amh promoter region. SF3a2-PA is the polyadenylation signal of an upstream gene coding for a spliceosome component [13]. Potential promoter elements, are identified, by sequence similarity, with human, rat and other Amh promoter sequences [9]. The order of elements is conserved. These elements are highlighted in black and identified by superscript titles, with mutated sequences indicated as subscripts. The grey highlighted sequence is an inverted repeat. Where possible elements are identified by titles which are defined by their affinity for known transcription factors. The elements listed from 5’ to 3’ are as follows; distGata (distal to start of transcription); distSF1 (steroidogenic factor-1, Ad4Bp1); sites A and B; Sox (Sox 8/9); Se1 and Se2; proxSF1 (proximal); proxGata; site C; and Wt (Wilms tumour factor 1). Sites Se1 and Se2 were identified on the basis of a comparison with a putative promoter region of a Sertoli specific tumour [23]. Transcription factors for sites A, B, C, Se1 and Se2 are unknown. “0” = position 8647 in GenBank genomic nucleotide sequence X83733.
3. RESULTS
In Figure 2 the EGFP expression responses, driven by an unmodified Amh promoter and a minimal Tk (thymidine kinase) promoter, are compared in seven different lines of mouse cells. The results show that the overall responses in the AGM (aorta, gonad and mesonephros stem cells), TM4 (post-pubertal Sertoli) and 3T3 (fibroblast) cells, were weak, while that shown by SMAT cells (prepubertal Sertoli) was significantly stronger: in addition, in the SMAT cells, the Amh driven response, expressed as a percentage of the response driven by the Tk promoter, was very much greater. This data and data not included but mentioned in the legend to Figure 2, make it clear that AGM are ineffective in supporting Amh promoter driven expression. Figure 3 confirms that the Amh/Tk ratio for AGM8 cells is not altered by using SMAT cell conditioned medium rather than AGM8 conditioned medium, although the overall growth of the cells in the SMAT conditioned medium is slightly greater.
EGFP expression responses driven by variously modified Amh promoters in SMAT cells, are illustrated in Figure 4. For example, removal of the first 114 nt (–336 to –222; see Figure 1, leaving abbreviated promoter (tXWt; “trunc X”), do not have an effect on the response.

Figure 2. EGFP expression in 7 different cell lines. The response driven by a minimal thymidine kinase (Tk) promoter is compared with the response driven by an unmodified mouse Amh promoter, which for each cell is expressed as a percentage of the control Tk response; for example this is 0.3% for 3T3 cells. In other experiments AGM 3 - 6 gave responses within the range indicated here for AGM 1, 2, 7 and 8. KK1 cells gave a response similar to the 3T3 response depicted here. Mean and SEM for each group. Title/10 indicates that the value shown for this column has been reduced ten fold.

Figure 3. This figure extends the results shown in Figure 2. AGM8 cells grown in AGM8 conditioned medium were compared with AGM8 cells grown in SMAT cell conditioned medium (SCM): these EGFP expression responses are compared.
However removal of the first 179 nt (tY-Wt; trunc Y) resulted in a profound reduction in responsiveness, implying that a 65 nt stretch in the middle of the region designated the “Amh promoter” may play a crucial role in the action of the promoter. This critical stretch includes the potential elements distGata; distSF1; site A and site B: these elements have been mutated individually but not yet in combination. Figure 4 (and Appendix Figure A2) also show that in SMAT cells, responses driven by five modified Amh promoters with mutated elements Sox and Se1 led to a reduction in expression, whereas mutated proxGata led to an increase in response. There was no effect with mutated site B or Se2.
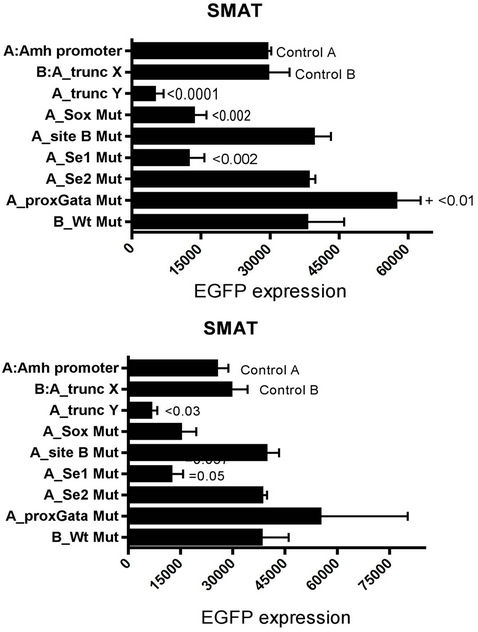
Figure 4. EGFP expression responses driven by modified Amh promoters in SMAT cells. Two experiments, the lower graph depicts a repeat, several months later, of the experiment illustrated in the upper part of the figure. “Amh promoter” is the full length from the SF3a2 polyadenylation signal (see Figure 1; –336) to the start of translation (0). “Trunc X” is a truncated promoter running from –222 (tX) to 0, which excludes distGata and had no significant effect on the expression of the reporter gene. “Trunc Y” runs from –157 (tY) to 0 and excludes potential elements distGata, distSF1 and sites A and B and results in a profound reduction in reporter gene expression. Responses driven by five promoters with specified mutated elements are included. Mutation of both Se1 and Se2 showed the same level of suppression achieved by Se1 alone. Significant differences with the control response driven by an unmodified Amh promoter, are indicated by p values from a Mann Witney twotailed t test: this is possibly an over stringent test in the context of these experiments. A similar experiment is illustrated in Appendix Figure A2.
In Figure 5 a limited range of responses to Amh promoters with mutated elements is compared between TM4 (post-pubertal) Sertoli cells and the equivalent response in SMAT (pre-pubertal Sertoli) cells. The values on the X-axes indicate that the overall level of response is much greater in SMAT cells, however in relative terms there are differences between TM4 and SMAT in their responses to mutated Amh promoters. Mutated distal and proximal SF1 elements led to a reduced response in SMAT but not in TM4. However mutated proxGata leads to a significant increase in response in both cell lines.
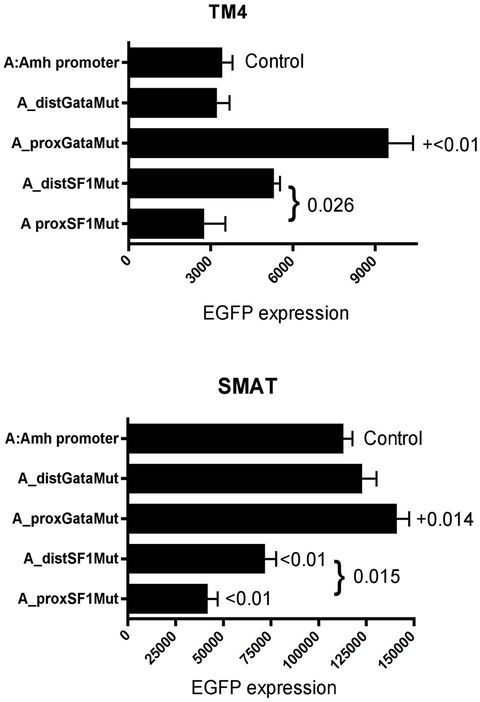
Figure 5. EGFP expression in TM4 (post-pubertal Sertoli) and SMAT (pre-pubertal Sertoli) cells. Comparison based on responses driven by a narrow range of mutated Amh promoters. Significant differences are indicated by p values. In several other experiments, using SMAT cells, the response from distSF1 mutated promoters were variable, ranging from suppression (p < 0.01) to no effect.
A more detailed comparison between KK1 (granulosa), TM4 and SMAT cells is shown in Figure 6, each of the eleven potential elements has been separately mutated. In this experiment mutated distSF1; site B; and Se1 elements led to a reduced response in KK1 cells, whereas Se1 and proxSF1 had a similar effect in SMAT cells. There was no significant reduction in response in TM4 cells, although mutated proxGata resulted in increased responsiveness in all cells.
In Figure 7 the array of “mutation” responses is compared again, this time just between KK1 and SMAT. While there are both similarities and possibly some differences with the results in Figure 6.
In SMAT cells mutation of proxSF1 and Se1 always leads to suppression of EGFP expression, while mutation of Sox, site B and distSF1 usually does so. Mutation of Site A, Se2, site C and Wt never cause any reduced expression in this in vitro system.
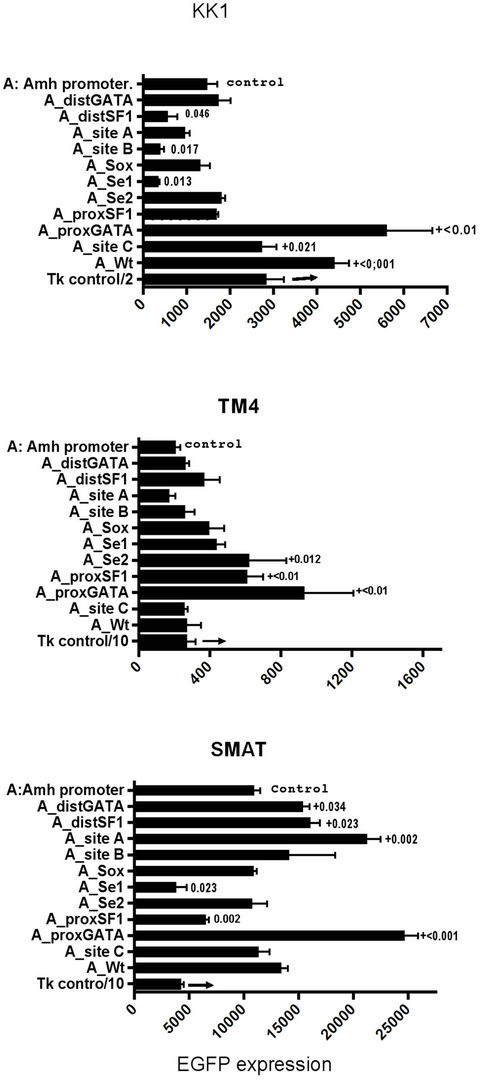
Figure 6. A comparison of the pattern of EGFP expression driven by a range of mutated Amh promoters in three lines of mouse cells. While the absolute level of responsiveness varies from high in SMAT to low in TM4, internal controls in each array allow for comparisons to be made. The statistical values from triplicate cultures are p from two tailed t tests with the controls (6 control cultures). The control was an unmutated Amh promoter. Significant reduction in EGFP expression is indicated by appropriate p values: those prefixed by + are significantly greater than the controls. Mutation of the proxGata element results in an increase in EGFP expression, which is seen in all three cell lines.
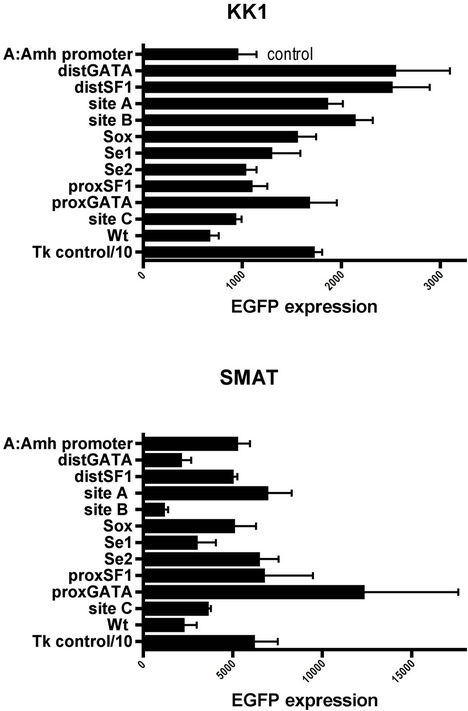
Figure 7. Arrays of expression responses driven by eleven differently mutated Amh promoters. The responses of SMAT (pre-pubertal Sertoli) and KK1 (granulosa) cells are compared. In SMAT cells three double mutations showed no additive suppression to that manifested by one partner alone. The pairs were Sox + proxSF1, Se1 + Se2 (see Figure 4) and distSF1 + proxSF1. Never-the-less truncation Y of the Amh promoter (tY to Wt in Figure 1), strongly suggests that a combinatorial effect may be crucial between elements upstream of tY.
4. DISCUSSION
4.1 It is assumed that the transcription factor (tf) specific sites (elements) of a promoter serve as a template for the ordered assembly of the functional components of the transcription mechanism (spliceosome?). This implies that to a great extent, specific control is at the level of tf availability at a given point in a differentiation process.
4.2 EGFP expression was measured by flow cytometry in cells transiently transfected, using LipofectAmine 2000 (Invitrogen), 48 hours previously with circular plasmid DNA constructs containing a d2EGFP gene driven by Amh promoters, some of which had been modified by specifically mutated elements (Figure 1). The efficiency of transfection is dependent on cell density, as outlined in the manufacturer’s instructions, and is a factor which is difficult to control: this may lead to a degree of dayto-day variation in the level of expression.
The pattern of EGFP expression responses, driven by an array of modified Amh promoters in which each of the eleven potential elements have been mutated, can be compared with each other and with the non-mutated control promoter and in addition with a third party control thymidine kinase (Tk) promoter. There are also comparisons between the 3 lines of cells used here. The array of responses were assayed in SMAT (pre-pubertal Sertoli), TM4 (post-pubertal Sertoli) and KK1 (granulosa) cells. Differences in transfectability require some form of normalisation for comparisons to be made between the different cell lines and Figure 6 illustrates such a comparison, where a representative sample of experiments is illustrated. It can be seen that the responsiveness of SMAT cells, to all transfected DNA constructs, is much greater than in TM4 cells: the level in KK1 cells is intermediate.
Mutation of proxSF1 results in a significantly reduced expression in SMAT but not in KK1 cells, while the opposite is true with a mutated site B. In relative terms there is no significant reduction in EGFP expression in TM4 cells due to mutation of any element.
4.3 In some cases, mutation of a potential element leads to an increase in EGFP expression. For instance, mutation of the proxGata site, situated close to the start of transcription [13], led to an increased expression in all three cell lines: this is possibly compatible with the observation that the termination of most of Amh expression in males coincides with the start of GATA-1 expression [4]: however it must be borne in mind that there is a possibility of internecine competition between members of the Gata family. GATA-1 could be functionally inert blocking access of active members of the family to the proxGata element: Gata-4 is known to play a positive role in granulosa cells [7,21].
Several elements named in Figure 1 have been identified and their potential role in Amh expression, either alone or in combination, have been demonstrated by several workers [14-18]. Koopman and co-workers [19] have shown that the Sox genes 8 and/or 9 product(s) and the SF1 gene product play a key role after binding to their respective elements. Similarly Arango et al. [20] showed that by simultaneously mutating the Sox and proxSF1 elements, it was possible to conclude that the Sox element binding tf plays a role in initiating Amh expression, while the proxSF1 binding tf is involved in quantitative control.
4.4 The results reported here are compatible with the view that Amh has a single multi-functional promoter. Alteration of individual transcription factor binding elements suggests that Sox, SF1 and Se1, play a significant role in controling EGFP (Amh) expression in prepubertal Sertoli cells, confirming in part the work of others [14-20].
The results presented in Figure 4 (and appendix Figure A2) indicate that ablation of the first 179 nt of the Amh promoter (Figure 1; trunc Y) results in a profound reduction in EGFP expression. This stretch of the promoter includes distGata, distSF1, site A and site B. The nature of cooperation between two or more of these elements has not been resolved. Figure 4 also illustrates another important point: there is “day-to-day” variation in absolute levels of expression in vitro. This may be due to differences in cellular contiguity or physiology at the time of transfection and small differences in setting up the windows for the estimation of the response imdex by flowcytometric analysis [see Appendix Figure A2]. Consequently absolute comparisons are restricted to experiments made with a single batch of cells and a single batch of flow cytometric analyses.
5. ACKNOWLEDGEMENTS
I thank Drs. N. di Clemente and J.-Y. Picard (INSERM, Unité 493, Université Paris XI) for providing the SMAT-1 cell line; Drs. Elaine Dzierzak (Rotterdam) and 0Alexander Medvinsky (ISCR, University of Edinburgh) for the AGM cell lines; Professor I. Huhtaneimi (Imperial College, London) for the KK1 cells; Dr. Martin Waterfall for help with flow cytometry; and Professor Rick Maizels and his colleagues for the hospitality of the lab.
REFERENCES
- Josso, N., Picard, J.Y., Rey, R. and di Clemente, N. (2006) Testicular anti-Mullerian hormone: History, genetics, regulation and clinical applications. Pediatric Endocrinology Reviews, 3, 347-358.
- Munsterberg, A. and Lovell-Badge, R. (1991) Expression of the mouse anti-mullerian hormone gene suggests a role in both male and female sexual differentiation. Development, 113, 613-624.
- Hacker, A., Capel, B., Goodfellow, P. and Lovell-Badge, R. (1995) Expression of Sry, the mouse sex determining gene. Development, 121, 1603-1614.
- Beau, C., Rauch, M., Joulin, V., Jegou, B. and Guerrier, D. (2000) GATA-1 is a potential repressor of anti-mullerian hormone expression during the establishment of puberty in the mouse. Molecular Reproduction and Development, 56, 124-138. doi:10.1002/(SICI)1098-2795(200006)56:2<124::AID-MRD2>3.0.CO;2-J
- Durlinger, A.L., Visser, J.A. and Themmen, A.P. (2002) Regulation of ovarian function: the role of anti-Mullerian hormone. Reproduction, 124, 601-609. doi:10.1530/rep.0.1240601
- Havelock, J.C., Rainey, W.E. and Carr, B.R. (2004) Ovarian granulosa cell lines. Molecular and Cellular Endocrinology, 228, 67-78. doi:10.1016/j.mce.2004.04.018
- Anttonen, M., Ketola, I., Parvianen, H., Pusa, A.-K., Heikinheimo, M. (2003) FOG-2 and GATA-4-4 are expressed in the mouse ovary and can modulate Mullerian-inhibiting substance expression. Biology of Reproduction, 68, 1333-1340.
- Belville, C., Jamin, S.P., Picard, J.Y., Josso, N. and di Clemente, N. (2005) Role of type I receptors for antiMullerian hormone in the SMAT-1 Sertoli cell line. Oncogene, 24, 4984-4992. doi:10.1038/sj.onc.1208686
- Dresser, D.W. and Guerrier, D. (2005) Candidate Sertoli cell specific promoter element for a TGFbeta family member (Amh) and a 3’ UTR enhancer/repressor for the same gene. Gene, 363, 159-165. doi:10.1016/j.gene.2005.08.004
- Medvinsky, A.L., Samoylina, N.L., Muller, A.M. and Dzierzak, E.A. (1993) An early pre-liver intraembryonic source of CFU-S in the developing mouse. Nature, 364, 64-67. doi:10.1038/364064a0
- Vandevar, M.A., Weiner, M.P., Hutton, C.J. and Batt, C.A. (1988) A simple and rapid method for the selection of oligodeoxynucleotide-directed mutants. Gene, 65, 129- 133. doi:10.1016/0378-1119(88)90425-8
- Ho, S.N., Hunt, H.D., Horton, R.M., Pullen, J.K. and Pease, L.R. (1989) Site-directed mutagenesis by overlap extension using the polymerase chain reaction. Gene, 77, 51-59. doi:10.1016/0378-1119(89)90358-2
- Dresser, D.W., Hacker, A., Lovell-Badge, R. and Guerrier, D. (1995) The genes for a spliceosome protein (Sap 62) and the anti-mullerian hormone are contiguous. Human Molecular Genetics, 4, 613-618. doi:10.1093/hmg/4.9.1613
- de Santa Barbara, P., Moniot, B., Poulat, F. and Berta, P. (2000) Expression and subcellular localization of SF-1, SOX9, WT1, and AMH proteins during early human testicular development. Developmental Dynamics, 217, 293- 298. doi:10.1002/(SICI)1097-0177(200003)217:3<293::AID-DVDY7>3.0.CO;2-P
- Klattig, J., Sierig, R., Kruspe, D., Besenbeck, B. and Englert, C. (2007). Wilms’ tumor protein Wt1 is an activator of the anti-mullerian hormone receptor gene Amhr2. Molecular and Cellular Biology, 27, 4355-4364. doi:10.1128/MCB.01780-06
- Mazaud Guittot, S., Tetu, A., Legault, E., Pilon, N., Silversides, D.W. and Viger, R.S. (2007) The proximal Gata4 promoter directs reporter gene expression to sertoli cells during mouse gonadal development. Biology of Reproduction, 76, 85-95. doi:10.1095/biolreprod.106.055137
- Oreal, E., Mazaud, S., Picard, J.Y., Magre, S. and Carre-Eusebe, D. (2002) Different patterns of anti-Mullerian hormone expression, as related to DMRT1, SF-1, WT1, GATA-4, Wnt-4, and Lhx9 expression, in the chick differentiating gonads. Developmental Dynamics, 225, 221-232. doi:10.1002/dvdy.10153
- Viger, R.S., Taniguchi, H., Robert, N.M. and Tremblay, J.J. (2004) Role of the GATA family of transcription factors in andrology. Journal of Andrology, 25, 441-452.
- Schepers, G., Wilson, M., Wilhelm, D. and Koopman, P. (2003) SOX8 is expressed during testis differentiation in mice and synergizes with SF1 to activate the Amh promoter in vitro. The Journal of Biological Chemistry, 278, 28101-28108. doi:10.1074/jbc.M304067200
- Arango, N.A., Lovell-Badge, R. and Behringer, R.R. (1999) Targeted mutagenesis of the endogenous mouse Mis gene promoter: In vivo definition of genetic pathways of vertebrate sexual development. Cell, 99, 409-419. doi:10.1016/S0092-8674(00)81527-5
- Escudero, J.M., Haller, J.L., Clay, C.M. and Escudero, K.W. (2010) Microarray analysis of Foxl2 mediated gene regulation in the mouse ovary derived KK1 granulosa cell line: Over-expression of Foxl2 leads to activation of the gonadotropin releasing hormone. Journal of Ovarian Research, 3, 4. doi:10.1186/1757-2215-3-4
- Koopman, P., Gubbay, J., Vivian, N., Goodfellow, P. and Lovell-Badge, R. (1991) Male development of chromosomally female mice transgenic for Sry. Nature, 351, 117-121. doi:10.1038/351117a0
- Simmler, M.C., Cunningham, D.B., Clerc, P., Vermat, T., Caudron, B., Cruaud, C., Pawlak, A., Szpirer, C., Weissenbach, J., Claverie, J.M. and Avner, P. (1996) A 94 kb genomic sequence 3’ to the murine Xist gene reveals an AT rich region containing a new testis specific gene Tsx. Human Molecular Genetics, 5, 1713-1726. doi:10.1093/hmg/5.11.1713
Appendix
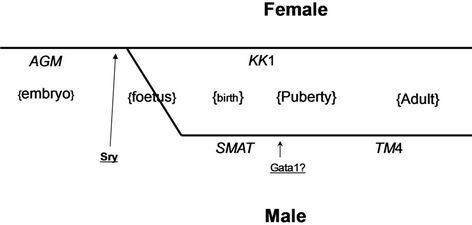
Figure A1. Depiction of the development of granulosa and Sertoli cells during early sexual differentiation shows the relative positions of the origin of the mouse cell lines used in this study: time increases exponentially from left to right. AGM are 8 lines of aorta, gonad and mesonephros stem cells [10]; KK1 are granulosa cells [5-7]; SMAT are pre-pubertal Sertoli [8]; and TM4 (ATTC) are post-pubertal Sertoli cells. 3T3 (fibroblast) cells were also used in some experiments. There is no direct evidence linking AGM to the granulosa-Sertoli stem cell stock. Sry [22] and Gata1 [4] indicate when these transcription factors are likely to play a critical role in sexual development.

Figure A2. A composite graphic depicting an experiment similar to those illustrated in Figure 4. The histogram at the top of this figure shows the mean (SEM) expression index from four cultures per group. The index is the product of the percentage—of total intact cells (5000)—which are in the green window and the geometric mean brightness (I = % × Gm). The group names correspond to the mutations of the Amh promoter shown in Figure 1. The 3 × 3 panel below is part of a flowcytometric analysis of cells from a single culture in each group. The top left graph is an example of a forward x side scatter output used to eliminate from the analysis, dead cells and debris as well as clumps of cells. Each item is identified by the group name used in the histogram. The percentage of intact cells in the green window is indicated on each part of the panel. Comparison of “Amh prom” and “Tk” shows in the histogram that the Tk index is double that of Amh promoter, yet in the flow-cytometric analysis the percentage is more or less the same: the difference is that cells with EGFP driven by a minimal Tk promoter are individually brighter, presumably expressing EGFP at a higher rate and by implication more efficiently. The intracellular two hour halflife of the d2EGFP used here suggests that accumulation of product is minimal. A similar explanation may account for the smaller increase seen in the response index manifested by the proxGata mutated Amh promoter where it could be supposed that the tf binding to this element acts primarily by reducing the rate of EGFP expression.