Journal of Encapsulation and Adsorption Sciences
Vol.05 No.01(2015), Article ID:54949,18 pages
10.4236/jeas.2015.51006
Implementation of a Simulation Model of the Controlled Release of Molecular Species from Halloysite Nanotubes
Divya Narayan Elumalai1, Yuri Lvov1, Pedro Derosa1,2*
1Institute for Micromanufacturing, Louisiana Tech University, Ruston, LA, USA
2Department of Physics, Grambling State University, Grambling, LA, USA
Email: *pderosa@latech.edu
Copyright © 2015 by authors and Scientific Research Publishing Inc.
This work is licensed under the Creative Commons Attribution International License (CC BY).
http://creativecommons.org/licenses/by/4.0/


Received 27 February 2015; accepted 20 March 2015; published 24 March 2015
ABSTRACT
In this work a three-dimensional, time-quantified Monte Carlo model that efficiently describes diffusion through and from nanotubes is implemented. Controlled delivery from Halloysite Nanotubes (HNT) is modeled based on interactions between the HNT’s inner wall and the nanoparticles (NPs) and among NPs themselves. The model was validated using published experimental data. The validated model is then used to study the effect of multiples parameter like HNT diameter and length, particle charge, and ambient temperature on the release of encapsulated NPs. The results show that release profiles depend on the size distribution of the HNT batch used for the experiment, as delivery is sensitive to HNT lumen and length. A very good agreement with the experiment is observed when a weighted average release profile is compared to the experimental profile. Although the NP dynamics is temperature-dependent, the effect is minimum within the range of temperatures relevant to biomedical applications, but will be relevant for other applications at temperatures significantly different from room temperature. This model can be used to predict the best conditions for a particular delivery need.
Keywords:
Diffusion, Controlled Release, Halloysite Nanotubes, Montecarlo, Sustained Release

1. Introduction
Nanotechnology gave scientists a number of materials that enabled the experimental realization of concepts that could previously only be realized as thought experiments. No other nano-material has proven more valuable in this regard than nanotubes (NTs). Since their discovery in 1991, carbon nanotubes (CNTs) have attracted considerable interest due to their exceptional mechanical, chemical, optical, and electronic properties that make them suitable for a wide variety of applications including catalysis, electronics, molecular sensing [1] , and, of particular interest to this work, molecular storage and release [2] - [15] . Indeed, there is an increasing amount of ongoing research to produce functional nano-containers for their use, among other areas, in biomedical applications, particularly drug delivery [5] - [7] [16] - [19] . However, the use of different NTs of various types (not just CNTs) has been proposed beyond the biomedical field, in a variety of applications such as the controlled release of anti- corrosives [20] [21] , water purification [22] , polymer composites [23] [24] , and antimicrobial coatings [14] . All of these applications serve as motivations for developing controlled-release systems, which alter the temporal and localization release patterns and availability of molecular species of interest, besides improving systemic availability. For instance, NPs can be incorporated in nano-carriers that have access to the whole systemic circulation, but are delivered less rapidly than free NPs.
Due to the toxic nature of CNTs, researchers look with interest into more natural options like clay. Most common clay structures possess a nano-layered morphology, for example, kaolin and montmorillonite [25] , while other naturally occurring nanoclays show a hollow tubular structure [7] [25] . Two such promising nanoclays that can be used as nano-containers with controlled release properties are imogolite nanotubes (INTs) [25] and natural halloysite nanotubes (HNT) [2] [7] , INTs however, present some level of toxicity [26] . HNT clay is a two-layered aluminosilicate, chemically similar to kaolin, with a hollow tubular structure in the sub-micrometer range. HNT is abundant, durable, and biocompatible; furthermore, it is cheap compared to synthetic nanomaterials with similar morphology. HNT is formed naturally when kaolin sheets roll up on themselves [2] . Kaolin sheets are rolled into tubes because of the strain caused by lattice mismatch between adjacent silicone dioxide and aluminum oxide layers [2] . As with most naturally occurring materials, HNT’s size varies from HNT to HNT in a batch; the external diameter varies from 50 nm to 70 nm with lumen inner diameter from around 5 nm to as large as 40 nm - 50 nm [2] . The length of HNTs varies from 0.5 μm - 1.5 μm. HNTs have a specific density of 2.53 g/cm3, refractive index of 1.54, pore volume of 1.25 ml/g, and specific surface area of 65 m2/g [2] [27] . The outer surface of the HNTs has properties similar to SiO2 with negative charge at pH 6 - 7 while the inner cylinder core is Al2O3 which is positively charged for pH of less than 8.5 [3] [28] [29] . The positive charge of the inner lumen promotes loading of HNTs with negative macromolecules within void spaces, while at the same time they are repelled from the negatively charged outer surfaces [2] [3] [28] [29] . HNTs are capable of entrapping and retaining a range of active agents within the inner lumen, followed by their slow release.
The adaptation of HNT microtubules for controlled release was the result of the work of Burke and Singh [30] . HNTs were found to be a viable and inexpensive nanoscale container for encapsulation of drugs and other NPs [3] [4] [6] -[10] [31] -[35] , this was first demonstrated by Price [5] , Lvov [5] , and Kelly [14] . The use of HNTs as a novel drug delivery system was also reported by Levis et al. [17] [18] . The strong surface charge of HNT’s has been exploited by Lvov et al. [2] - [15] [33] for the design of a nano-organized multilayer using layer-by-layer assembly and for the use in sustained release experiments. An in vivo drug delivery system that uses functionalized HNTs for treating periodontitis was demonstrated by Kelly et al. [19] . Lvov et al. [3] [14] reported using copper-coated microcylinders filled with oxytetracycline HCl in antifouling coatings. Price et al. [6] reported the use of microcylinders for the delivery of proteins and growth factors. To further delay/control release, CdS and Fe3O4 NP have been used as end caps for HNTs to regulate the opening/closing of the pore entrance of meso- structured materials [36] . The covalent modification of the inner surface of HNT, to be able to incorporate more ferrocene than pristine nanoclay, was reported by Cavallaro et al. [37] . Cavallaro et al. [37] also reported the modification of HNT lumen by incorporating perfluoroalkylated anionic surfactants to obtain stable colloidal dispersions in water with enhanced oxygen solubilization ability. Biocompatible HNT- based fluorinated surfactants have been proposed as oxygen carriers in biomedical applications [38] . Finally, the possibility to adjust HNT inner diameter between 15 and 30 nm, by selective etching, while maintaining the outer diameter unchanged, was demonstrated in reference [39] .
Therefore, experimentalists can have short ca 0.5 mm (milled HNT) and long 1 - 1.5 mm clay nanotubes with inner diameter between 5 nm and 50 nm, can vary the inner and outer surface potential of HNTs by adsorption of charged molecules, and are empirically trying to optimize these parameters to have controlled sustained release without the possibility to predict and optimize these tubule carrier properties [2] . The ability to simulate the process can certainly assist in this task.
When designing controlled-release systems, it is essential to ascertain and comprehend particular mechanisms involved in the release process. Even though different mechanisms dominate at different stages of the NP delivery process, each stage may have more than one mechanism acting at the same time. The past decade represented a period of concerted experimental and theoretical research efforts to elucidate several of the hitherto incompletely understood aspects. The need to accurately control release rates and be able to consistently predict controlled delivery/release characteristics, such as release times, motivates this research, and thus this paper highlights controlled delivery from HNT by modeling associated interactions between the HNTs and the NPs. To achieve optimal release profiles for a given set of initial and boundary conditions, like initial molecular concentration or pH and temperature of the surrounding media, only a few simulations parameters need to be tested, and the results obtained from simulations can then be translated to experiments which in turn can produce the necessary data to calibrate and validate computational models. In the next section, the model developed for this work is presented, then results are described with appropriate discussions of the virtues and limitations of the model, and finally conclusions are offered.
2. Model and Simulation Method
Nanometer-scale tubules of HNT introduce the prospect of observing purely non-Knudsen transport (because the radius of the nanotube is around 15 nm) at atmospheric pressure and temperature. Here we present a rather unique 3-D coarse grain Montecarlo (time-quantified) model that uses classic kinetic theory coupled with Guy- Chapman-Enskog theory and Poisson-Boltzmann theory to describe molecular transport in HNT channels and highlights the role of surface diffusion and transport efficiency. This model uses several basic assumptions about the nature of molecules, molecules-wall interactions, and the influence of collisions on the NPs’ displacement. It is proposed that the model can be used as is in other types of nano-porous channels as long as the channel’s wall can be considered smooth, rigid, and defect free. With minor modifications, less uniform wall surfaces can also be modeled.
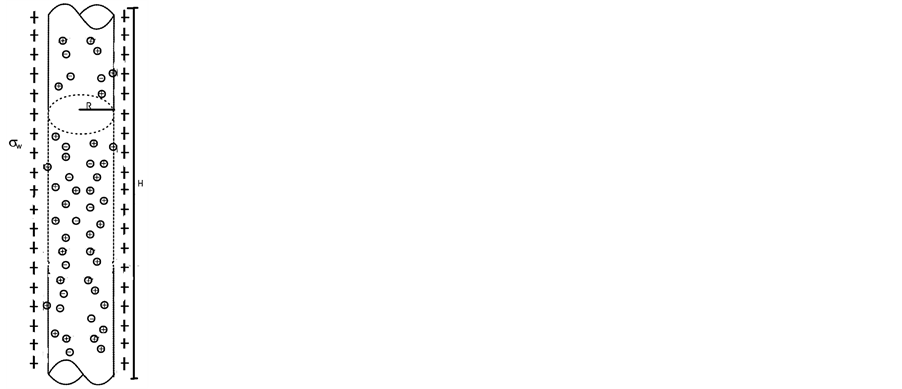
For sufficiently large cylindrical structures (pores or nantubes), in the 50 - 100 nm range (e.g. HNTs) investigation can focus on the interaction of the permeate with the inner charged surface of the NT. SEM and STM images of HNT and a schematic of the cylindrical nanotube are shown in Figure 1.
The model, implemented using MATLAB [40] , was designed to simulate NP diffusion in long, defect free NTs and out of the ends of the NTs. The hydrodynamic radius, the effective radius of a hydrated NP in solution, is considered in these simulations, rather than the actual gas phase radius. NPs are considered to be spherical in shape and are initially distributed uniformly throughout the cylindrical channel except at the tube’s ends where the density is larger to account for the experimentally observed initial burst (see below for more details), with the media in the channels being either a dielectric media or vacuum. NP’s motion is simulated as a random walk to sample the configuration space subject to interactions among NPs and between the NPs and the HNT walls. Particles are moved one at a time in an arbitrary direction and an arbitrary length up to an upper limit that depends of the kinematics of the system. The move is allowed as long as it is energetically viable and there is no overlap with the walls or with neighboring NPs along the line connecting the initial and final position of the NP. A move is considered energetically viable if the total energy of the system is either reduced or stays the same. If the energy increases however, the move can still be accepted with Boltzmann probability. A simulation step is the event where every particle in the system has either moved or attempted to move once.
2.1. NP-Wall Interaction
The NPs are modeled as soft core spheres with hydrodynamic radius R and a zeta potential (the potential at R). The NTs walls are positively charged with a pH-dependent surface charge density. Due to the structure of HNTs, a soft wall composed of Lennard Jones (LJ) atoms is chosen accordingly, thus the ion-wall interaction consists of a coulombic plus a Van der Waals (VdW) term with a cutoff for the VdW interactions set to 6R.
 (1)
(1)
Here  is the energy contributions due to columbic interactions and
  the contributions due to VdW interactions.


 (a) (b) (c)
Figure 1. (a) TEM and (b) SEM images of a clay nanotube batch, (c) Schematic cross section of a charged cylindrical nanotube with ions inside used as a model for this work.
The VdW ion-wall interaction can be computed by integrating the VdW potential over the wall surface. An analytical expression for the VdW experienced by small charges inside a cylindrical nanotube is given by Afansiev et al. [41] as Equation (2).
 (2)
(2)
Here  is the distance from the wall along a radius and
  is the VdW constant. d is the average dipole length, while
  and
and  are the permittivity of the wall and the media respectively. In this work c3 = 0.04.
 (3)
(3)
where  and
and  are modified Bessel functions, with r the distance between the center of the NP and the center of the nano-channel, what accounts for the curved shape of the cylinder wall. For further details see reference [41] .
The columbic interaction between the NP and the inner surface of a HNT lumen in a solvent is considered here to correspond to that of a charged spherical NP with the inner part of a charged cylinder of infinite length, except when the particles are at the ends of the tube (for the solution at the ends see below). Utilizing a basic model of electrolyte, the solvent is treated as a uniform background with a dielectric constant containing charged spheres.
Equation (7) describes the potential energy landscape for a charged NP with electrical potential  in a charged, very long, hollow dielectric cylindrical channel with surface potential
  immersed in a medium of relative permittivity
 . This is obtained by solving the linearized Poisson-Boltzmann equation for the cylindrical nanotube immersed in a medium of uniform dielectric [42] [43] .
In cylindrical coordinates the Poisson Boltzmann equation is
 (4)
(4)
Here  is the Debye length and
  is the potential. The boundary conditions for the charged sphere and the cylindrical lumen of the HNT are
  at the particle surface and
  at the inner surface of the cylinder’s wall.
  in turn depends on the pH of the system what implies that the surface charge density depends on the pH of the medium. The variation of zeta potential
  with pH for HNTs has been published by Lvov et al. [11] .
Remaining boundary conditions are:
 (5)
(5)
where
 (6)
(6)
With these, the Coulomb’s interaction energy is given by:
 (7)
(7)
In this implementation,  was represented by
 , which is consistent with the NP’s radius being the hydrodynamic radius R. R0 is the HNT radius, r is the radial distance between the axis of the cylinder and the NP,
 is the Debye length and A is given by,
 (8)
(8)
where  is the permittivity and
  the refractive index of the HNT wall,
  is the permittivity and
  is refractive index of the NPs, and
  is the permittivity while
  is refractive index of the surrounding medium. At the HNT entrance, the infinity tube approximation is discarded in favor of the interaction between the NP and a rounded HNT pore entrance as schematically represented in Figure 2 [44] .

Figure 2. Geometry considered as a model for this work.
Equation (9) describes the potential energy landscape for this situation [42] [43] . The boundary conditions here are
 (9)
(9)
Then
 (10)
(10)
where,  is the radius of the pore rounding, and
 (11)
(11)
 (12)
(12)
2.2. NP-NP Interaction
The interaction energy between two ions is expressed as
 (13)
(13)
 is the VdW interactions between a pair of particles accounted for by the 12-6 Lennard-Jones Potential [45] given by,
 (14)
(14)
Here  is the depth of the energy well,
  is the distance at which the energy is equal to zero, and
  is the distance between the 2 particles.
 is the screened electrostatic potential for a spherical charged particle of radius R immersed in an electrolyte with positive and negative ions. According to the DVLO theory (named after Derjaguin, Landau, Verwey and Overbeek) the screened potential is given by [46] :
 (15)
(15)
Here  and
and  are the charges of the individual particles,
  the distance between the two particles, R is the radius of the molecule,
  is the Bjerrum length, and
  is the Debye length given by Equation (16) [47] .
 (16)
(16)
 is the Avogadro number,
  is the ionic strength, where
  is the molar concentration,
  is the charge number of the ith ion and e is the elementary charge,
  is the permittivity of the medium,
  is the dielectric constant of vacuum,
  is the Boltzmann constant and T the temperature.
2.3. NP-NP Interaction Introducing Time in the Algorithm
The Monte Carlo Algorithm as described above does not provide time correlated sequence of events. Kinetic/ dynamic Monte Carlo algorithms have time incorporated explicitly but they require the process rate to be known.
The approach to introduce time to the algorithm presented here is as follows. The maximum hop distance of the molecules is taken to be the mean free path as described by the Chapman-Enskog theory for fluids and molecular gas flow (Equation (17)) [48] .
 (17)
(17)
where R is the gas constant, T is the temperature,  is the combined density of NPs and the permeate inside the NT, and
 (18)
(18)
Here  is the NPs volume fraction,
  is the Boltzmann constant,
  is the maximum energy of attraction,
  is the collision cross section and
  is the Chapman-Enskog collision term.
In the ideal case of completely elastic specular collisions in a completely smooth cylinder, molecules will translocate through the NT in a billiard-ball-like series of collisions and the NT would introduce no resistance to transport. In reality, non-bonded interactions among NP and between NP and the tube’s wall, as well as surface defects and charges in the NT’s openings, can act as scatterers or anchors and randomize the molecular velocity Therefore, the mean free path of NPs in the nanotube depends on the nanotube diameter and the average distance between the regions/points inducing scatter. All these factors are accounted for in Equation (17).
In molecular transport, the mean square displacement of transported particles scales nonlinearly with time. This kind of transport is observed in many physical processes and often leads to a broad-ranged particle distribution density, both in space and time. The random walk formalism as implemented here, offers an attractive framework to understand and model such transport. This approach assumes that transition times associated with particle displacements are independent of each other. So the velocity of successive jumps is not correlated.
The velocity of the particles during hops has contributions from thermal velocity and a potential-energy-de- pendent drift velocity. The average total velocity is given by:
 (19)
(19)
 (20)
(20)
where M is the mass of the NP and R the molar gas constant.
In the simulations presented here, there is no contribution from an external electric field, as there is no electric field present in the condition under which delivery is carried on in the experiment, but the model can account for an external field by including such contribution in Equation (19).
Elapsed time at each simulation step is then calculated by dividing the mean displacement by the average total velocity for that time step.
 (21)
(21)
Here,  is the time at step n,
  is the time at previous time step n − 1,
  is the average displacement of all particles during timestep n, obtained as the square root of the Mean Squared Displacement, and
  is the total velocity, from Equation (20), at that time.
The properties of all NPs studied in this work are given in Table 1.
2.4. Nanotube Loading/Release, Experimental Conditions
All the work reported here is a result of computer simulations, however in order to give the reader a clear picture of how the simulations represent the experiment, the conditions under which experiments are conducted are reported here. It is worth noticing that one of us (YL) has extensive experimental results, some of these results are used below to validate the simulation.
In order to load the HNT, saturated solutions of drugs are mixed with a dry HNT powder and sonicated for 15 minutes. The samples are transferred into a vacuum jar, which is then evacuated using a vacuum pump. A slight fizzing indicated the removal of air from the HNT lumens. The expelled air is replaced with the saturated solution of drugs. The process is repeated three times for most efficient loading which is typically 6 - 8 wt%. After loading, the samples are separated from the solution by centrifugation, washed and then air dried.
All release experiments are performed in water, at pH 7.5 and room temperature (sink release conditions). The samples are stirred and the supernatants are collected periodically. Concentrations of released drugs are determined using UV-Vis spectrophotometer. At the end of the release study, a high power sonication is performed to ensure the complete release of loaded corrosion inhibitors and to calculate the loading efficiency for the kinetic normalization. More experimental details are given in [6] [7] [11] .
3. Results and Discussions
The results shown in Figures 3-13 feature the spontaneous release of NPs from HNTs immersed in a medium of constant dielectric properties consistent with water. The term spontaneous release indicates that the NPs motion in the HNT is not driven by externally applied forces or potentials, the diffusion of NPs is driven only by interactions between NPs and HNT and a concentration gradient. Four different NPs, 2-acetoxy benzoic acid,

Table 1. Physical properties of the four different NPs used in this work.

 (a) (b)
 (c) (d)
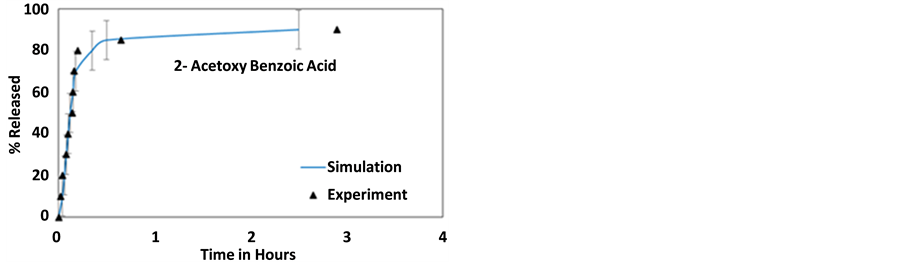
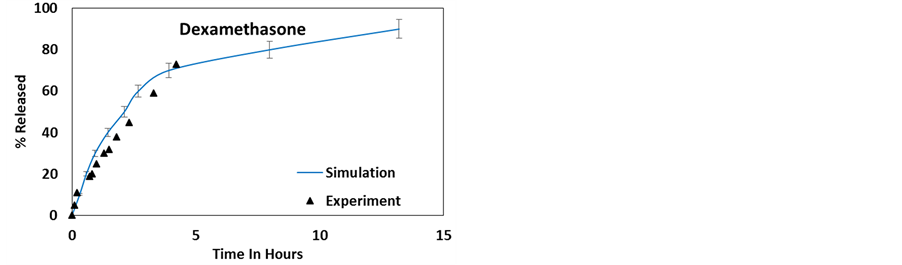
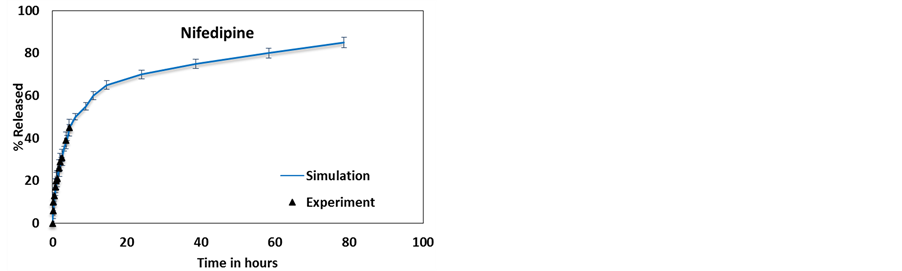
Figure 3. Simulation results compared to experimentally available release profiles for (a) 2-acetoxy benzoic acid [50] , (b) dexamethasone [11] , (c) furosemide [11] and (d) nifedipine [11] , from a 12 nm lumen HNT.

 (a) (b)
 (c) (d)
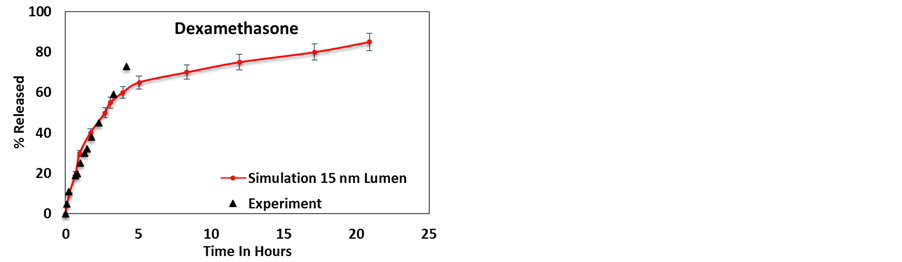
Figure 4. Simulation results compared to experimentally available release profiles for (a) 2-acetoxy benzoic acid [50] , (b) dexamethasone [11] , (c) furosemide [11] and (d) nifedipine [11] , from a 15 nm lumen HNT.

Figure 5. Experimentally determined HNT inner lumen diameter distribution [50] .

 (a) (b)
 (c) (d)
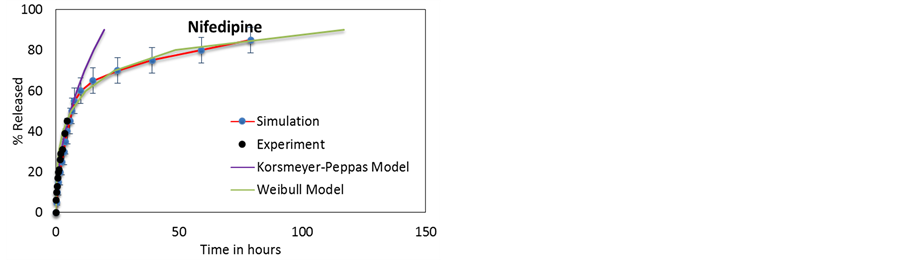
Figure 6. Diffusion models compared to simulated release profiles for (a) 2-acetoxy benzoic acid [50] , (b) dexamethasone [11] , (c) furosemide [11] , (d) nifedipine [11] .
 (a) (b)
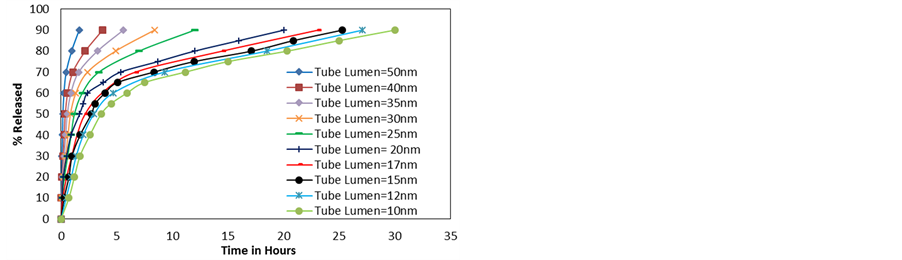
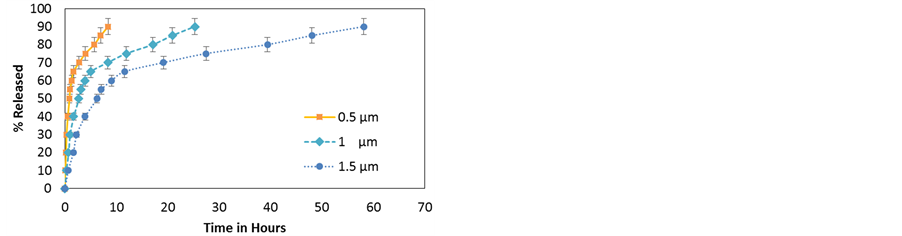
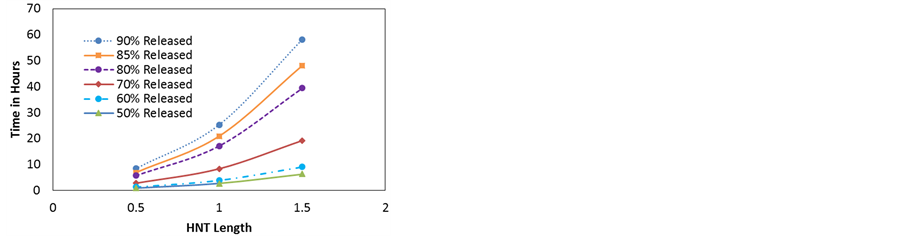
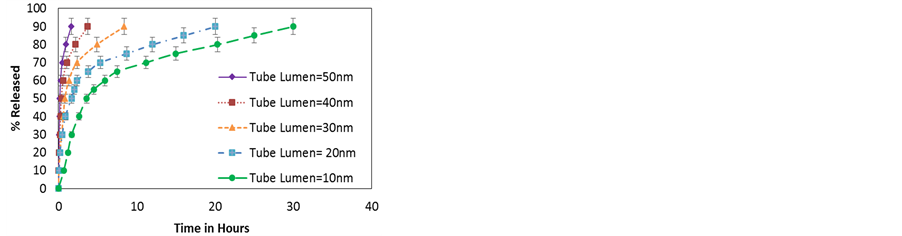
Figure 7. (a) Simulated release profiles of dexamethasone molecules from HNTs of different radii; (b) Time needed for the release of 50% - 90% vs lumen diameter.
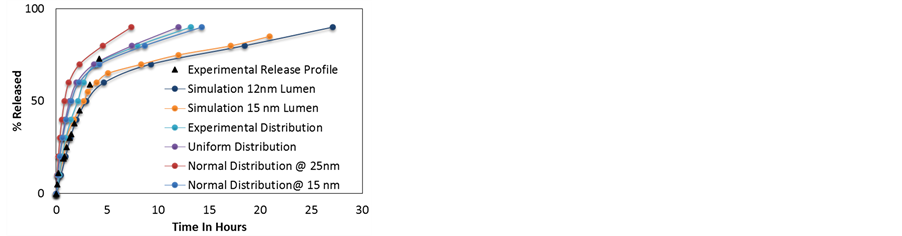
Figure 8. Weighted average release profiles of dexamethasone molecules from HNTs of different radii, for various inner lumen diameter distributions.
 (a) (b)
Figure 9. (a) Simulated release profiles of dexamethasone molecules as a function of tube length; (b) Time needed for the release of 50% - 90% vs HNT length (tube lumen = 15 nm).
 (a) (b)
Figure 10. (a) Release profiles for repulsive interactions between the wall and the particles for different radii; (b) Release profiles for attractive interactions between the wall and the particles for different radii.
 (a) (b)
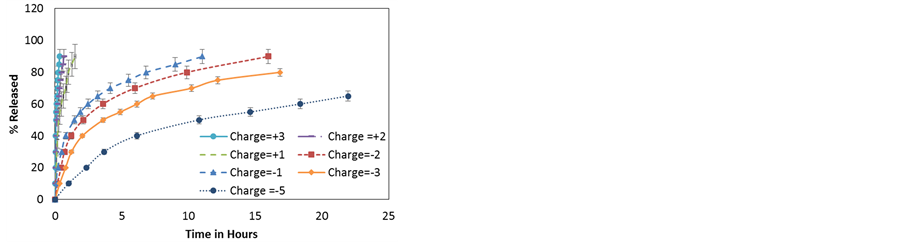
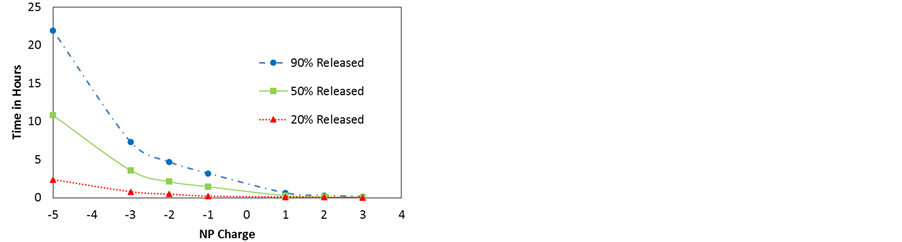
Figure 11. (a) Release profiles of dexamethasone-like particles with different charges from HNTs of lumen 15 nm; (b) Time needed for 20%, 50% and 90% release of NPs vs NP charge.

 (a) (b)
Figure 12. (a) Release profile for dexamethasone from 15 nm lumen HNTs as a function of temperature; (b) Time needed for 90% release of NPs vs temperature. The inset shows the same information but at a scale needed to accommodate the simulation error showing that all points are indeed within the statistical error.
 (a) (b)
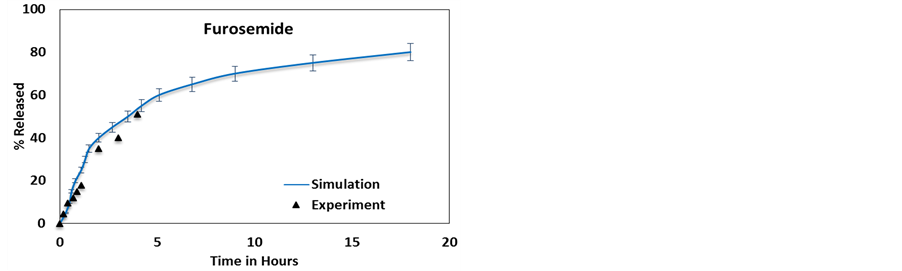
 (c) (d)
Figure 13. Comparing the experimental and weighted average simulated release profiles of (a) 2-acetoxy benzoic acid [50] , (b) dexamethasone [11] , (c) furosemide [11] and (d) nifedipine [11] .
dexamethasone, nifedipine, and furosemide were chosen to validate the model; the experimental release profiles for these molecules from HNTs were obtained from the literature. In the pH range of 4 - 8.5, surface charge in the HNT tubule lumen is positive and surface charge on the external surface is negative. This surface charge difference promotes the loading of negatively charged molecules inside the lumen and is expected to limit their adsorption onto the negative outer surface of the tubules. All the simulations presented here were conducted in an environment consistent with a pH of 7.4 selected to match experimental conditions to which these simulations are compared to, which replicate physiological conditions for drug release [49] .
The release profiles from 12 nm and 15 nm lumen HNTs, in comparison experimental results are shown in Figure 3 and Figure 4 respectively. Each point is the averages of 30 independent simulations under identical conditions.
There is a significant difference between batches of HNTs used in experiments where lumen and length distributions vary from one sample to another, particularly between samples mined from different locations [51] - [54] . The two lumen diameters selected for the calculations presented above were chosen because the experimental HNT batch for the first three molecules, to which results are being compared, has a distribution (presented in Figure 5) with a peak at 12 nm and average lumen around 15 nm.
Experiments show that NP release from the halloysite tubules is typically 25 (nifedipine) ? 75 (furosemide and dexamethasone) times longer than that from the micro crystals [35] . Table 2 shows the time taken for maximum release reported in the experimental work for the four molecules subject of this study. The times reported correspond to 90% release for 2-acetoxy benzoic acid, 70% for dexamethasone, 50% for furosemide, and 45% for nifedipine respectively.
Figure 3(a) and Figure 4(a) shows a comparison between the release profile of 2-acetoxy benzoic acid and experimental results reported by Wenbo Wei [50] . 2-Acetoxy benzoic acid has the lowest (negative) surface potential (at pH 7.4) of the 4 molecules and thus it does not feel as strong a pull towards the walls as the other three molecules leading to the fastest delivery of all, this is clearly shown in Figure 3(a) and Figure 4(a) where more than 85% of the molecules are released within the first hour. The release profile shows an initial burst followed by a longer saturation phase. The saturation phase is due to the surface diffusion of the molecules adhering to the walls.
Figures 3(b)-(d) and Figures 4(b)-(d) provide a comparison between the release profiles for dexamethasone, furosemide, and nifedipine with the experimental release profiles obtained from Veerabadran et al. [11] . These figures show a good correlation between the experimental and simulation profiles. For these cases, simulations also predict an initial burst followed by a saturation face, however, unlike the case of 2-acetoxy benzoic acid, the experimental release stops at a smaller delivery percentage and no experimental verification of the saturation face is provided. These three molecules bear a significantly larger surface potential than 2-acetoxy benzoic acid and thus the release takes longer.
The features of the release profile can be explained in terms of molecular interactions. Molecules, being negatively charged, adhere to the HNT’s walls and form a layer, similar to a stern layer, near the wall effectively shielding other negatively charged molecules from the wall. These shielded molecules then diffuse out of the HNT due to intermolecular repulsion. The molecules that stick to the wall diffuse out more slowly causing an elongated saturation phase. Since a large numbers of NPs diffuse out during the burst phase, the contribution to the total energy of the system due to NP-NP repulsive interactions is greatly reduced, the velocity of the NPs also reduces, and this also contributes to reduce the NP’s release rate in the saturation phase as time passes. This leads to a two-phase release, an initial release burst phase or phase I and the slower saturation phase or phase II, this is corroborated by the experimental results on 2-acetoxy benzoic acid where the saturation phase is reached in the experiment. An inspection of the simulation results show that around the concentration where phase II starts, most of the remaining NPs are near the wall. Phase II is therefore governed by surface diffusion along the wall. In the experiments, phase I is governed by multiple release processes. The first may be attributed to the dissolution of NPs from the HNTs outer openings. The second is the release of NPs in the natural gaps/defects on the cylinder surface at the end of the rolled clay sheet, and the diffusion of NPs at the center of the tube that are shielded from the wall [55] . In the model, these effects are simulated by setting up a higher NP density at the ends of the tubes than in the center as explained earlier, followed by the release of NPs inside the HNT lumens, shielded from the wall by other NPs. This process is governed by molecular diffusion. The actual concentration at the ends was calibrated a-priori and it is not used as an adjustable parameter.
No single mathematical model can satisfactorily describe the entire release process, but the two phases can be independently described by two distinct mathematical models. Both release phases are concentration-dependent and follows first order kinetics.
The burst phase can be best described by the Korsmeyer-Peppas model [56] ;
 (22)
(22)
where,  is a fraction of NPs released at time t, k is the release constant, and n is the release exponent. The value of n indicates the type of diffusion dominating the process [56] . This is summarized in Table 3. The Korsmeyer-Peppas model was first introduced by Korsmeyer et al. [56] in 1983 as a simple relationship describing drug release from a polymeric system. This model was used to study the release kinetics of data ob-
Table 2. Comparison of release times from micro-crystals and HNTs [11] [50] .
Table 3. Interpretation of diffusional release mechanisms from cylindrical channels [56] .
tained from in vitro drug release studies.
While the Korsmeyer-Peppas Model accurately describes the initial burst phase release, it is claimed to be accurate up to approximately 60% release. A different model introduced by Weibull and others [57] , is better suited to describe the saturation phase release. The Weibull model describes release profiles and dissolution of drugs from matrixes:
 (23)
(23)
Mt is a fraction of NPs released at time t and M∞ is a total amount of NPs released, a is a scale parameter describing time dependence and b describes the shape of the dissolution curve. When b = 1, the shape of the curve follows an exponential profile with a release rate constant k = 1/a.
The release curves corresponding to a 12 nm lumen HNTs are used to fit the two different mathematical models of first order kinetics discussed above. The results are presented in Figure 6 and the fitting parameters presented in Table 4.
It is observed that as the NPs’ zeta potential becomes more negative (see Table 1), the more the release profiles deviates from Fickian diffusion in the initial burst phase, as evidenced by the values of n = 0.001 for 2-acetoxy benzoic acid (the less negative) and 0.55 for furosemide (the most negative).
3.1. Effect of HNT Lumen
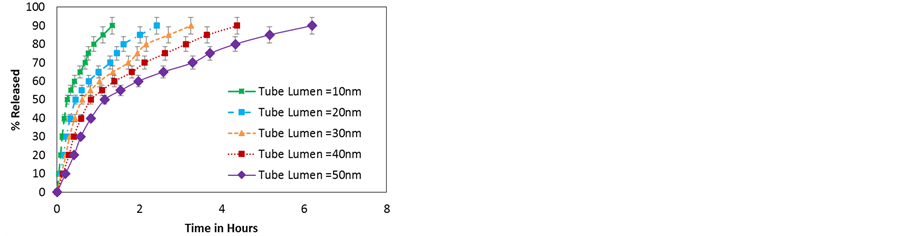
As discussed earlier, there is an important variation in HNT and NP properties in the experiment that may affect release and therefore the effect of each of these parameters on the release profile is studied independently. In this subsection the effect of the inner lumen diameter is addressed. The NP chosen for this study is dexamethasone (see Table 1 for this particle’s properties). All of the simulations are run at 300 K. The HNT lumen is varied from 10 nm - 50 nm. Error bars are not shown here for clarity, but they are within the same magnitudes as those shown in all other plots.
Experimentally, the HNT length varies from 0.5 to 1.5 µm with an average of 1 µm, thus for this study the HNT’s length was selected to be 1 µm. The NPs were placed inside the HNT such that 55% - 65% of the NPs were placed within the 25% outermost region of the HNT on both sides of the HNT.
The diffusion/release profile shows an increase in the delivery rate with HNT diameter. In all of these cases the dexamethasone particles experience surface diffusion at the end of the release, but as the HNT lumen increases, the effect of the walls on particle diffusion is less pronounced and the release profile evolves towards free diffusion. In all cases, the particles that are near the wall are attracted to it shielding the other particles from feeling a similar attraction, but for the smaller HNT, fewer molecules are able to cross a given cross-sectional area at once thus delaying diffusion. In addition, for larger HNT a smaller percentage of NPs are near the wall thus the saturation phase is reached after a larger percentage of particles are released.
Since in the experiment a distribution of HNT lumen size rather than a single NHT size is found, a weighted average following the lumen experimental distribution was considered and the result is presented in Figure 8 in
Table 4. Parameters from fitting different models to the release profiles from HNTs. These parameters are consistent with t in hours.
comparison with samples with a single lumen size of 12 nm and 15 nm and other distributions of lumen sizes, namely uniform and normal distribution, the later centered at two different lumen sizes (15 nm and 25 nm). The normal distribution was centered at 25 nm because experimentally HNT have lumens up to 50 nm, thus a normal distribution centered at 25 nm is symmetric, while the normal distribution centered at 15 nm was chosen as this is the average experimental lumen size. The results are compared to the experimental release profile obtained from literature. As can be seen, there is a large variation with lumen size distribution. In situations like this, simulations can be of assistance as the data obtained from simulations can be used to predict the release profiles from different samples of HNT mined at different locations across the globe if the size profile is known.
Results show that although 12 nm and 15 nm lumen tubes fit better the short time portion of the curve, the data obtained when the experimental distribution was used (light blue curve in Figure 8) better accounts for the entire 70% release data, showing that the presence of larger tubes is responsible for the larger time section of the curve.
3.2. Effect of HNT Length
A disadvantage of HNTs is that lumen volume is only 10% - 14% of the total volume so loading efficiency is limited. To increase loading, the lumen properties such as lumen volume, internal charge etc. can be tuned. Lumen volume is determined by two parameters, the lumen diameter and HNT length. Figure 9 shows the effect of tube length on the release profile of dexamethasone NPs from 15 nm lumen HNTs at 300 k. The initial concentration density in all three HNT is the same. As can be seen, the release is slower for longer HNT, however, notice that in all the cases, the saturation phase starts at about the same concentration, in this case after 60% of the particles have been released. This clearly contrasts with the effect of lumen radius where the saturation phase start after a larger percentage of particles has been released for larger HNT. Experimental information on length distribution is not currently available and thus simulation results with a length distribution are not provided.
3.3. Effect of NP Charge
NP’s charge undoubtedly has a strong effect in the delivery profile, to address this issue the effect of charge sign (leading to attractive or repulsive interactions) and charge magnitude are studied. Results reported in Figure 10 show the variation in release profiles of NPs from HNTs with diameter between 10 nm and 50 nm. The magnitude of the NP’s charge is that of dexamethasone (Table 1). All other properties of the NPs are kept the same (i.e. similar to dexamethasone). The positively charged NPs experience repulsion from the HNT walls whereas the negatively charged NPs experience an attraction. Figure 10(a) shows that for repulsive interactions, the time taken to release decreases with the radius. The particles experience a squeezing effect and are forced away from the walls towards the center of the nano channel where particle-particle repulsion forces particles out of the HNT. In Figure 10(b) the release profiles for attractive interaction from HNT of different radii are shown. The effect in this case is exactly opposite, the HNT with smaller radii exert a stonger attaction pulling the particles towards them. Once at the wall the NPs stay there moving along the surface of the wall resulting in surface diffusion. In both cases the smaller the tube diameter the more pronounced is the effect.
Next, the magnitude of the NP’s charge is considered, all other properties are those of dexamethasone. Changing the net charge of the molecule is experimentally possible, for instance by either using layer-by-layer functionalization or encapsulating the NPs in micelles.
All of the simulations are run at 300 K. The NP charge is varied from +3 to −5. The results are shown in Figure 11. An increase in charge on the NP leads to a stronger interaction among NPs and between the NPs and the charged inner wall of the HNT. In the case of attractive interactions the NPs experience a pull towards the wall and the mechanism of diffusion that occurs in all such cases is surface diffusion. As expected, the particle with the largest charge diffuses more slowly than the less charged particle. In the case of repulsive interactions, NPs experience a push away from the walls and the mechanism of diffusion that occurs in all such cases is normal mode diffusion. Once more, the NPs with the largest charge diffuse faster than the less charged particle. Figure 11(b) shows the time taken for a given percentage of particles to be released from the HNT as a function of charge. For positively charged particles, the release time is very small in the time scale appropriate for negatively charged particles and all points seem to overlap each other making the fast diffusion more evident.
3.4. Effect of Temperature
Finally the effect of temperature on the release profile is studied. The temperature in a real system for practical application can only be varied by a few degrees; especially for application such as drug delivery, so in this study changes of ±10 K from 300 K were studied, a special case at 600 K was also studied for comparison. In these simulations only the temperature is varied, all other parameters, like HNT surface charge density (consistent to that at pH 7.4) or HNT lumen diameter and length, are maintained constant. The NP used in these simulations is dexamethasone. Figure 12 shows the effect of temperature on the release rate. An increase in temperature increases the total energy of the system and the thermal velocity of the particles. From the point of view of the simulation, the increase in temperature allows some of the rejected hops to become energetically viable/accepted, which in turn results in an increased net displacement of the molecules. While the molecules can go farther faster, they are still constrained by the geometry of the nano channel and the presence of the surrounding media. From Figure 12(b) it can be seen that a change temperature by ±10 K has no significant effect on the release profile. This indicates that the increase in temperature by these trivial amounts is expected to produce a negligible effect in the experimental profile. On the other hand, the release profile at 600 K shows a much faster NP’s release. This is because at the higher temperature almost all hops are energetically acceptable. High temperatures are not expected for HNT drug delivery, however an interest for release kinetics at temperature of 350˚C - 400˚C is justified when HNT loaded with antioxidant molecules is used for antiaging doping of rubber tires or antimicrobial geopolymer concrete, for example [58] . A detailed study of temperature effect for other particular applications is beyond the scope of this paper and the subject of follow up work, with the study at 600 K presented here being an evidence of the large impact that a wider range of temperatures may have.
As a corollary of this work, Figure 13 shows the release profile of the 4 molecules from a HNT sample weighted for different lumen diameters with a distribution presented in Figure 5. A much better agreement with experimental results is observed compared to what is shown in Figure 3 and Figure 4. Accounting for the experimental distribution of HNT length may improve the agreement further, however at this time the experimental HNT length distribution is not available.
4. Conclusions
A model to simulate the diffusion/release profiles of NPs from rigid, defect-free HNTs is presented. 2-Acetoxy benzoic acid, dexamethasone, nifedipine, and furosemide are chosen as case studies to help validate the model, which in turn has helped identify, at a microscopic level, the relevant interactions controlling the release process and their relative importance in the release outcome. Complete release of non-encapsulated micro-crystal dexamethasone is experimentally observed to occur within 10 - 15 minutes, while 70% release of this drug takes 14 hours when released from HNTs. Similar behavior can be observed for the other NPs studied (Table 2).
The NP-NP and the NP-surface interactions determine the rate of release of NPs from the HNT. Two phases were identified in the release profile; the initial burst phase is governed by molecular diffusion and can be best described by the Korsmeyer-Peppas model. The saturation phase is mostly surface diffusion and is mathematically described by the Weibull model.
It is found that tunable controlled release can be achieved by varying the HNT lumen diameter and length. Increase in lumen radius leads to a progressive evolution towards free diffusion shifting the saturation phase that occurs after a larger percentage of particles have been released for wider HNTs. Changes in HNT’s length also change the release speed, but the beginning of the saturation phase is not affected. A key results show that the diversity of HNT sizes in experimental samples is a main factor in explaining experimental profiles; particularly, a better agreement between simulation and experiment is observed when a similar distribution of HNT lumen diameter is considered in the simulation. Other factors affecting the release rate from HNTs, such as ambient temperature and particle charge, were analyzed in detail to determine their effect. The release rate depends on the NP’s charge; positively charged NPs are released much faster due to repulsive interactions with the HNT’s inner wall which are positively charged at pH 7.4; the larger the charge the faster the release. Negatively charged NPs see the opposite effect; the larger the charge the longer it takes for the NPs to be released. Both cases i.e. attractive and repulsive interactions show a radius-dependent diffusion. Varying the ambient temperature by ±10 K from 300 K does not lead to an appreciable change in the release profile, whereas doubling the temperature of the system significantly speed up the NPs release from HNT, indicating that for high or low temperature applications, release profiles will be significantly different from those at room temperature.
Acknowledgements
This work is supported by the NSF, EPSCoR-LA-SiGMA project under award #EPS-1003897. Computer support from the Louisiana Optical Network Initiative (LONI) is gratefully acknowledged.
References
- Jorio, A., Dresselhaus, G. and Dresselhaus, M.S. (2008) Carbon Nanotubes: Advanced Topics in the Synthesis, Structure, Properties and Applications. Springer, New York.
- Suh, Y.J., Kil, D.S., Chung, K.S., Abdullayev, E., Lvov, Y.M. and Mongayt, D. (2011) Natural Nanocontainer for the Controlled Delivery of Glycerol as a Moisturizing Agent. Journal of Nanoscience and Nanotechnology, 11, 661-665. http://dx.doi.org/10.1166/jnn.2011.3194
- Vergaro, V., Abdullayev, E., Lvov, Y.M., Zeitoun, A., Cingolani, R., Rinaldi, R. and Leporatti, S. (2010) Cytocompatibility and Uptake of Halloysite Clay Nanotubes. Biomacromolecules, 11, 820-826. http://dx.doi.org/10.1021/bm9014446
- Veerabadran, N., Mongayt, D., Torchilin, V., Price, R. and Lvov, Y. (2009) Organised Shells on Clay Nanotubes for Controlled Release of Macromolecules. Macromolecular Rapid Communications, 30, 99-103. http://dx.doi.org/10.1002/marc.200800510
- Shchukin, D., Price, R., Sukhorukov, G. and Lvov, Y. (2005) Halloysite Nanotubes as Biomimetic Nanoreactors. Small, 1, 510-513. http://dx.doi.org/10.1002/smll.200400120
- Price, R., Gaber, B. and Lvov, Y. (2001) In-Vitro Release Characteristics of Tetracycline HCl, Khellin and Nicotinamide Adenine Dineculeotide from Halloysite; a Cylindrical Mineral. Journal of Microencapsulation, 18, 713-722.
- Lvov, Y.M., Shchukin, D., Mohwald, H. and Price, R. (2008) Halloysite Clay Nanotubes for Controlled Release of Protective Agents. ACS Nano, 2, 814-820. http://dx.doi.org/10.1021/nn800259q
- Lvov, Y., Ariga, K., Ichinose, I. and Kunitake, T. (1996) Formation of Ultrathin Multilayer and Hydrated Gel from Montmorillonite and Linear Polycations. Langmuir, 12, 3038-3044. http://dx.doi.org/10.1021/la951002d
- Kommireddy, D., Ichinose, I., Lvov, Y. and Mills, D. (2005) Nanoparticle Multilayers: Surface Modification for Cell Attachment and Growth. Journal of Biomedical Nanotechnology, 1, 286-290. http://dx.doi.org/10.1166/jbn.2005.046
- Abdullayev, E., Price, R., Shchukin, D. and Lvov, Y. (2009) Halloysite Tubes as Nanocontainers for Anticorrosion Coating with Benzotriazole. ACS Applied Materials & Interfaces, 1, 1437-1443. http://dx.doi.org/10.1021/am9002028
- Veerabadran, N.G., Price, R.R. and Lvov, Y.M. (2007) Clay Nanotubes for Encapsulation and Sustained Release of Drugs. NANO, 2, 115. http://dx.doi.org/10.1142/S1793292007000441
- Prow, T.W., Kotov, N.A., Lvov, Y.M., Rijnbrand, R. and Leary, J.F. (2004) Nanoparticles, Molecular Biosensors, and Multispectral Confocal Microscopy. Journal of Molecular Histology, 35, 555-564. http://dx.doi.org/10.1007/s10735-004-2196-4
- Vergaro, V., Scarlino, F., Bellomo, C., Rinaldi, R., Vergara, D., Maffia, M., et al. (2011) Drug-Loaded Polyelectrolyte Microcapsules for Sustained Targeting of Cancer Cells. Advanced Drug Delivery Reviews, 63, 847-864. http://dx.doi.org/10.1016/j.addr.2011.05.007
- Abdullayev, E., Sakakibara, K., Okamoto, K., Wei, W., Ariga, K. and Lvov, Y. (2011) Natural Tubule Clay Template Synthesis of Silver Nanorods for Antibacterial Composite Coating. ACS Applied Materials & Interfaces, 3, 4040-4046. http://dx.doi.org/10.1021/am200896d
- Abdullayev, E. and Lvov, Y.M. (2011) Halloysite Clay Nanotubes for Controlled Release of Protective Agents. Journal of Nanoscience and Nanotechnology, 11, 10007-10026. http://dx.doi.org/10.1166/jnn.2011.5724
- Zhai, R., Zhang, B., Liu, L., Xie, Y., Zhang, H. and Liu, J. (2010) Immobilization of Enzyme Biocatalyst on Natural Halloysite Nanotubes. Catalysis Communications, 12, 259-263. http://dx.doi.org/10.1016/j.catcom.2010.09.030
- Levis, S.R. and Deasy, P.B. (2003) Use of Coated Microtubular Halloysite for the Sustained Release of Diltiazem Hydrochloride and Propranolol Hydrochloride. International Journal of Pharmaceutics, 253, 145-157. http://dx.doi.org/10.1016/S0378-5173(02)00702-0
- Levis, S.R. and Deasy, P.B. (2002) Characterisation of Halloysite for Use as a Microtubular Drug Delivery System. International Journal of Pharmaceutics, 243, 125-134. http://dx.doi.org/10.1016/S0378-5173(02)00274-0
- Kelly, H.M., Deasy, P.B., Ziaka, E. and Claffey, N. (2004) Formulation and Preliminary in Vivo Dog Studies of a Novel Drug Delivery System for the Treatment of Periodontitis. International Journal of Pharmaceutics, 274, 167-183. http://dx.doi.org/10.1016/j.ijpharm.2004.01.019
- Li, G.L., Zheng, Z., Möhwald, H. and Shchukin, D.G. (2013) Silica/Polymer Double-Walled Hybrid Nanotubes: Synthesis and Application as Stimuli-Responsive Nanocontainers in Self-Healing Coatings. ACS Nano, 7, 2470-2478. http://dx.doi.org/10.1021/nn305814q
- Abdullayev, E. and Lvov, Y. (2010) Clay Nanotubes for Corrosion Inhibitor Encapsulation: Release Control with End Stoppers. Journal of Materials Chemistry, 20, 6681-6687. http://dx.doi.org/10.1039/c0jm00810a
- Zhao, Y., Abdullayev, E., Vasiliev, A. and Lvov, Y. (2013) Halloysite Nanotubule Clay for Efficient Water Purification. Journal of Colloid and Interface Science, 406, 121-129. http://dx.doi.org/10.1016/j.jcis.2013.05.072
- Cavallaro, G., Donato, D.I., Lazzara, G. and Milioto, S. (2011) Films of Halloysite Nanotubes Sandwiched between Two Layers of Biopolymer: From the Morphology to the Dielectric, Thermal, Transparency, and Wettability Properties. The Journal of Physical Chemistry C, 115, 20491-20498.
- Hashemifard, S.A., Ismail, A.F. and Matsuura, T. (2011) Mixed Matrix Membrane Incorporated with Large Pore Size Halloysite Nanotubes (HNT) as Filler for Gas Separation: Experimental. Journal of Colloid and Interface Science, 359, 359-370. http://dx.doi.org/10.1016/j.jcis.2011.03.077
- Macevan, D.M.C. (1946) Halloysite-Organic Complexes. Nature, 157, 159-160. http://dx.doi.org/10.1038/157159b0
- Liu, W., Chaurand, P., Di Giorgio, C., De Méo, M., Thill, A., Auffan, M., et al. (2012) Influence of the Length of Imogolite-Like Nanotubes on Their Cytotoxicity and Genotoxicity toward Human Dermal Cells. Chemical Research in Toxicology, 25, 2513-2522.
- Rasul, J.S. (2004) Chip on Paper Technology Utilizing Anisotropically Conductive Adhesive for Smart Label Applications. Microelectronics Reliability, 44, 135-140. http://dx.doi.org/10.1016/S0026-2714(03)00240-3
- Joussein, E., Petit, S., Churchman, J., Theng, B., Righi, D. and Delvaux, B. (2005) Halloysite Clay Minerals―A Review. Clay Minerals, 40, 383-426. http://dx.doi.org/10.1180/0009855054040180
- Tari, G., Bobos, I., Gomes, C. and Ferreira, J. (1999) Modification of Surface Charge Properties during Kaolinite to Halloysite-7Å Transformation. Journal of Colloid and Interface Science, 210, 360-366. http://dx.doi.org/10.1006/jcis.1998.5917
- Burke, T.G., Singh, A. and Yager, P. (1987) Entrapment of 6-Carboxyfluorescein within Cylindrical Phospholipid Microstructures. Annals of the New York Academy of Sciences, 507, 330-333. http://dx.doi.org/10.1111/j.1749-6632.1987.tb45812.x
- Kamble, R., Ghag, M., Gaikawad, S. and Panda, B.K. (2012) Halloysite Nanotubes and Applications: A Review. Journal of Advanced Scientific Research, 3, 25-59.
- Yang, Y., He, Q., Duan, L. and Li, J.B. (2007) Assembled Alginate/Chitosan Nanotubes for Biological Application. Biomaterials, 18, 3083-3090. http://dx.doi.org/10.1016/j.biomaterials.2007.03.019
- Ariga, K., Lvov, Y.M., Kawakami, K., Ji, Q. and Hill, J.P. (2011) Layer-by-Layer Self-Assembled Shells for Drug Delivery. Advanced Drug Delivery Reviews, 63, 762-771. http://dx.doi.org/10.1016/j.addr.2011.03.016
- Liu, P. and Zhao, M. (2009) Silver Nanoparticle Supported on Halloysite Nanotubes Catalyzed Reduction of 4-Nitro- phenol (4-NP). Applied Surface Science, 255, 3989-3993. http://dx.doi.org/10.1016/j.apsusc.2008.10.094
- Liu, M., Guo, B., Zou, Q., Du, M. and Jia, D. (2008) Interactions between Halloysite Nanotubes and 2,5-Bis(2-benzo- xazolyl) Thiophene and Their Effects on Reinforcement of Polypropylene/Halloysite Nanocomposites. Nanotechnology, 19, Article ID: 205709. http://dx.doi.org/10.1088/0957-4484/19/20/205709
- Giri, S., Trewyn, B.G., Stellmaker, M.P. and Lin, V.S.Y. (2005) Stimuli-Responsive Controlled-Release Delivery System Based on Mesoporous Silica Nanorods Capped with Magnetic Nanoparticles. Angewandte Chemie International Edition, 44, 5038-5044. http://dx.doi.org/10.1002/anie.200501819
- Cavallaro, G., Lazzara, G., Milioto, S., Palmisano, G. and Parisi, F. (2014) Halloysite Nanotube with Fluorinated Lumen: Non-Foaming Nanocontainer for Storage and Controlled Release of Oxygen in Aqueous Media. Journal of Colloid and Interface Science, 417, 66-71. http://dx.doi.org/10.1016/j.jcis.2013.11.026
- Cı́rkva, V., Polák, R., Paleta, O., Kefurt, K., Moravcová, J., Kodı́ček, M. and Forman, S. (2004) Novel Perfluoroalkylated Derivatives of D-Galactopyranose and Xylitol for Biomedical Uses. Hemocompatibility and Effect on Perfluorocarbon Emulsions. Carbohydrate Research, 339, 2177-2185. http://dx.doi.org/10.1016/j.carres.2004.06.019
- Abdullayev, E., Joshi, A., Wei, W., Zhao, Y. and Lvov, Y. (2012) Enlargement of Halloysite Clay Nanotube Lumen by Selective Etching of Aluminum Oxide. ACS Nano, 6, 7216-7226. http://dx.doi.org/10.1021/nn302328x
- Borgis, D. and Vuilleumier, R. (2000) Transport and Infrared Spectroscopy of the Hydrated Proton. Abstracts of Papers of the American Chemical Society, 220, U191-U191.
- Afanasiev, A. and Minogin, V. (2010) van der Waals Interaction of an Atom with the Internal Surface of a Hollow Submicrometer-Size Cylinder. Physical Review A, 82, Article ID: 052903. http://dx.doi.org/10.1103/PhysRevA.82.052903
- Tjatjopoulos, G.J., Feke, D.L. and Mann, J.A. (1988) Molecule-Micropore Interaction Potentials. The Journal of Physical Chemistry, 92, 4006-4007. http://dx.doi.org/10.1021/j100324a063
- Pujar, N.S. and Zydney, A.L. (1997) Charge Regulation and Electrostatic Interactions for a Spherical Particle in a Cylindrical Pore. Journal of Colloid and Interface Science, 192, 338-349. http://dx.doi.org/10.1006/jcis.1997.5017
- Bowen, W.R., Filippov, A.N., Sharif, A.O. and Starov, V.M. (1999) A Model of the Interaction between a Charged Particle and a Pore in a Charged Membrane Surface. Advances in Colloid and Interface Science, 81, 35-72. http://dx.doi.org/10.1016/S0001-8686(99)00004-4
- Jones, J.E. (1924) On the Determination of Molecular Fields. II. From the Equation of State of a Gas. Proceedings of the Royal Society A: Mathematical, Physical and Engineering Sciences, 106, 463-477. http://dx.doi.org/10.1098/rspa.1924.0082
- Zhang, L. and Winkler, P. (2006) Debye-Hückel Screening and Fluctuations. Chemical Physics, 329, 338-342. http://dx.doi.org/10.1016/j.chemphys.2006.07.031
- Russel, W.B., Saville, D.A. and Schowalter, W.R. (1989) Colloidal Dispersions. Journal of Fluid Mechanics, 222, 692- 694. http://dx.doi.org/10.1017/S0022112091211271
- Chapman, S. and Cowling, T.G. (1991) The Mathematical Theory of Non-Uniform Gases. Cambridge University Press, Cambridge.
- Waugh, A. and Grant, A., Eds. (2007) Anatomy and Physiology in Health and Illness. 10th Edition, Churchill Livingstone Elsevier, London.
- Wenbo, W. (2013) Halloysite Nanotube Composites for Sustained Release of Antimocrobial Agents (Antiseptics and Antibiotics. PhD Thesis, Louisiana Tech University, Ruston. (Retrieved from ProQuest Dissertations and Theses, Accession Order No. AAT 3580371)
- Bordeepong, S., Bhongsuwan, D., Pungrassami, T. and Bhongsuwan, T. (2011) Characterization of Halloysite from Thung Yai District, Nakhon Si Thammarat Province, in Southern Thailand. Songklanakarin Journal of Science & Technology, 33, 599-607.
- Patterson, S.H. and Murray, H.H. (1984) Kaolin, Refractory Clay, Ball Clay, and Halloysite in North America, Hawaii, and the Caribbean Region. US Department of the Interior, Geological Survey, For Sale by the Distribution Branch, USGS, Alexandria.
- Theng, B.K.G., Russell, M., Churchman, G.J. and Parfitt, R.L. (1982) Surface Properties of Allophane, Halloysite, Imogolite. Clays and Clay Minerals, 30, 143-149. http://dx.doi.org/10.1346/CCMN.1982.0300209
- Kaufhold, S., Kaufhold, A., Jahn, R., Brito, S., Dohrmann, R., Hoffmann, R., et al. (2009) A New Massive Deposit of Allophane Raw Material in Ecuador. Clays and Clay Minerals, 57, 72-81.
- Nagarajan, R., Ed. (2012) Nanomaterials for Biomedicine. Vol. 1119, American Chemical Society. http://dx.doi.org/10.1021/bk-2012-1119
- Korsmeyer, R.W., Gurny, R., Doelker, E., Buri, P. and Peppas, N.A. (1983) Mechanisms of Solute Release from Porous Hydrophilic Polymers. International Journal of Pharmaceutics, 15, 25-35. http://dx.doi.org/10.1016/0378-5173(83)90064-9
- Phaechamud, T., Koizumi, T. and Ritthidej, G.C. (2000) Chitosan Citrate as Film Former: Compatibility with Water- Soluble Anionic Dyes and Drug Dissolution from Coated Tablet. International Journal of Pharmaceutics, 198, 97-111. http://dx.doi.org/10.1016/S0378-5173(99)00460-3
- Joshi, A., Montes, C., Salehi, S., Allouche, E. and Lvov, Y. (2014) Optimization of Geopolymer Properties by Coating of Fly-Ash Microparticles with Nanoclays. Journal of Inorganic and Organometallic Polymers and Materials, 25, 1- 11.
NOTES

*Corresponding author.