Journal of Analytical Sciences, Methods and Instrumentation
Vol.3 No.4(2013), Article ID:38329,48 pages DOI:10.4236/jasmi.2013.34028
A New SPME Thermal Desorption Interface for HPLC
![]()
1Department of Analytical Chemistry, Faculty of Chemistry, Complutense University of Madrid, Madrid, Spain; 2Mass Spectrometry Unit, Faculty of Chemistry, Complutense University of Madrid, Madrid, Spain.
Email: Kayali@ucm.es
Copyright © 2013 John Jairo Ríos Acevedo et al. This is an open access article distributed under the Creative Commons Attribution License, which permits unrestricted use, distribution, and reproduction in any medium, provided the original work is properly cited.
Received September 11th, 2013; revised October 12th, 2013; accepted October 18th, 2013
Keywords: SPME-HPLC-FLD; SPME-HPLC Interface; Polynuclear Aromatic Hydrocarbons
ABSTRACT
A new SPME/HPLC interface is developed. It is based on thermal desorption from the SPME fiber and organic solvent collection of the desorbed analytes by sweeping them with an argon flow into a small organic solvent volume which is further injected into the HPLC chromatograph. Extraction and desorption parameters were investigated using five PAHs of different volatilities (naphthalene, acenaphthalene, fluorene, phenanthrene and anthracene) as test compounds and fluorimetric detection. Regression coefficients closed to 0.99 with RDS < 14% (n = 3) and detection limits in the range 0.07 - 0.99 µg∙L−1 were found. A method was applied to determine the above PAHs in water samples. The results were compared with those supplied by the 550.1 EPA method showing the agreement of both methods at the 0.05 significance level.
1. Introduction
Development of rapid and efficient sample preparation methods for chromatographic analysis continues to be a challenge today. Ideally, sample preparation involves preconcentration and clean up with minimum steps to prevent contamination, to decrease costs, analysis time and lost of the analytes [1]. In this context, solid phase extraction (SPE) is now a general and well established technique introducing clear advantages over old liquidliquid extraction [2-5]. However, this technique is generally time-consuming and requires large amounts of organic solvents [6,7].
More recently, Pawliszyn introduced solid phase microextraction (SPME) which is a quite elegant technique; it essentially integrates preconcentration and clean up in a single step [8-10]. Two basic types of sampling extraction modes into the fiber can be performed using SPME; direct extraction and headspace extraction (HS), which is also named HS-SPME [11-14]. In direct sampling extraction, the fiber is directly immersed into the liquid or gaseous sample while in HS-SPME, the fiber is suspended in the head space above the sample [14].
Initially, analytes desorption from the fiber was made thermally in the gas chromatograph (GC) injection port and then GC was continued in the usual way [1,9,15-18]. Consequently, most of the SPME methods involve GC and GC combined with Mass Spectrometry (MS). Desorption could also be made by solvent extraction which gave rise to an off-line interface with high performance liquid chromatograph (HPLC) to analyze compounds of different volatility [11,14,15,19]; or a heated liquid flow through interface has also been used [20]. These interfaces consisted of a chamber installed in place of the HPLC six-port valve injection loop; the analytes retained in the fiber were desorbed in static and/or dynamic mode. In the static mode an organic solvent was added into the desorption chamber settling the solvent in contact with the fiber during a suitable time; the analytes extracted into the solvent were further injected into the HPLC analytical column. Alternatively, the dynamic desorption involves passing the mobile phase through the desorption chamber at the working flow rate [21] and further injection into HPLC, an exhaustive review about this subject has been published [22]; some applications of this interface has been described [5,23]. The fiber should be carefully handled because of its fragility and it can be easily broken, mainly during insertion into the desorption chamber [11]; we have also detected problems due to the introduction of air bubbles when the fiber was placed inside the interface; moreover, the organic solvents, or the mobile phase, damage the fiber coating decreasing its life time [14,24]. To date, no interface device design has proven to be optimal [25].
In this paper, an off-line SPME/HPLC interface is developed using old model of SPME fiber cleaner Nurka 390 [26]; analytes desorption from the fiber is made thermally preventing the contact of the fiber with the organic solvent. Desorbed analytes were flowed into a micro tube containing a small organic solvent volume which was then injected into the HPLC chromatograph. Several polynuclear aromatic hydrocarbons (PAHs) of different volatilities (considered as semivolatile compounds) were used as test analytes; the reason for this test compounds selection was that their sensibility by HPLC with fluorimetric detection can compete with GC techniques.
2. Experimental
2.1. Instrumental
PAHs analysis was carried out on a HPLC system which included an Agilent 1100 series HPLC-pump, a column oven with a temperature control module that allowed thermostatation at 35˚C (± 0.5˚C); a six-port Rheodyne 7125 manual injector with a 50 µl loop for partial filling injection and an Agilent 1100 series programmable fluorescence detector were also used. All the separations were carried out on a bonded phase specific for PAHs, Phenomenex Envirosep PP column (125 × 4.6 mm). The gradient started with 55:45 water:acetronitrile (v:v) during 2 minutes; next the acetonitrile content was increased to 90% in 25 minutes and returned to the initial composition after 15 minutes; the mobile phase flow rate was 1.0 ml∙min−1.
The column temperature was maintained at 35˚C. The following excitation (λex) and emission (λem) wavelength program was used for detection: naphthalene (λex 274 nm, λem 335 nm), acenaphthene, fluorene (λex 266 nm, λem 315 nm), phenanthrene (λex 249 nm, λem 365 nm) and anthracene (λex 251 nm, λem 420 nm).
Manual SPME commercially available 65 µm film thickness polydimethylsiloxane/divinylbencene (PDMS/ DVB) StableFlex fibers, from Supelco, were used; other fibers were also tested (PDMS-100 µm, PDMS-7 µm, PDMS/DVB-65 µm). An agitation platform (PSelecta Agimatic 243) and stirrer bars were used to stir the water sample. An ultrasonic bath (PSelecta 300512 Barcelona, Spain) was used to prepare standard solutions. An ice bath was employed to help during the analytes solvent collection step. The fiber holder was provided of rotation with a rotor device (Nurka 390, Madrid, Spain).
2.2. Thermal Desorption/Organic Solvent Collection Interface
A scheme of this interface (Nurka 390, Madrid, Spain) to desorb the analytes from the fiber and to dissolve them further into a small amount of an organic solvent is showed in Figure 1. Essentially, it consisted of a thermal desorption chamber, which is a hole in a hotter block heated electrically; temperature inside this hole can be controlled in the range 30˚C - 320˚C by means of a thermostat; a GC glass liner (NK 390 0171) was placed inside this hole in which the fiber is adjusted. An argon flow is passed through this glass liner which flow rate is controlled by a manometer. This glass liner is connected to a solvent collection cone bottom shaped micro glass tube (50 × 3 mm) using a 1/16" stainless steel tube ending close to its bottom; this micro tube was placed inside an ice bath.
2.3. Chemicals and Reagents
Methanol and acetonitrile were of HPLC purity obtained from Scharlau, Barcelona, Spain. Water was purified with a Milli-Q system (Millipore; Milford, MA). The 5 PAHs standards were from Sigma Aldrich (naphthalene, bp 218˚C; acenaphthene, bp 278˚C; fluorene, bp 295˚C; phenanthrene, bp 338˚C; anthracene, bp 340˚C) their purity being higher than 99.9%. Stock standard solutions were prepared from each PAH in methanol, at the following concentrations: naphthalene 676.8 mg·L−1, acenaphthene 807.3 mg·L−1, fluorene 498.9 mg·L−1, phenanthrene 437.1 mg·L−1 and anthracene 160.2 mg·L−1; this standard solutions were stored at 4˚C in 100 mL amber flasks. Fresh standard solutions containing the 5 PAHs mixture were prepared by diluting 250.0 µl naphthalene, 180.0 µl acenaphthene, 160.0 µl fluorene, 60.0 µl phenanthrene and 30.0 µl anthracene of the above PAH standards solutions into a 2.0 ml flask with methanol; these diluted standard solutions were homogenized in the ultrasonic bath for five minutes.
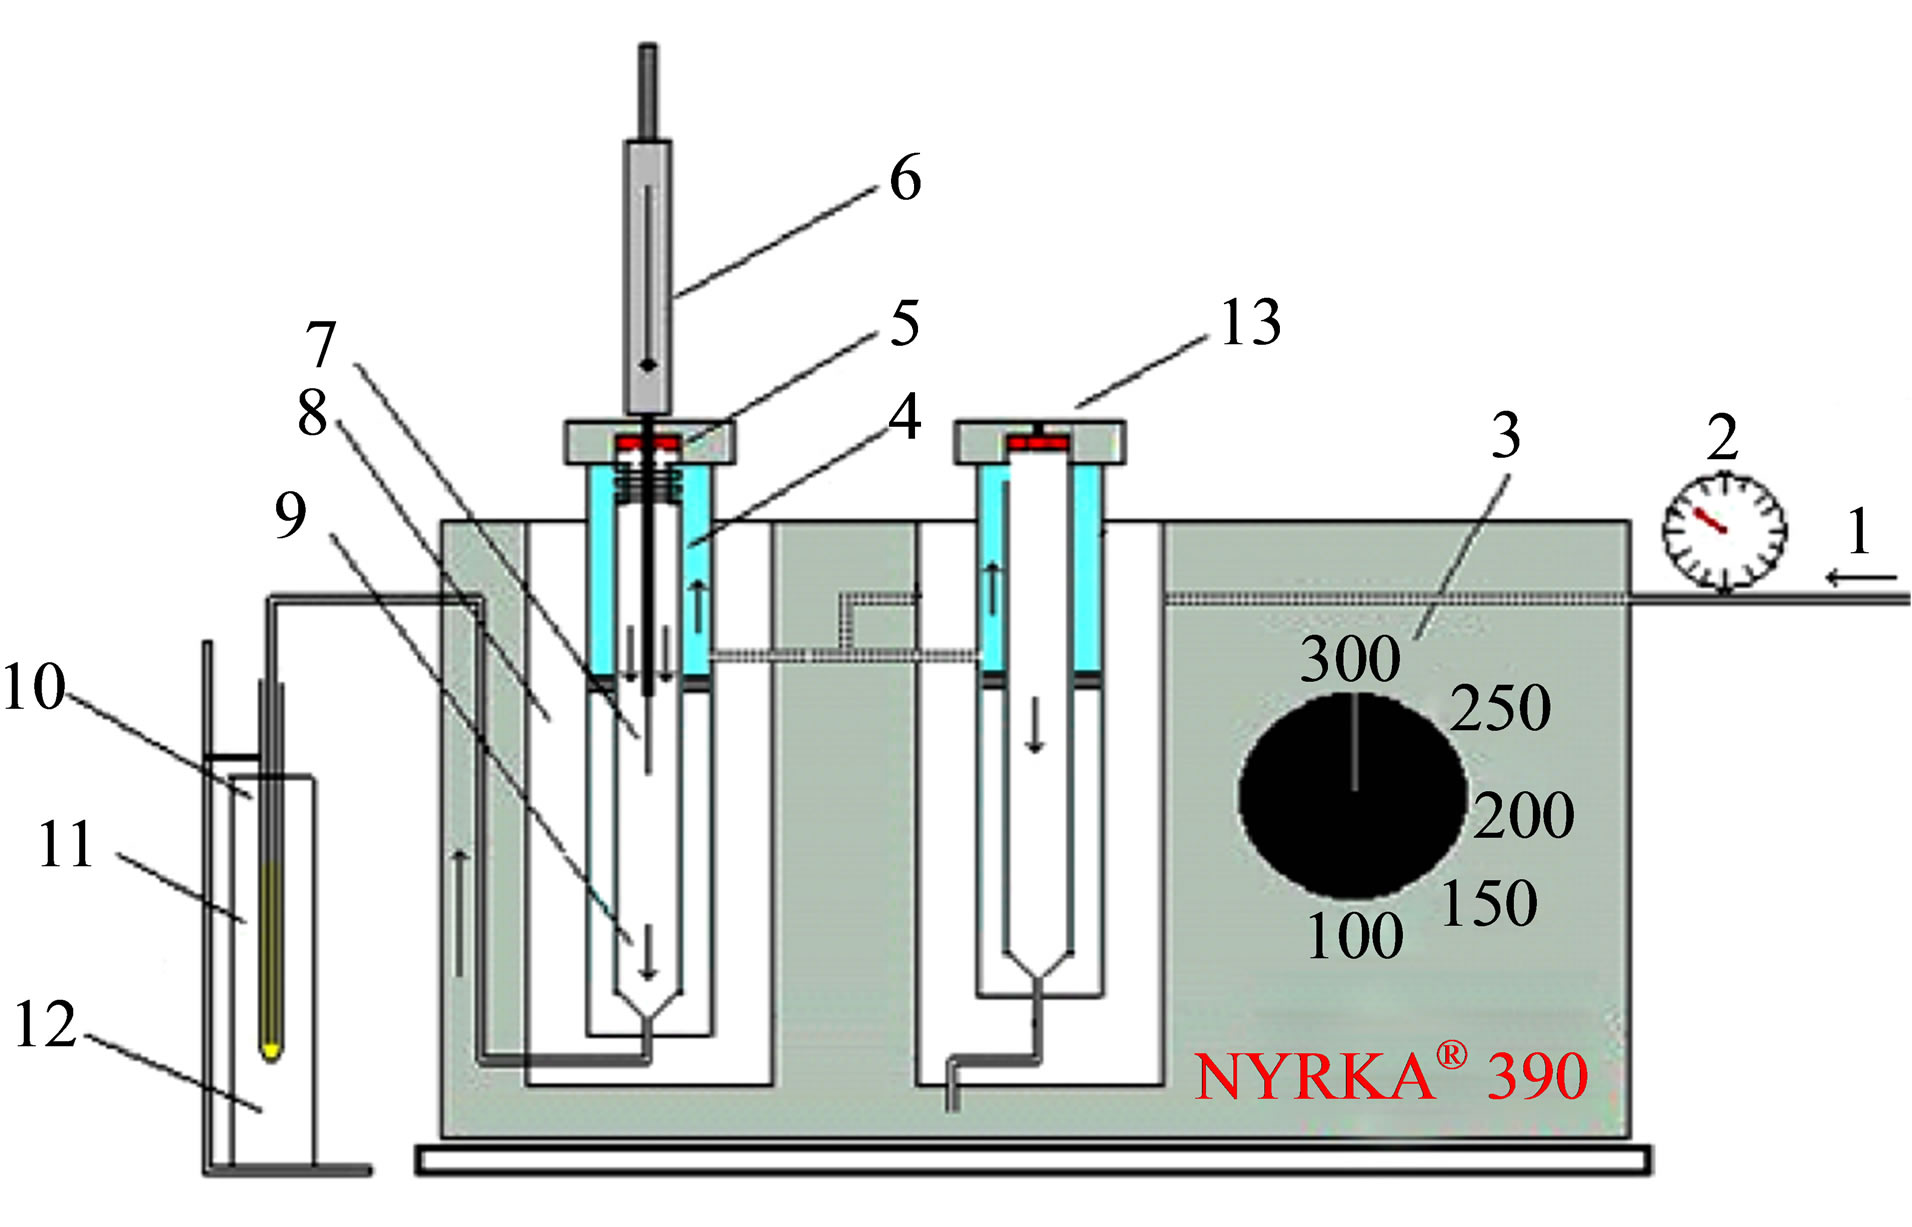
Figure 1. Scheme of the thermal desorption solvent collection interface; 1. Argon flow, 2. Manometer, 3. Temperature control, 4. Glass liner, 5. Septum, 6. SPME holder, 7. fiber, 8. Hotter block, 9. Argon flow direction, 10. Cone bottom shaped microtube, 11. Collecting solvent and 12. Ice baht.
2.4. Samples
A Milli-Q and a tap water sample from the Complutense University of Madrid (Faculty of Chemistry, Spain) as well as a drinking mineral water sample (available at the supermarket) were analyzed. Two water samples were taken from the Valdemayor reservoir and from Guadalix de la Sierra River in Madrid, respectively, in Pyrex borosilicate amber glass bottles and stored at 4˚C, protected from light, immediately after sampling.
2.5. SPME Procedure
2.5.1. Conditioning of the Fiber
Before being used, the 65 mm PDMS/DVB StableFlex fiber was conditioned for 1 h in the thermal desorption chamber under an argon stream at 280˚C and a flow rate of 30 mL·min−1. A fiber blank was registered daily.
2.5.2. Extraction Process
PAHs were extracted by direct immersion of the fiber into 100.0 ml of the water sample contained a beaker. The sample was stirred magnetically with a glass-coated stirrer at 3000 rpm during 90 min; the fiber was also rotated in opposite direction to the magnetic stirrer at 600 rpm using a rotor device. All extractions were carried out at room temperature (24˚C - 26˚C). After extraction the fiber was ready for thermal desorption.
2.5.3. Thermal Desorption/Analytes Collection
The fiber was placed inside the thermal desorption glass liner passing through it an argon flow of 7 ml/min at a temperature of 280˚C for 30 min. Afterwards, the fiber was removed and four aliquots of 10 ml methanol each 5 min were injected into this glass liner at the same temperature to sweep any PAHs residue condensed inside the connection tube. The analytes were collected in 50 ml of a 50:50 methanol:acetonitrile mixture placed inside the collection micro tube which was immersed in the ice bath. The volume of the analytical PAHs solution was decreased to 20 ml by using the same argon flow and the resulting total volume was then injected slowly into the HPLC injection valve.
2.5.4. Calibration Graphs
The external standard calibration method was applied as follow: 1000 ml of Milli-Q water were spiked with 20, 50, 100, 150 and 200 ml of the fresh PAHs standard solution mixture at concentration levels in the range 0.48 - 169.2 µg·L−1. The solid-phase microextraction and HPLC procedures were applied to analyze these standard samples. The results were adjusted by linear regression using the integrated peak areas. PAHs concentrations of PAHs in the water samples were determined by interpolation in the respective PAH calibration graphs.
3. Results and Discussion
3.1. Extraction Step
Extraction variables were studied by dipping the fiber in a milli-Q water sample spiked with a fresh standard solution PAHs mixture. A summary of the studied variables, changing systematically each one while keeping constant the rest of them, is shown in Table 1. The procedure specified in experimental was always applied. As Figure 2 shows, among the tested fibers, the one yielding the highest signal for this studied PAHs was based on PDMS/DVB StableFlex 65 µm, which suggested that hydrophobic and π - π interactions must be predominant; this one was chosen for further studies.
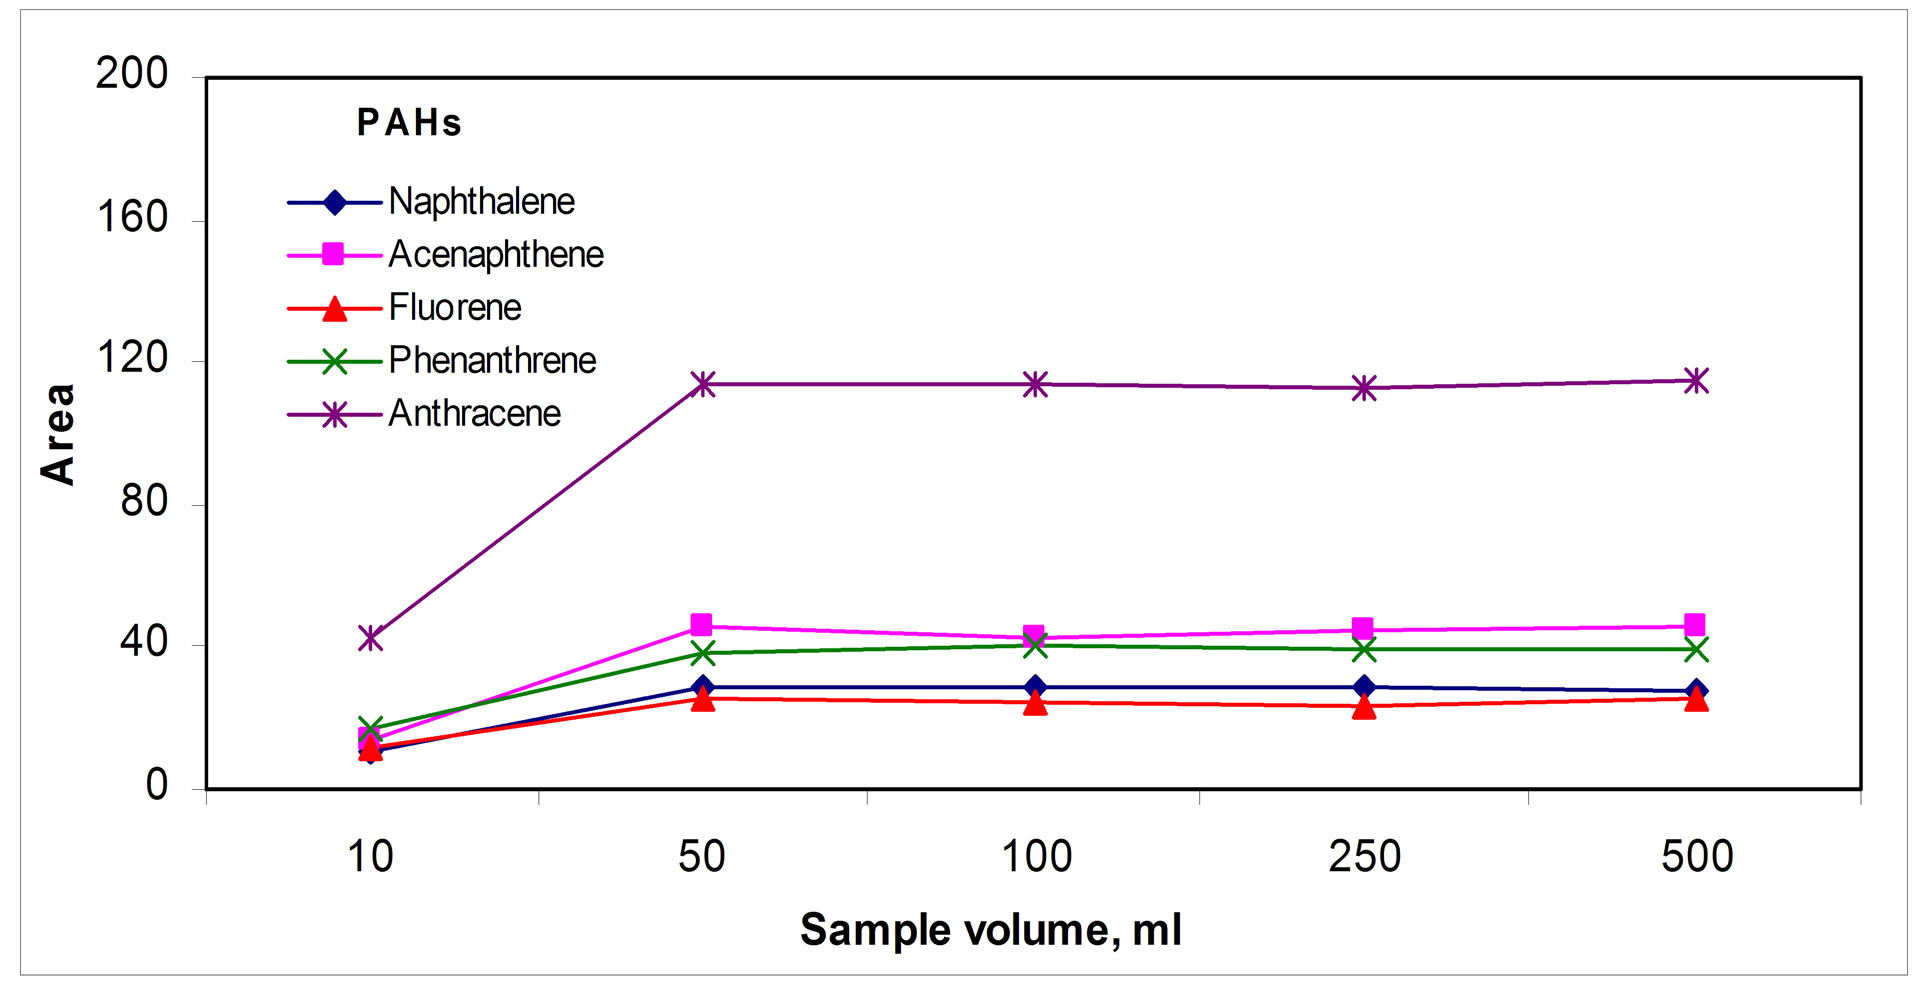
A sample volume of 100 mL was enough to give the highest PAHs signals; Figure 3(a) " target="_self">Figure 3(a) shows a typical saturation graph above this sample volume. Regarding the time necessary to get the fiber-sample equilibrium, times about 90 min were necessary; above these, maximum saturation signals seem to be obtained, Figure 3(b)" target="_self">Figure 3(b). Mass transfer into the fiber was favored by stirring the PAHs sample and rotting the fiber simultaneously in appositive way, as Figure 3(c)" target="_self">Figure 3(c) shows.
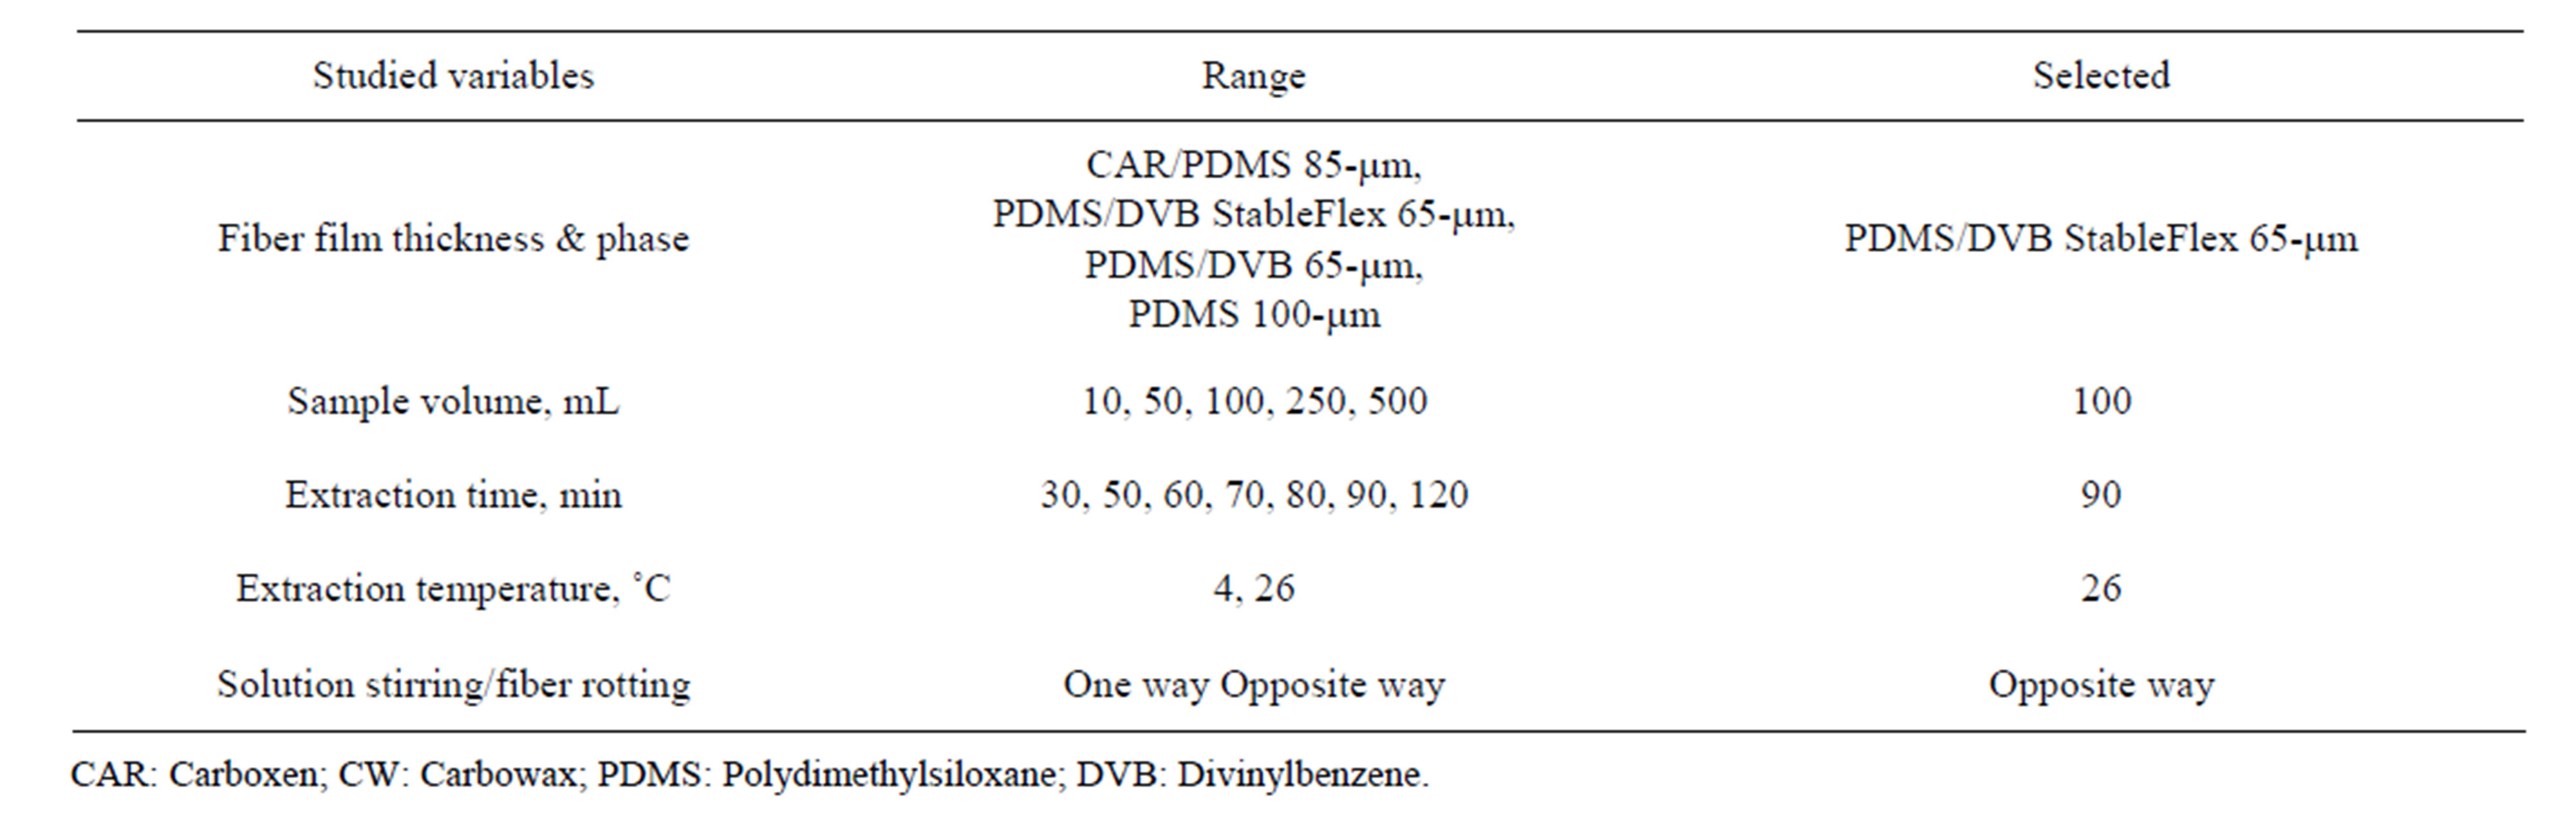
Table 1. Optimization of SPME extraction conditions.
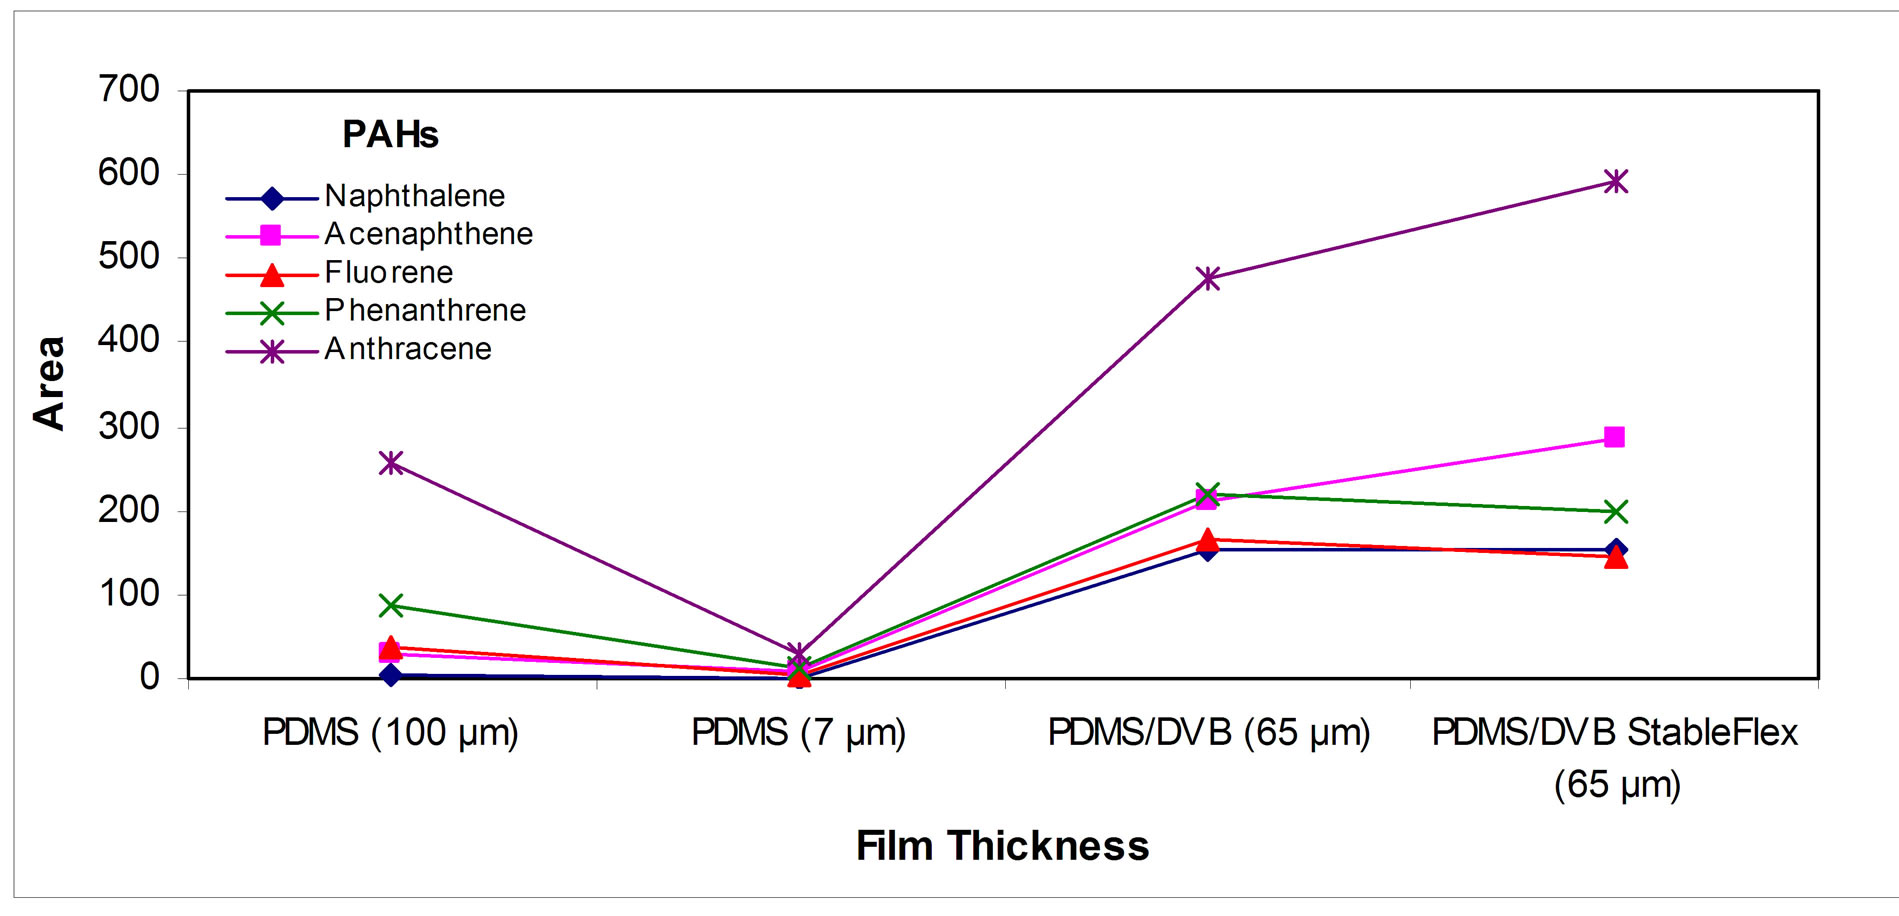
Figure 2. SPME fiber Selection.
 (a)
(a)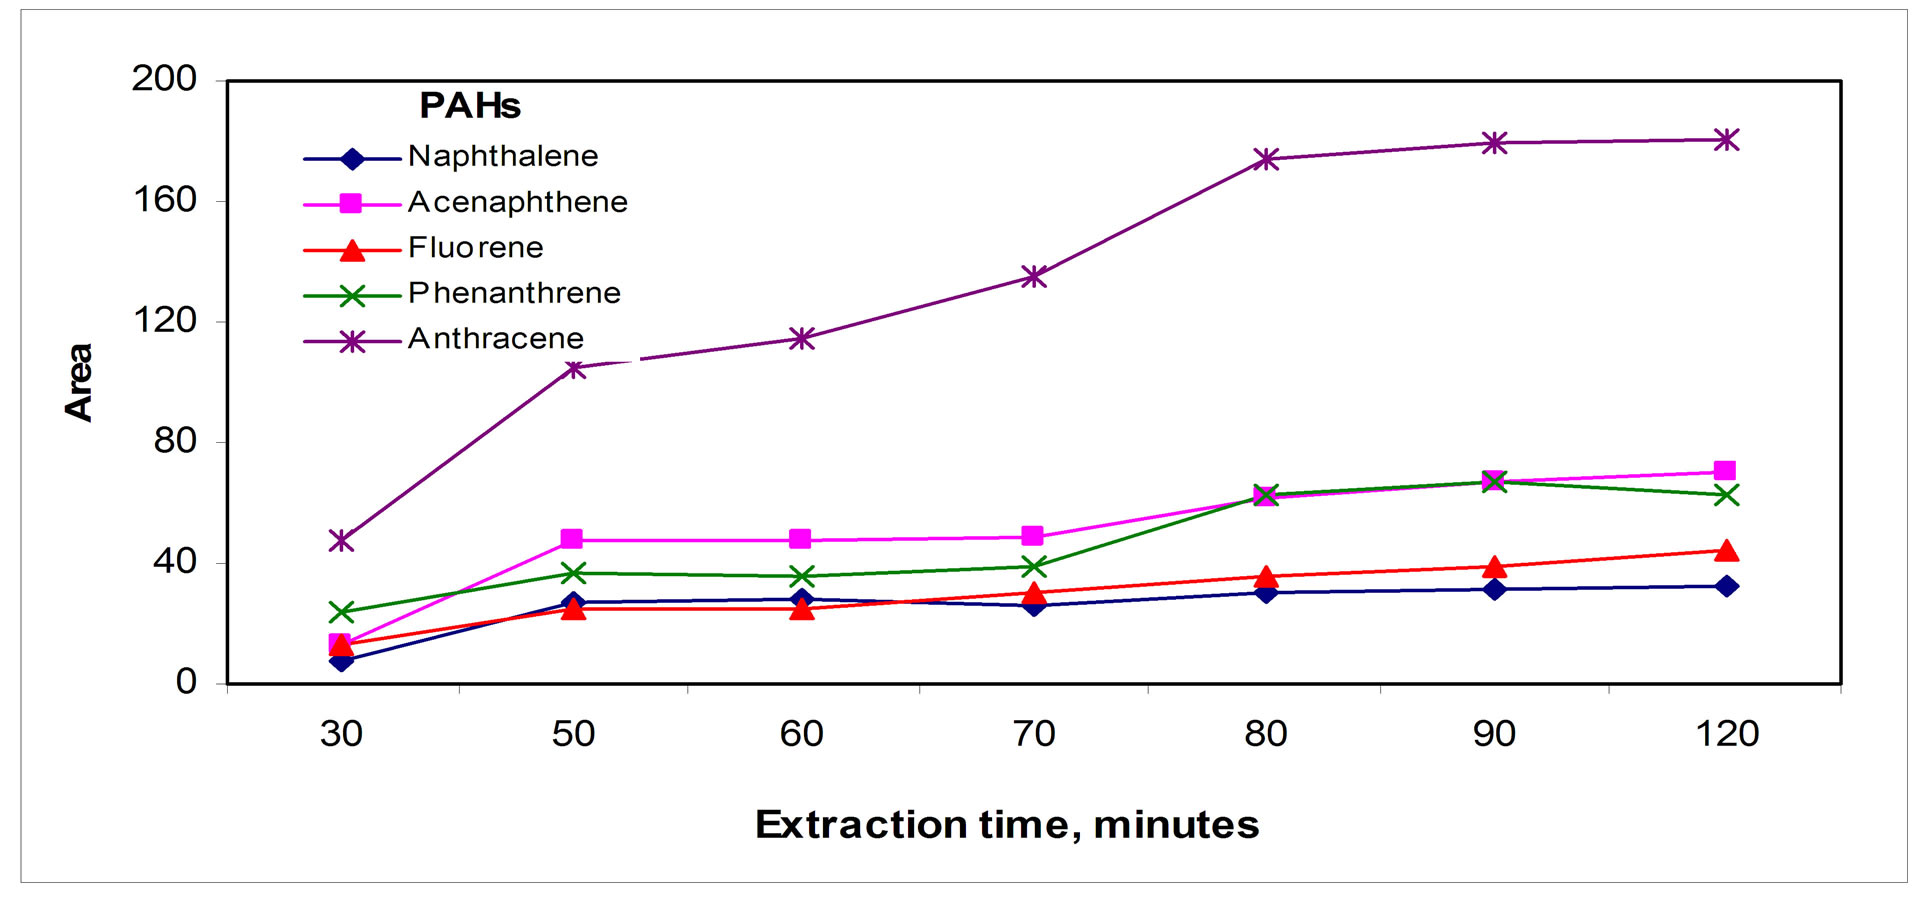 (b)
(b)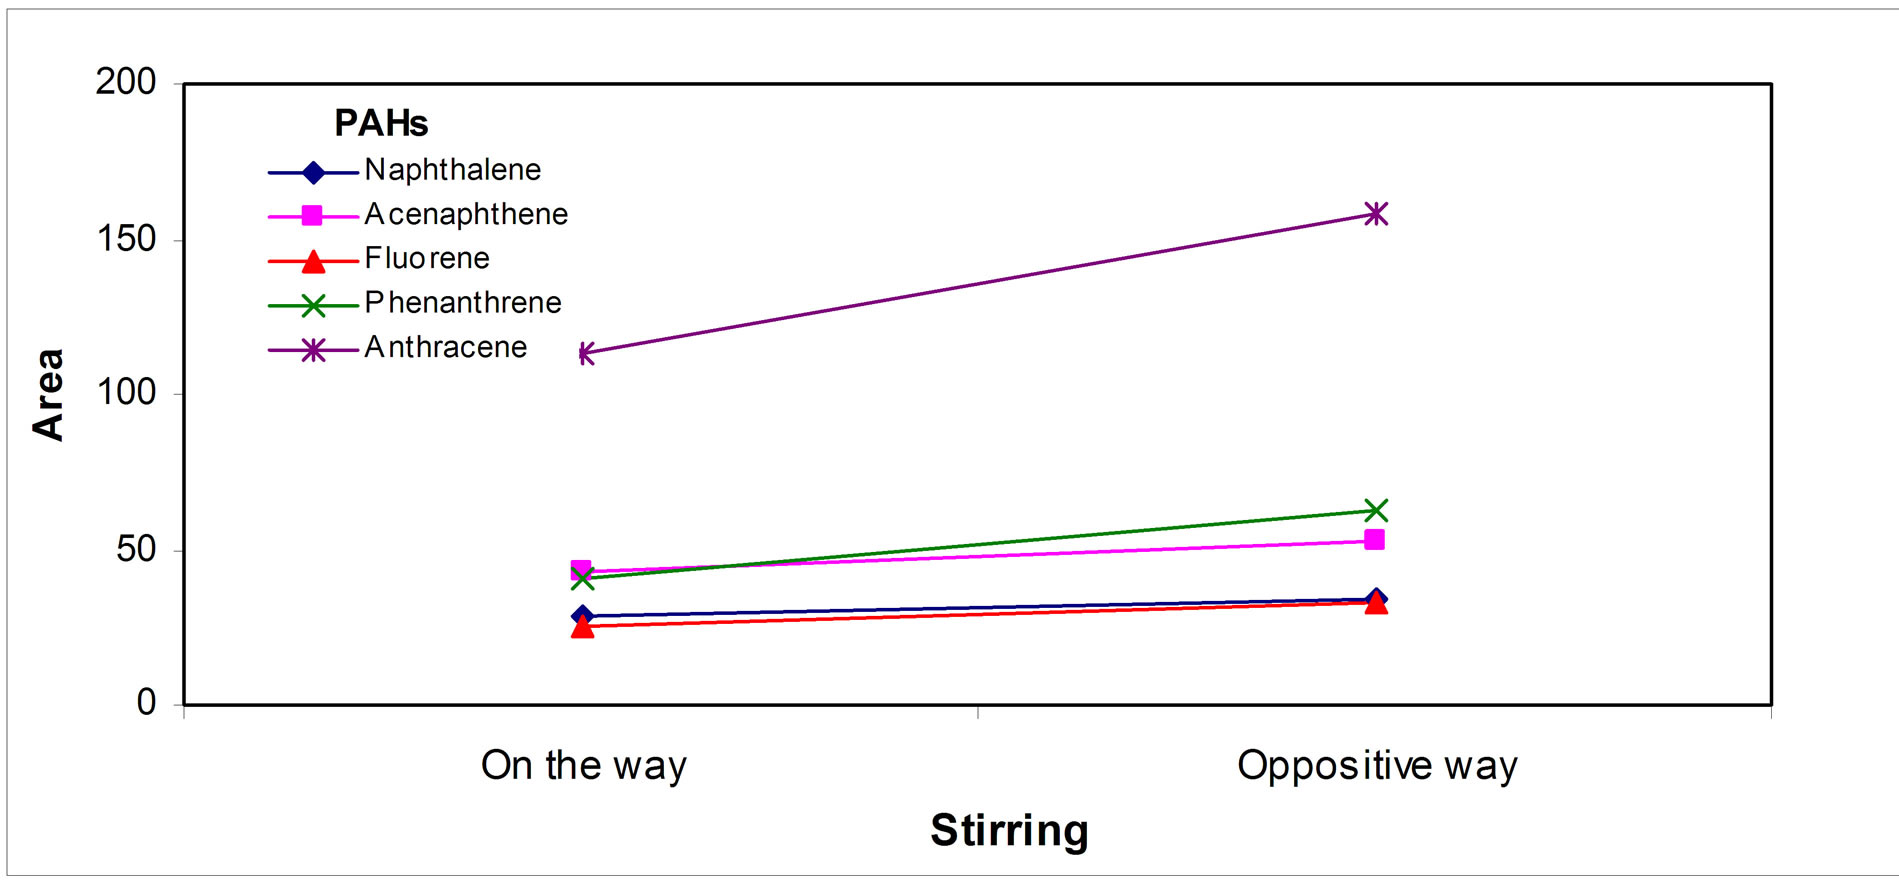 (c)
(c)
Figure 3. Extraction parameters effect: (a) Sample volume, (b) Time and (c) Sample solution stirring/fiber rotting.
3.2. Analytes Thermal Desorption and Organic Solvent Collection
After the extraction step, analytes extracted into the fiber were desorbed thermically using the new device and collected in a small organic solvent volume following the procedure specified in the experimental section. The effects of the different variables involved were studied; the range in which these variables were changed is showed in Table 2.
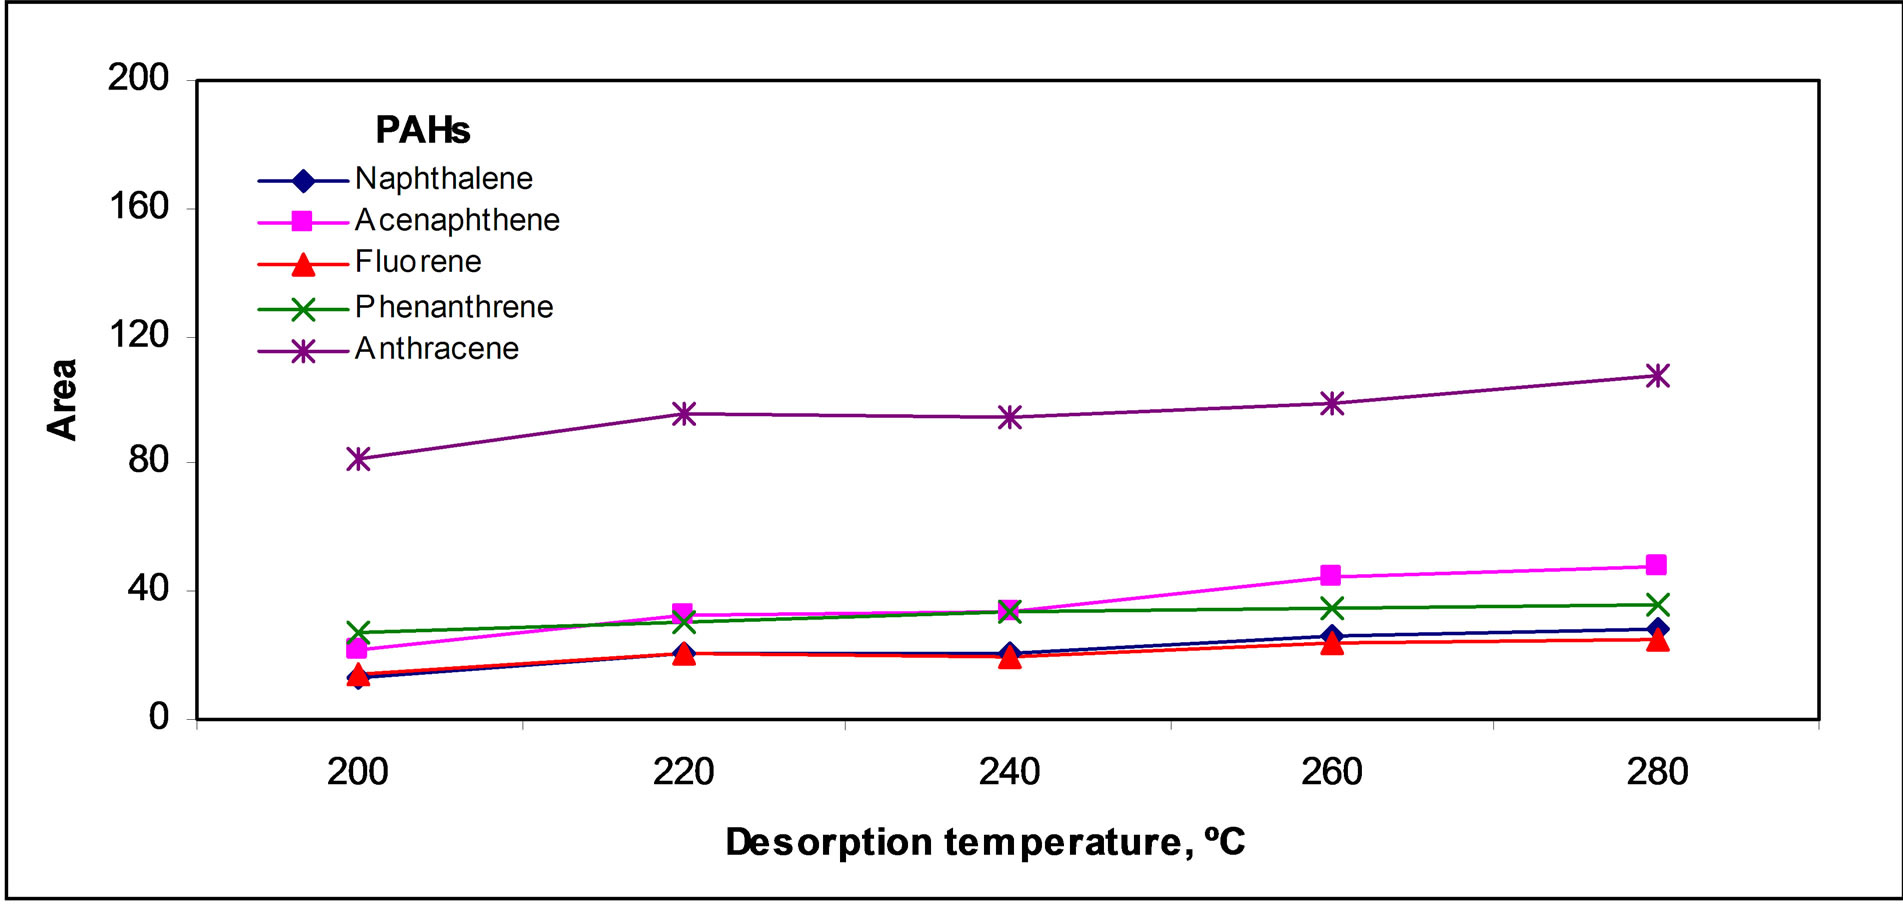
As Figure 4(a)" target="_self">Figure 4(a) shows signal increased slightly in the temperature range studied; so, a temperature of 280˚C was chosen to get the highest signal near to complete desorption.
Regarding desorption time, the shape of the profiles showed in Figure 4(b)" target="_self">Figure 4(b) seems to indicate that after reaching a steady state, small losses of analytes appear for high desorption times, which is can be due to analyte losses during the whole process.
The effect of argon flow rate in Figure 4(c)" target="_self">Figure 4(c) shows that an optimum value for flow rate about 7 mL/min appeared, indicating analytes losses for higher argon flow rates, which is quite obvious because high flow rates may both sweep the analytes and carry them away from the micro tube.
Regarding the shape of the collection tube, small and long tubes yielded the highest signals because they allowed better contact between the argon gas which
 (a)
(a)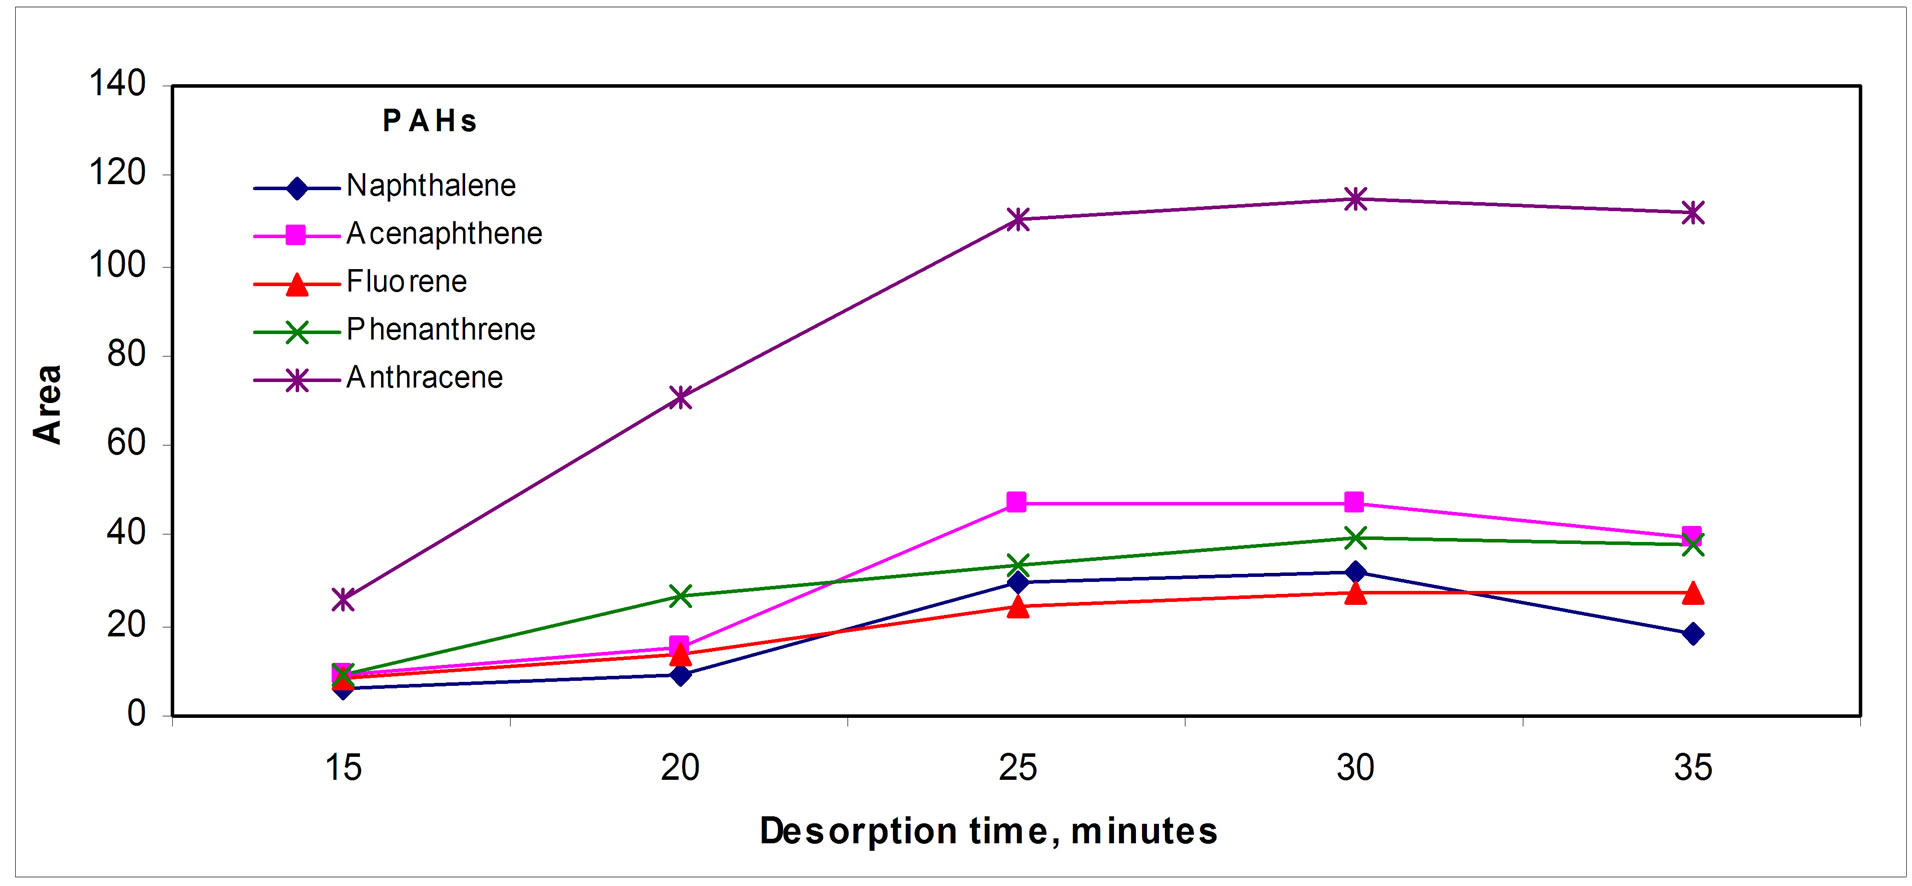 (b)
(b)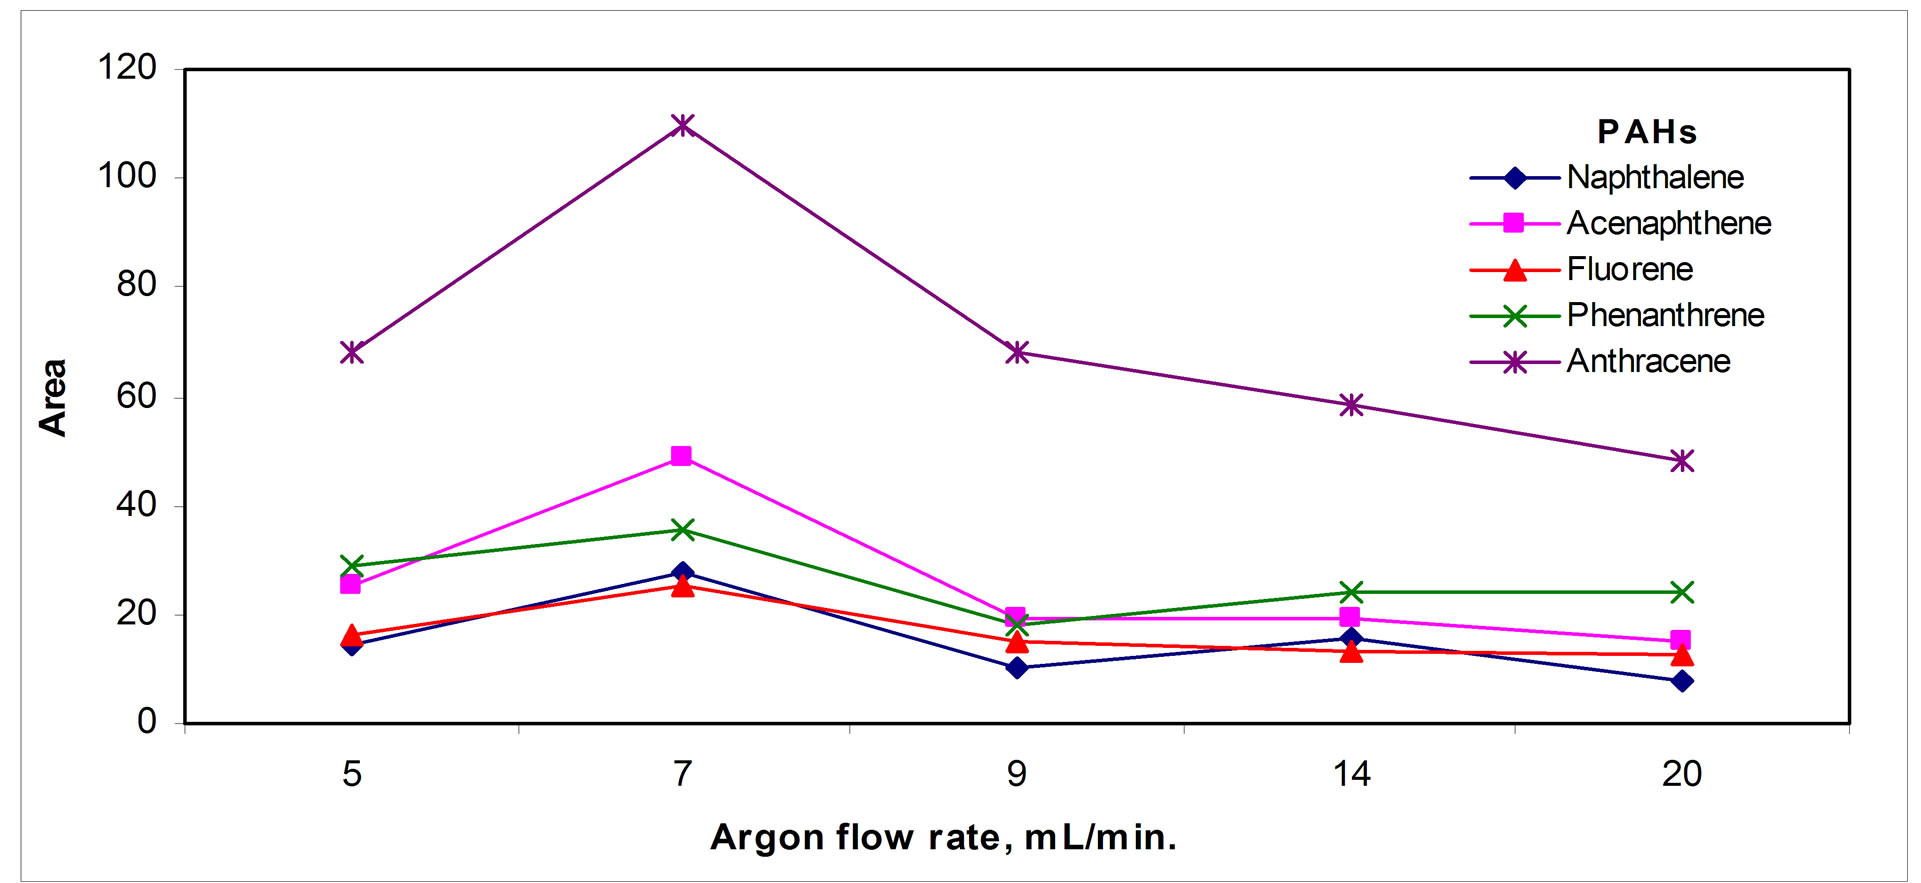 (c)
(c)
Figure 4. Desorption parameters effect: (a) Temperature, (b) Time and (c) Argon flow rate.
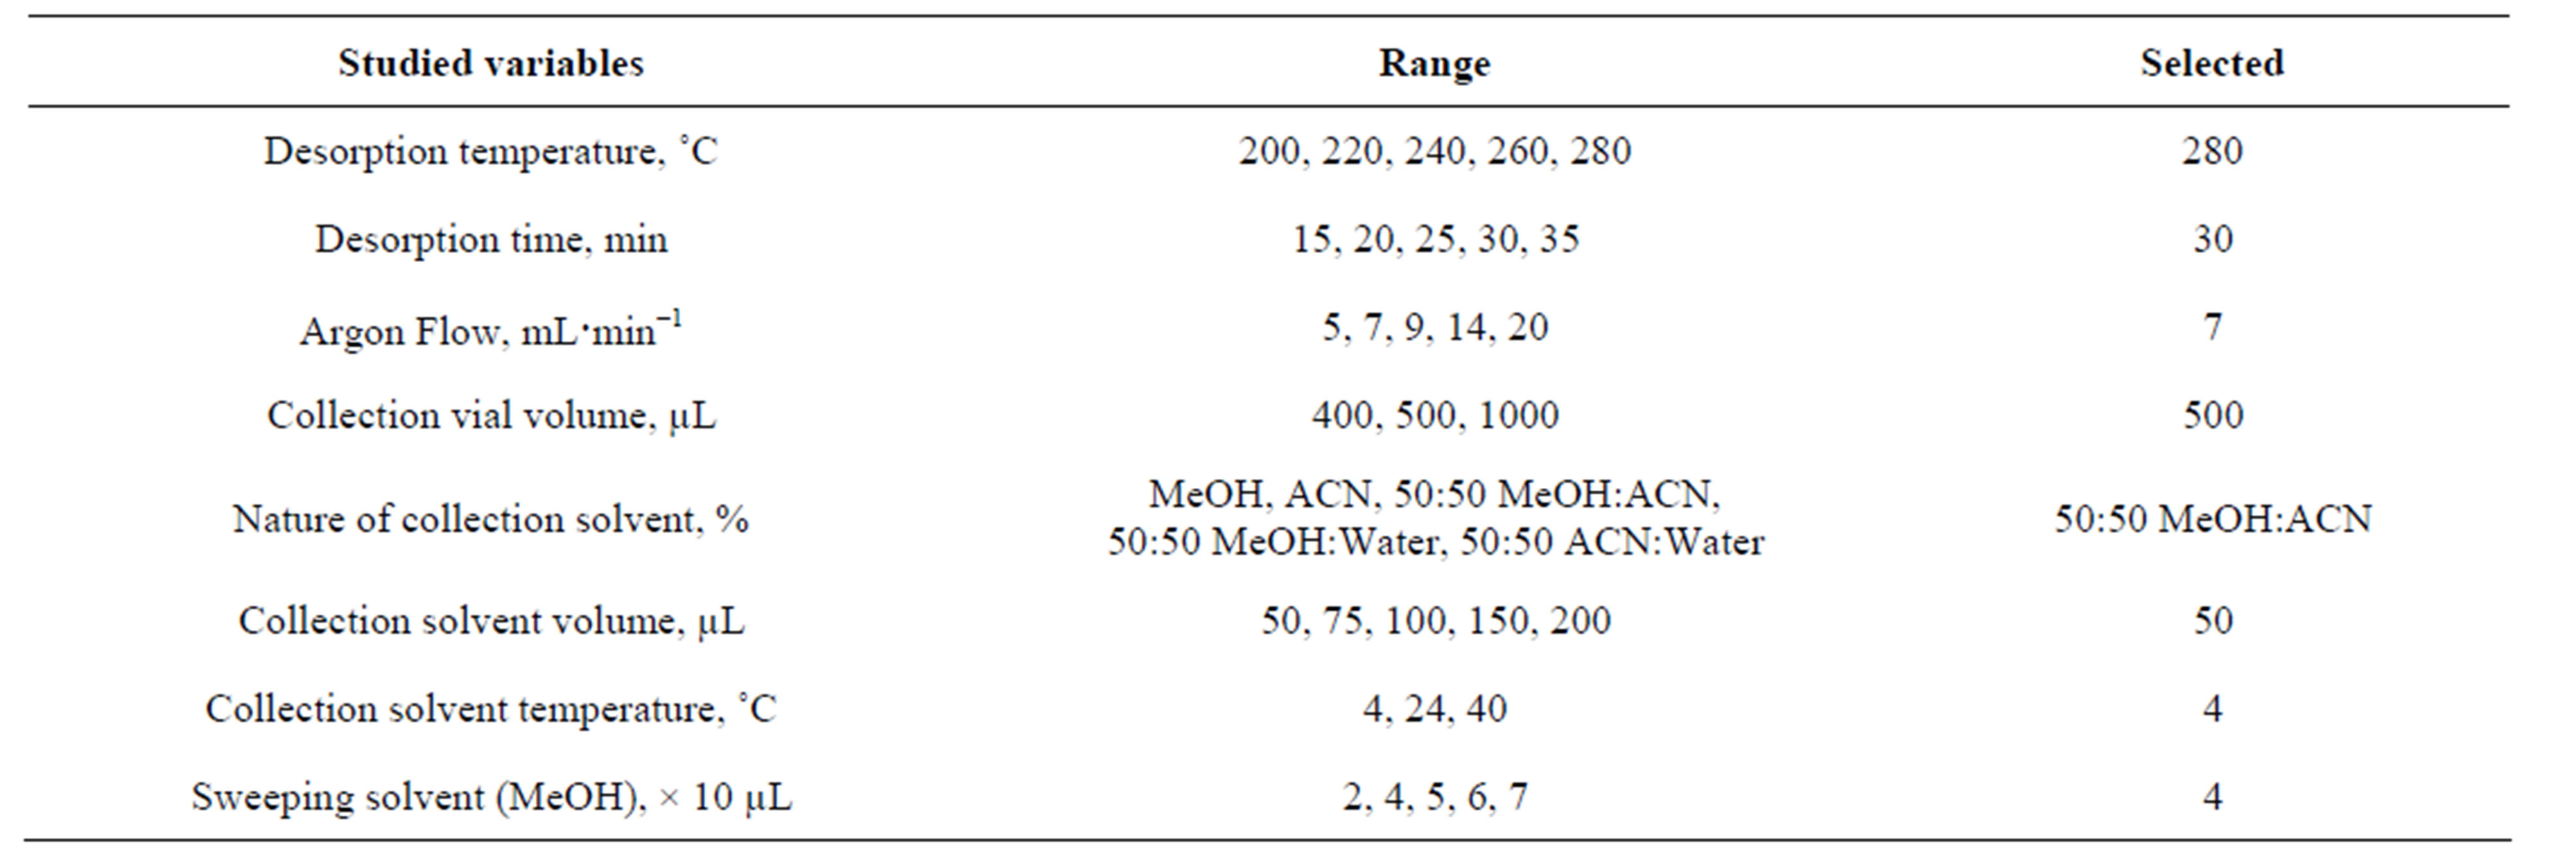
Table 2. Optimization of SPME thermal desorption/solvent collection interface.
sweeps the analytes and the collection solvent, Figure 5(a)" target="_self">Figure 5(a).
The bottom of this tube was cone shaped to allow maximum transference of the collected PAHs solution using an HPLC syringe. When the volume of this tube increased, signals decreased for volumes above 500 µL.
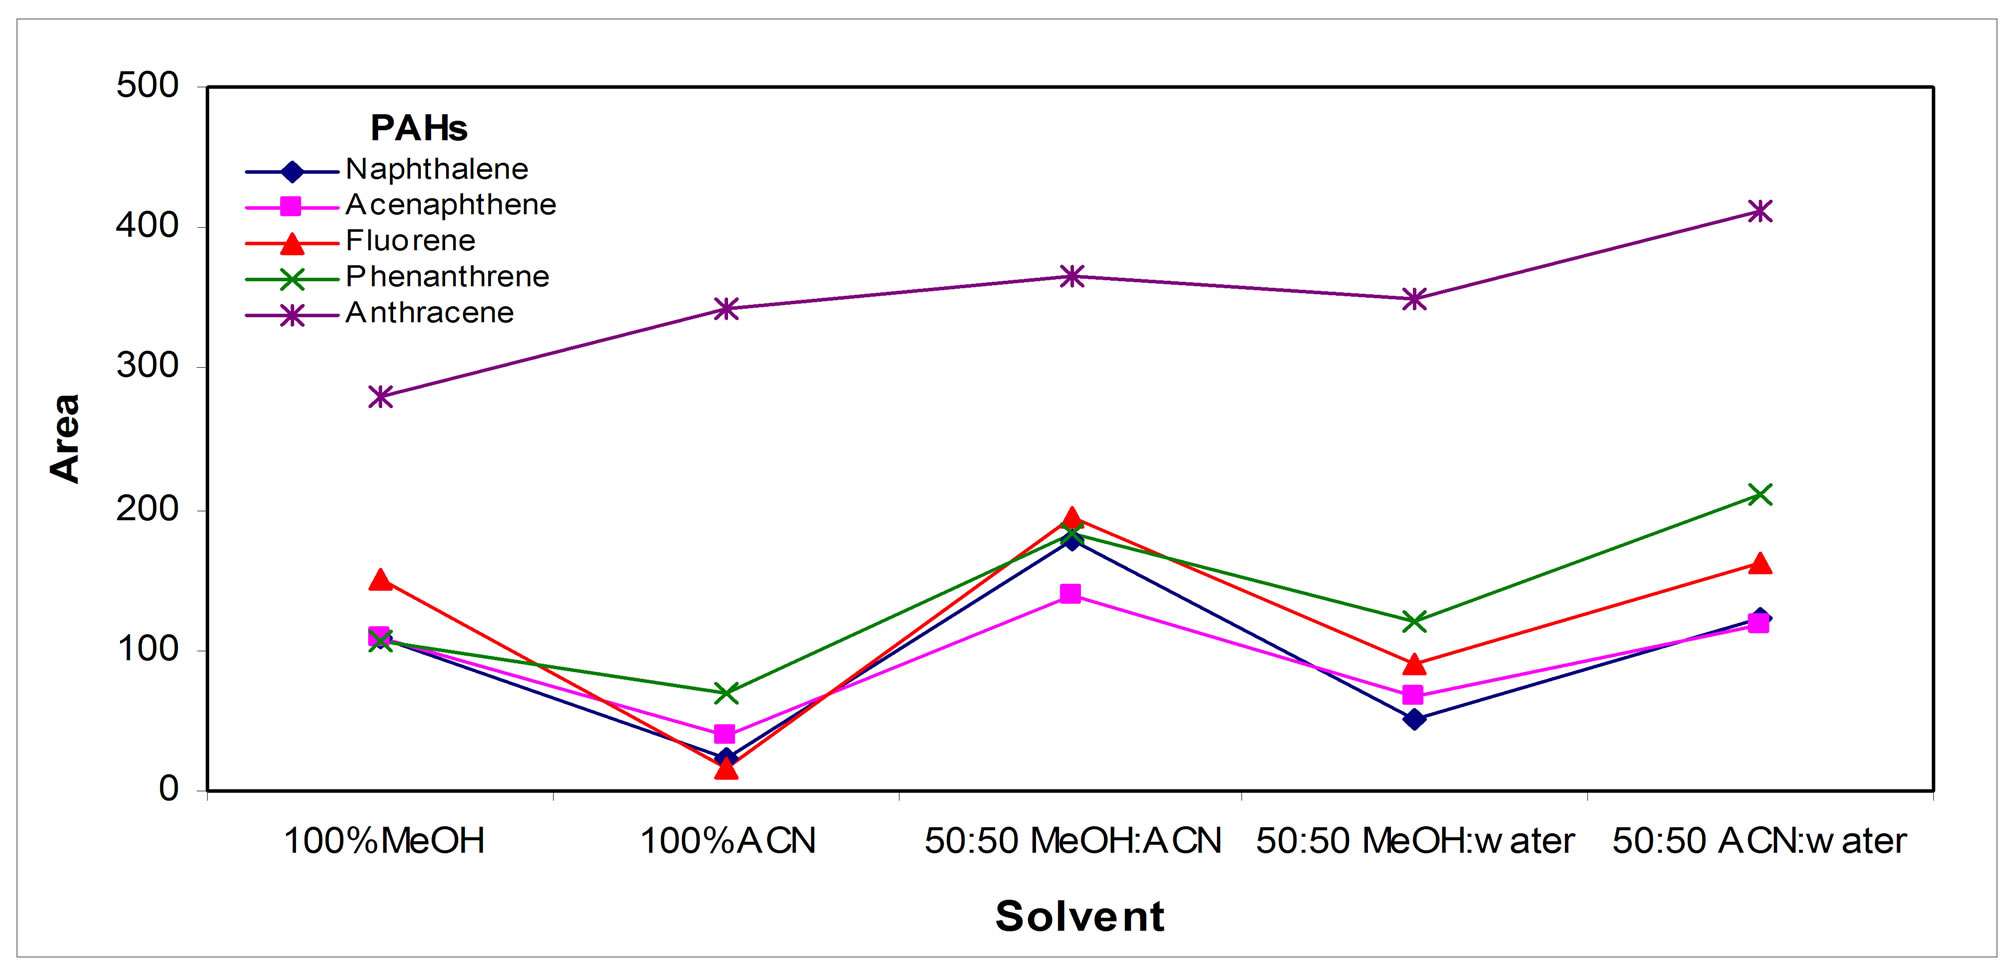
The nature of the collection organic solvent in Figure 5(b)" target="_self">Figure 5(b) shows that the optimum mixture was based on MeOH:ACN; 1:1; v:v; the elution strength of this mixture is very high for injection in HPLC, although in practice, this effect was small in the resulting HPLC peaks.
The volume of the collecting organic solvent was optimized; Figure 5(c)" target="_self">Figure 5(c) shows that in 50 µL of the collecting solvent the retention of the analytes was the highest. Decreasing the temperature of the solvent also contributes to retain the analytes by increasing the solvent/gas distribution constant, Figure 5(d)" target="_self">Figure 5(d); so the collection tube was placed inside an ice bath.
The volume of methanol used for sweeping was optimized to insure that all the analytes desorbed reached the collection solvent; the results are shown in the Figure 5(e)" target="_self">Figure 5(e).
3.3. Evaluation SPME-HPLC Off-Line Method Performance
3.3.1. Analytical Characteristics for Standards
Linearity ranges, regression coefficients, precision (RSDs) and detection limits (LOD) for standards (3 S/N) are shown in Table 3. Precision below 14% seems to be acceptable taking into account the complexity of the whole procedure. Detection limits at the low µg∙L−1 level were found. Regression coefficients showed an acceptable linearity taking into account the complexity of the procedure.
3.3.2. Analysis of Water Samples
PAHs were not detected in the Milli-Q, the tap water and the drinking mineral water samples analyzed. Four PAHs
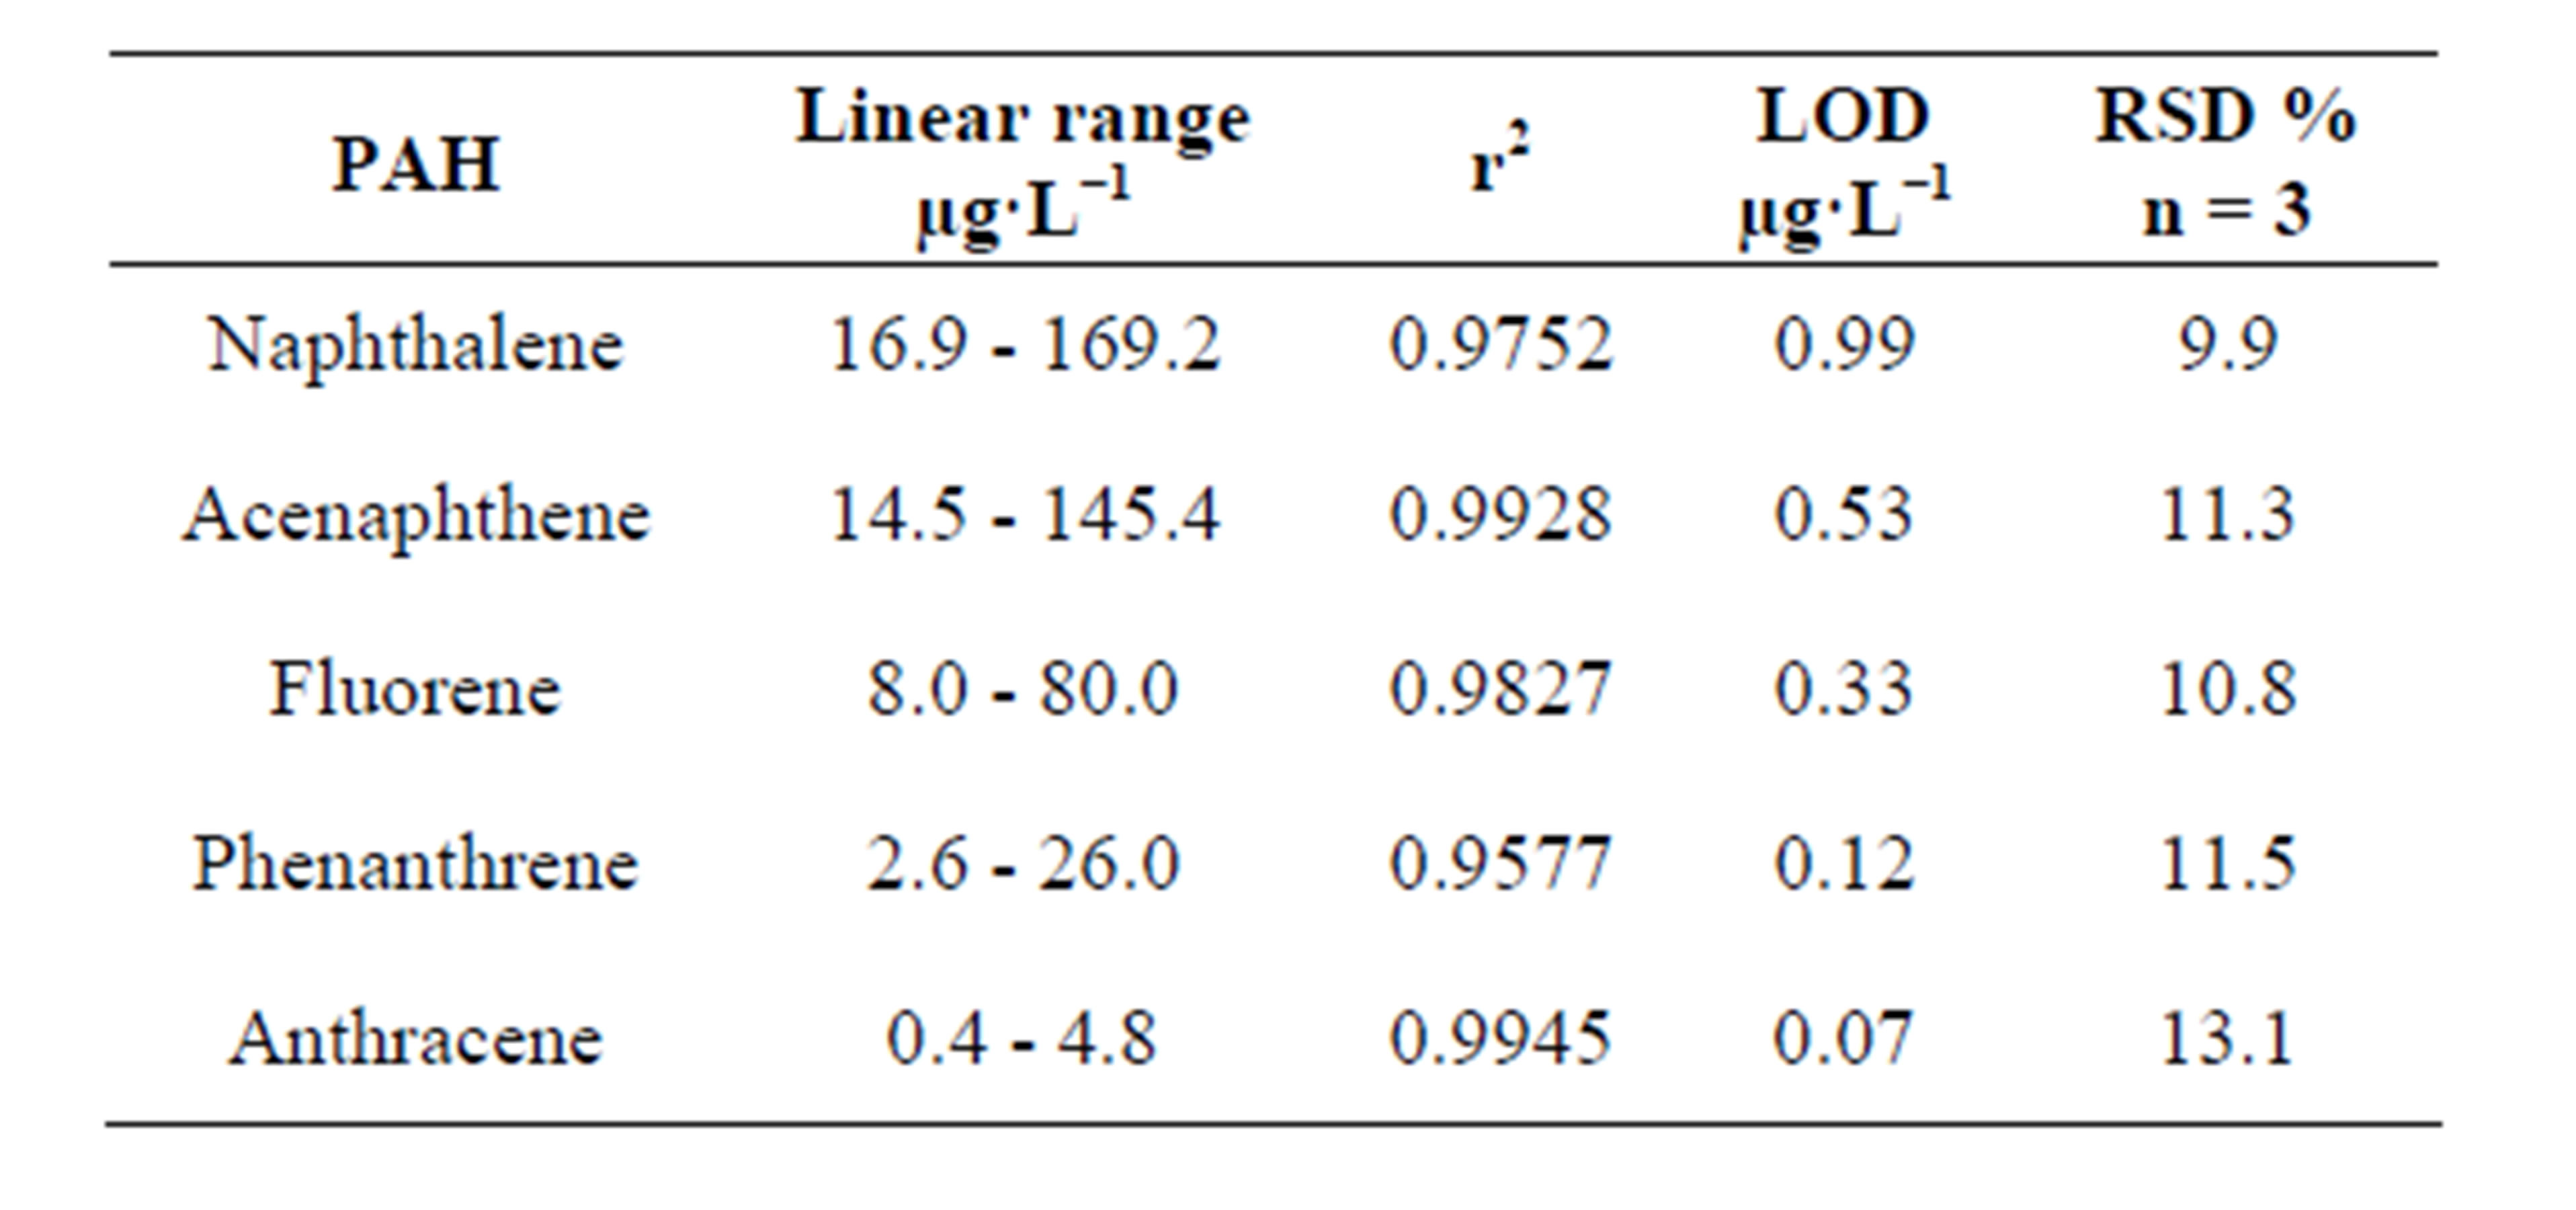
Table 3. Analytical characteristics of the method for standards.
were detected in the “Valdemayor” reservoir samples (Acenaphtene, fluorene, phenanthrene and anthracene); in the “Guadalix de la Sierra River” samples, three PAHs (Naphthalene, phenanthrene and anthracene) were also detected (Figure 6); results obtained in the quantitationare given in Table 4. In order to validate the proposed SPME method, its accuracy was evaluated by comparing the results with those found by the 550.1 EPA method [28], based essentially in SPE and HPLC with fluorimetric detection. The results obtained from the SPME method seemed to be slightly lower than those found from the EPA method; however, differences were not significant between both methods using the student’s t test at the significance level of 0.05 for all of the PAHs detected.
4. Conclusions
The new SPME/HPLC thermal desorption/organic solvent collection interface showed to be an alternative to the existing one from Supelco. Some limitations of Supelco interface was overcame; in particular, the contact of the fiber with the organic solvent was avoided.
Validation of the new interface for some PAHs test compounds by comparing their results with those found from the 550.1 EPA method showed agreement at a 95% probability level; these results indicated the potentiality
 (a)
(a)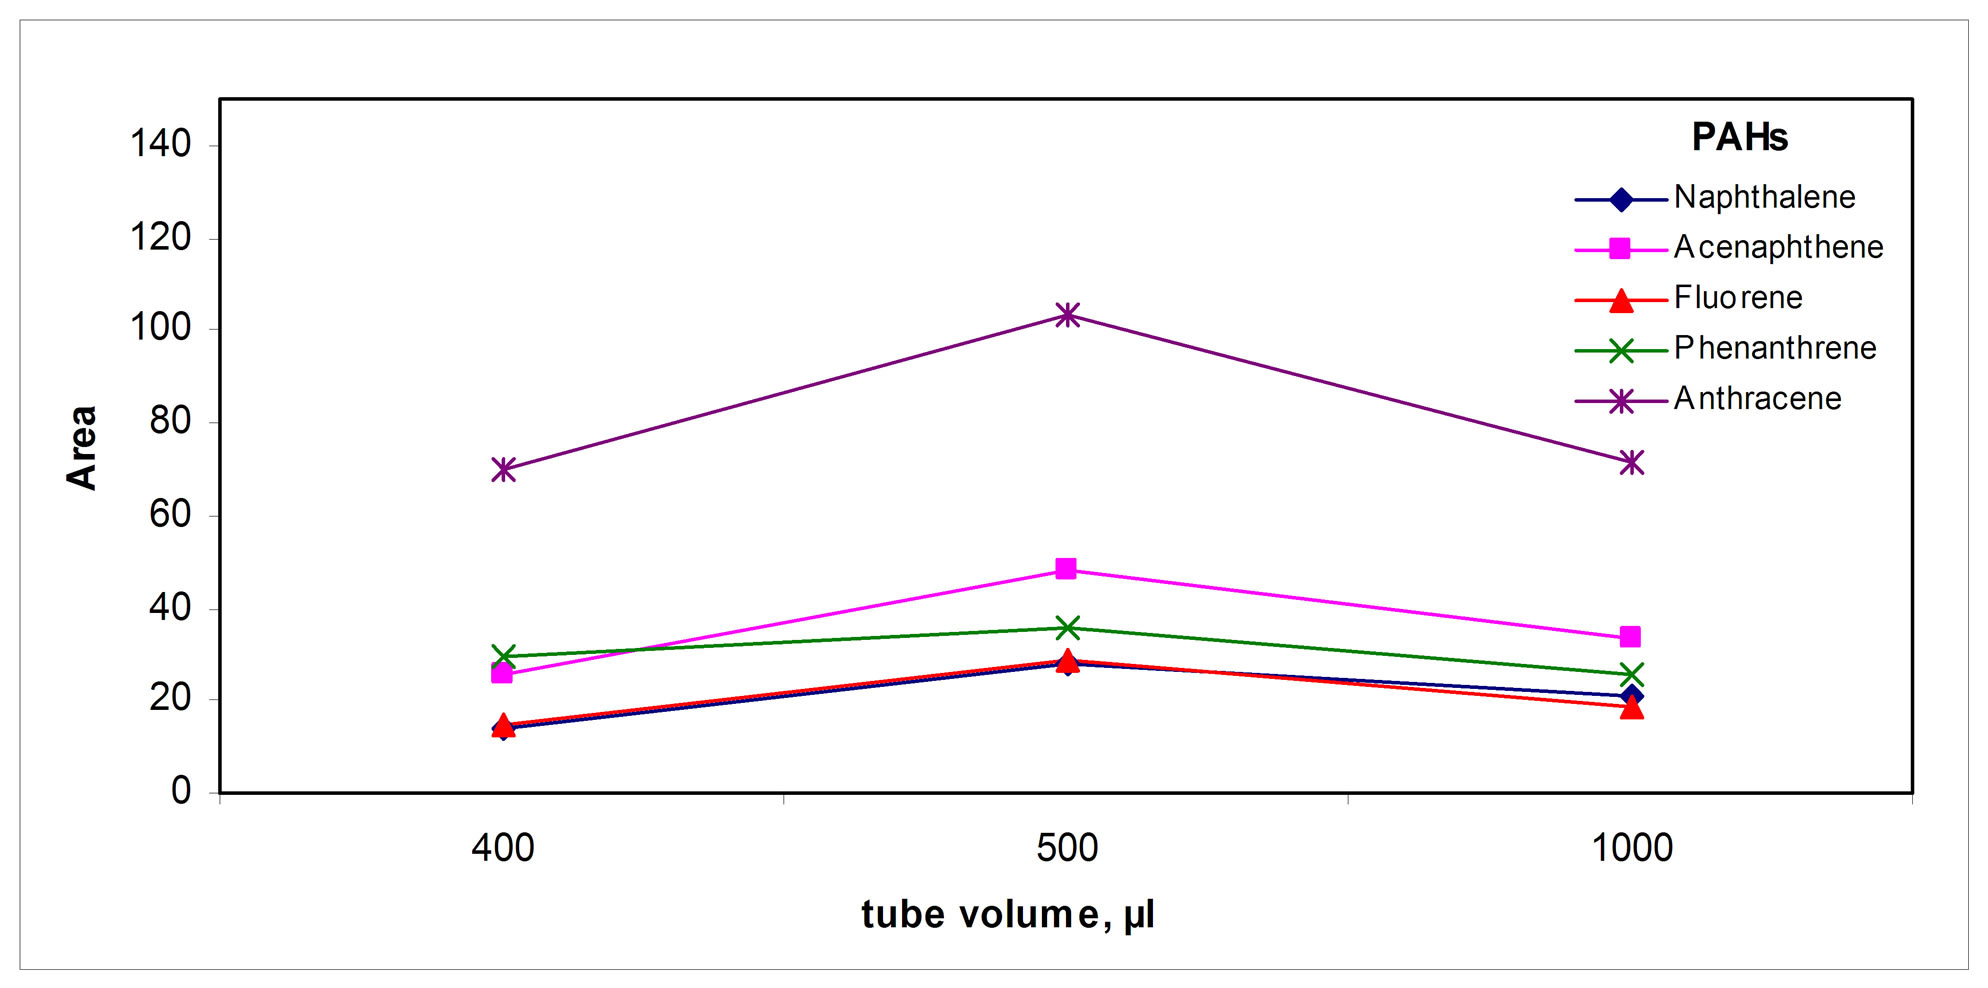 (b)
(b)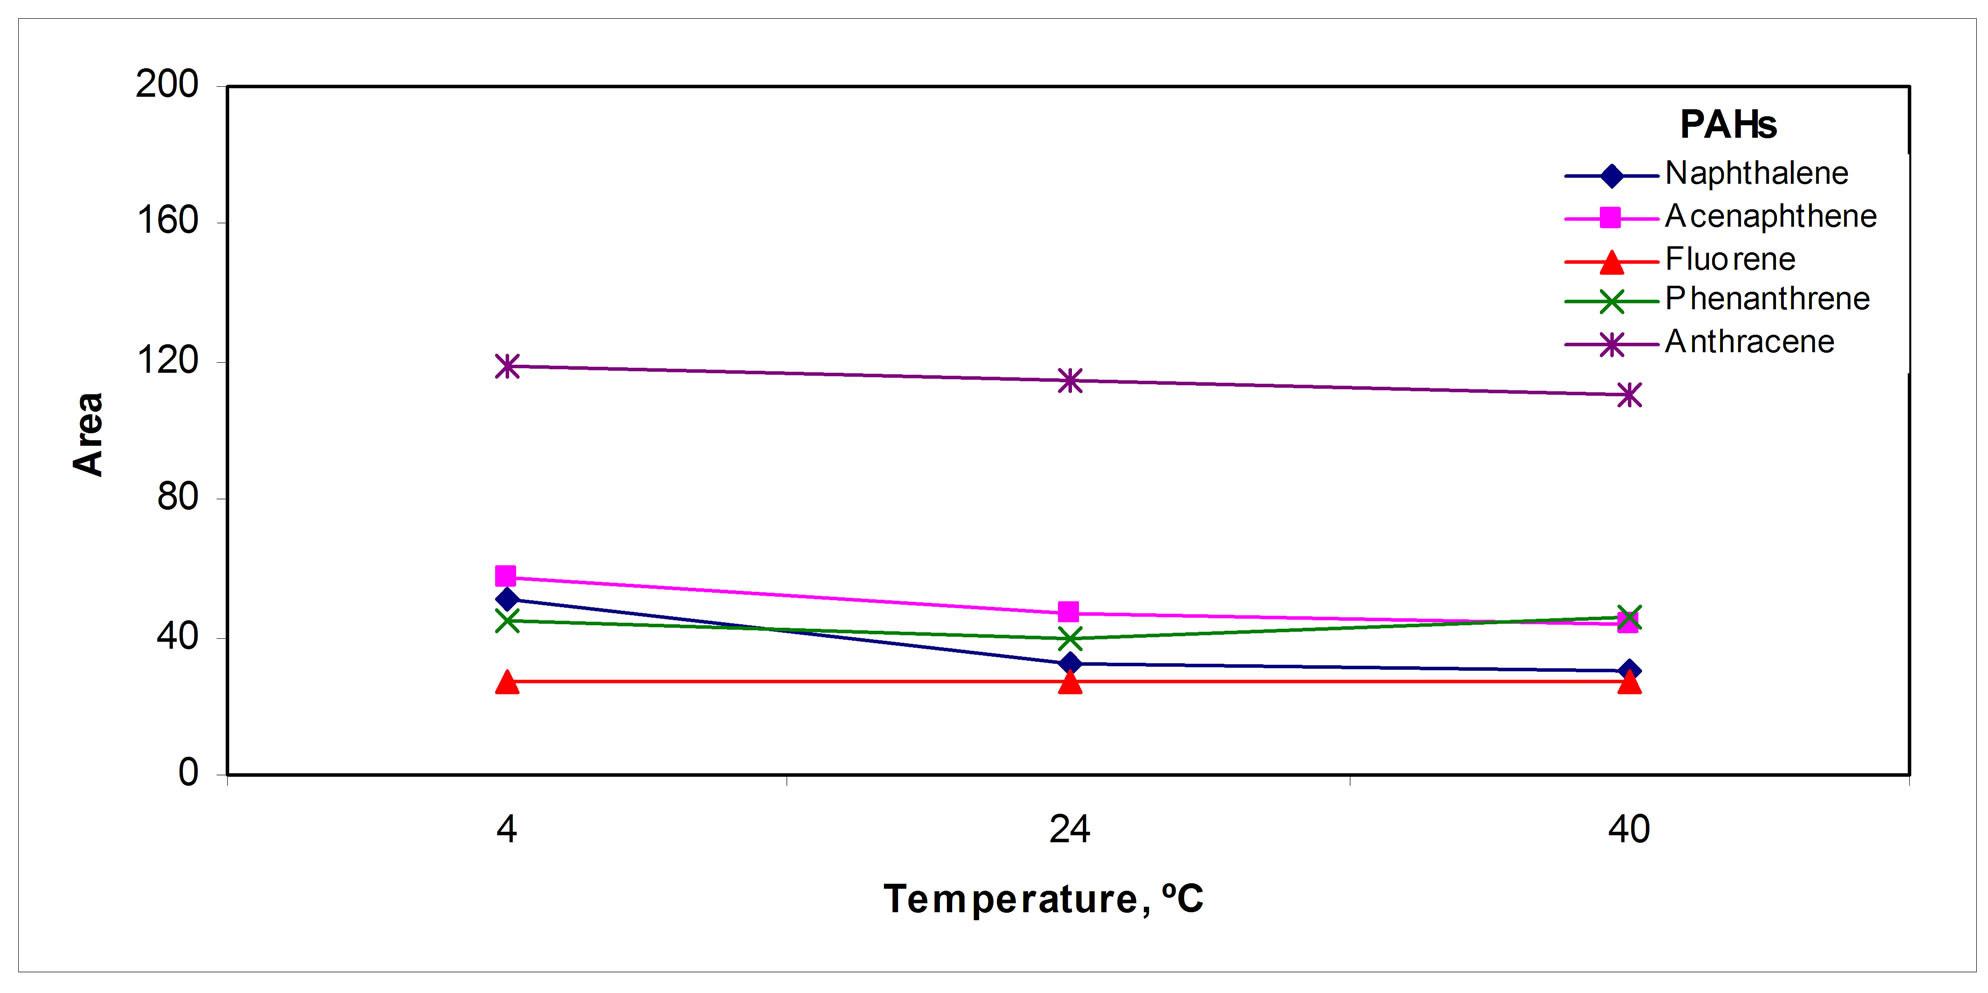 (c)
(c)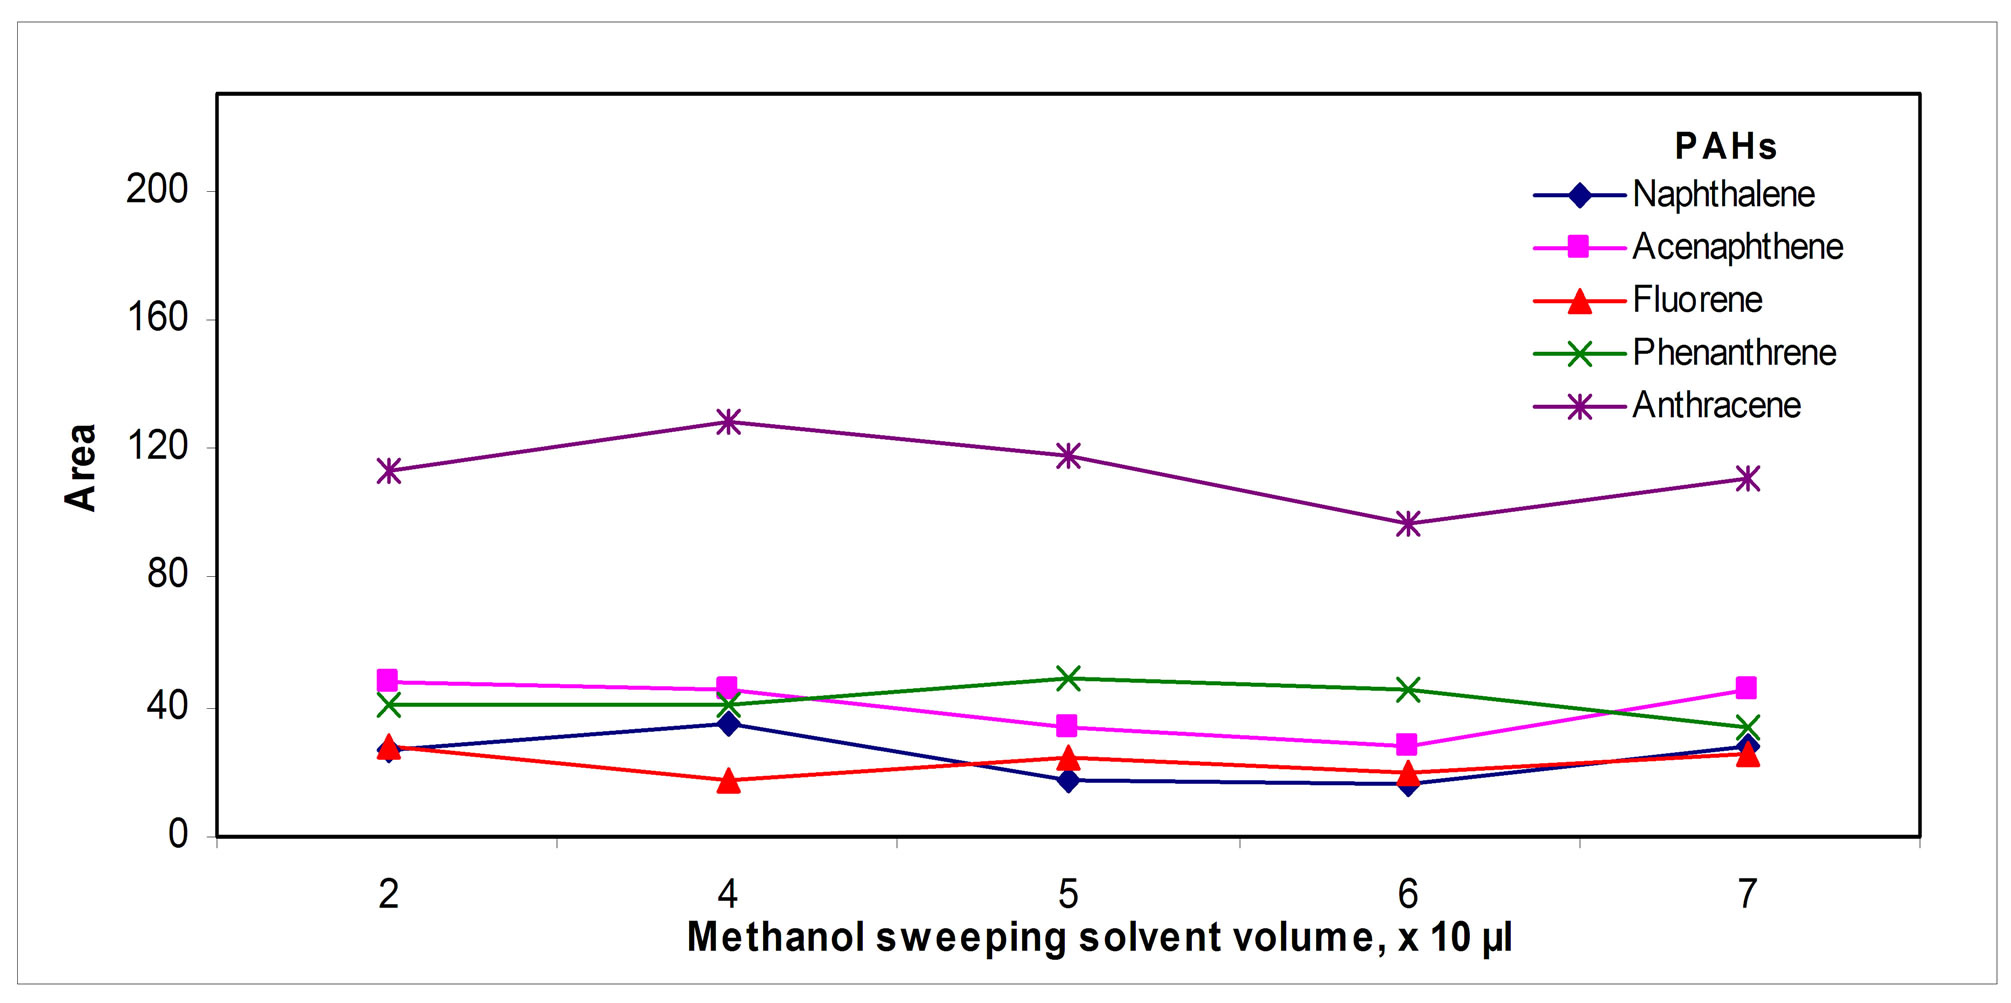 (d)
(d)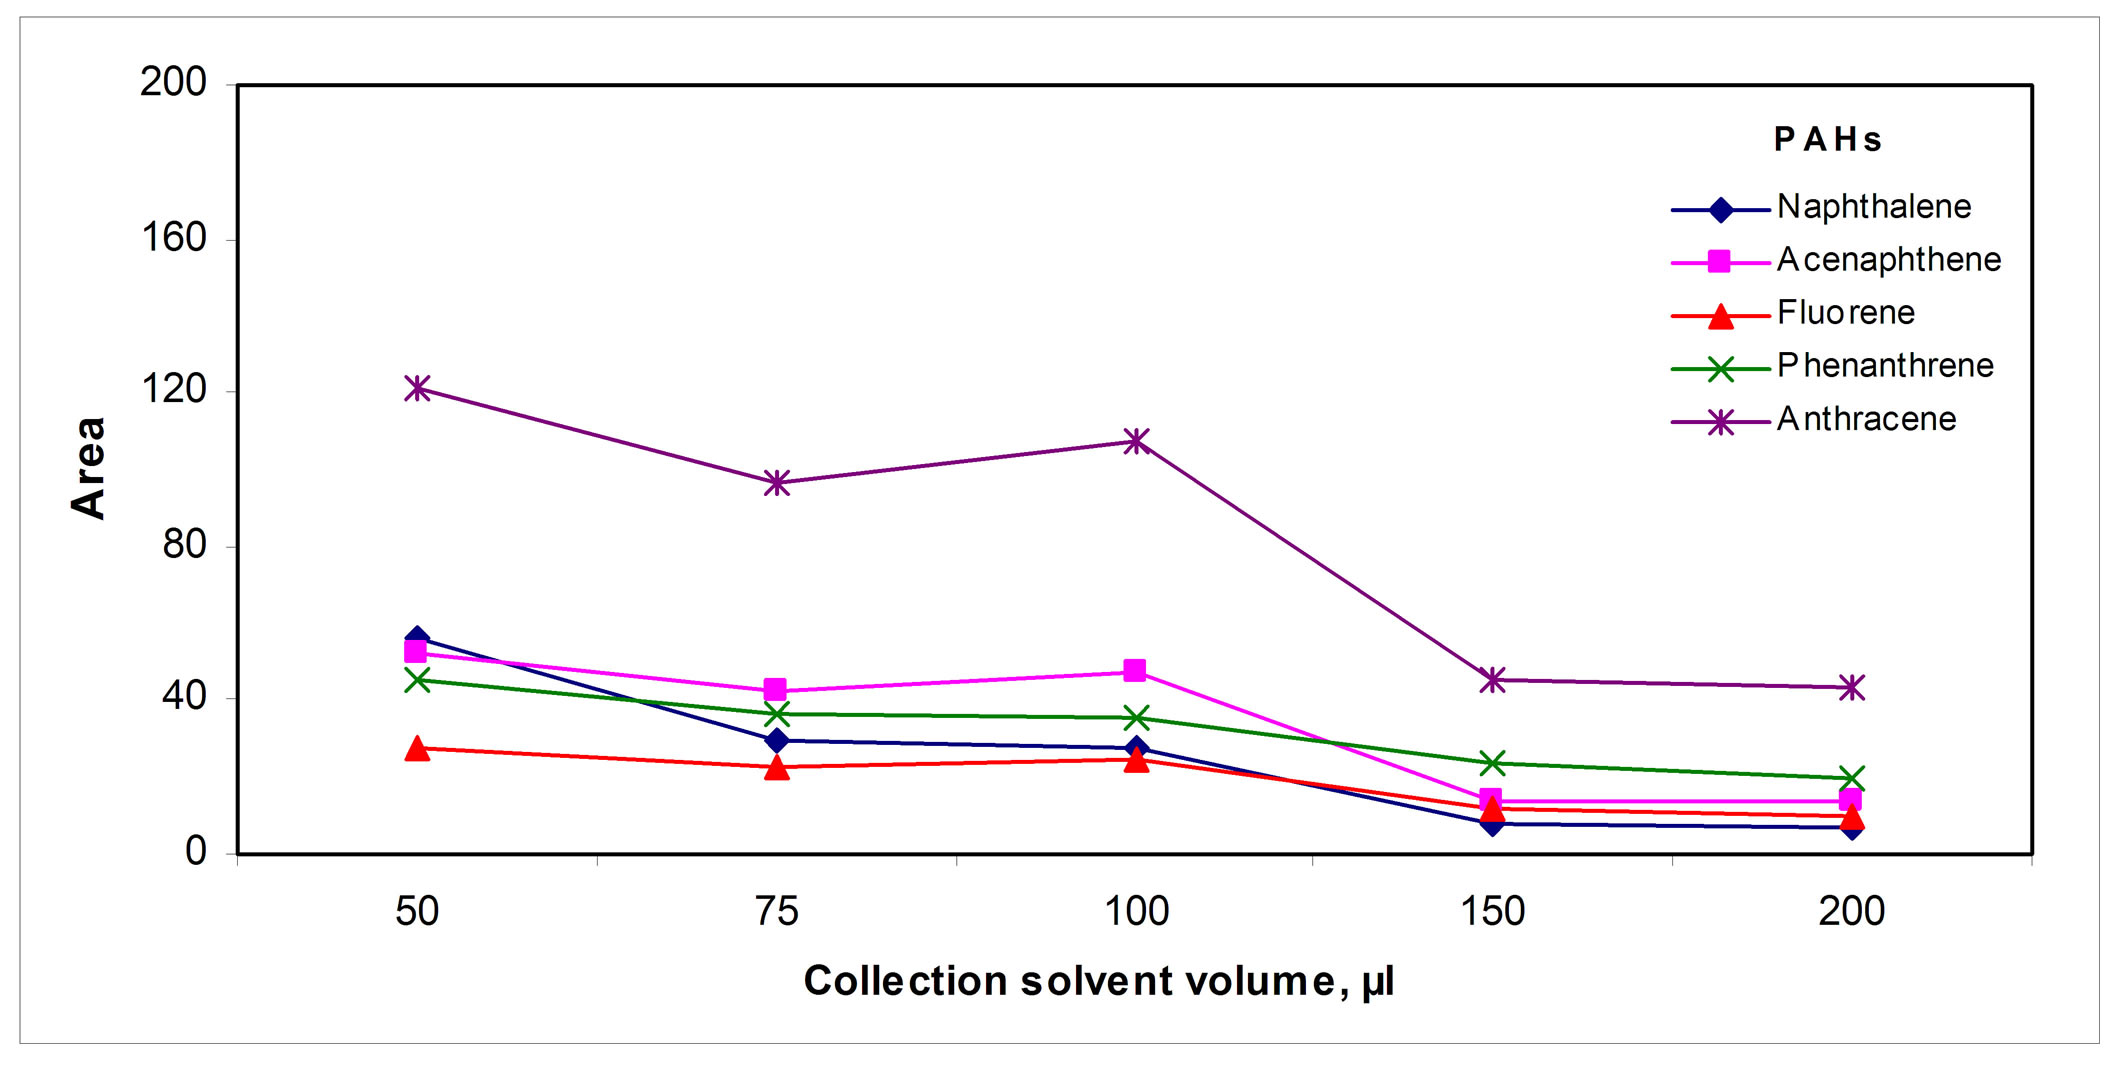 (e)
(e)
Figure 5. Collection parameters: (a) Tube volume, (b) Solvent, (c) Sweeping solvent volume, (d) Temperature and (e) Collection solvent volume.
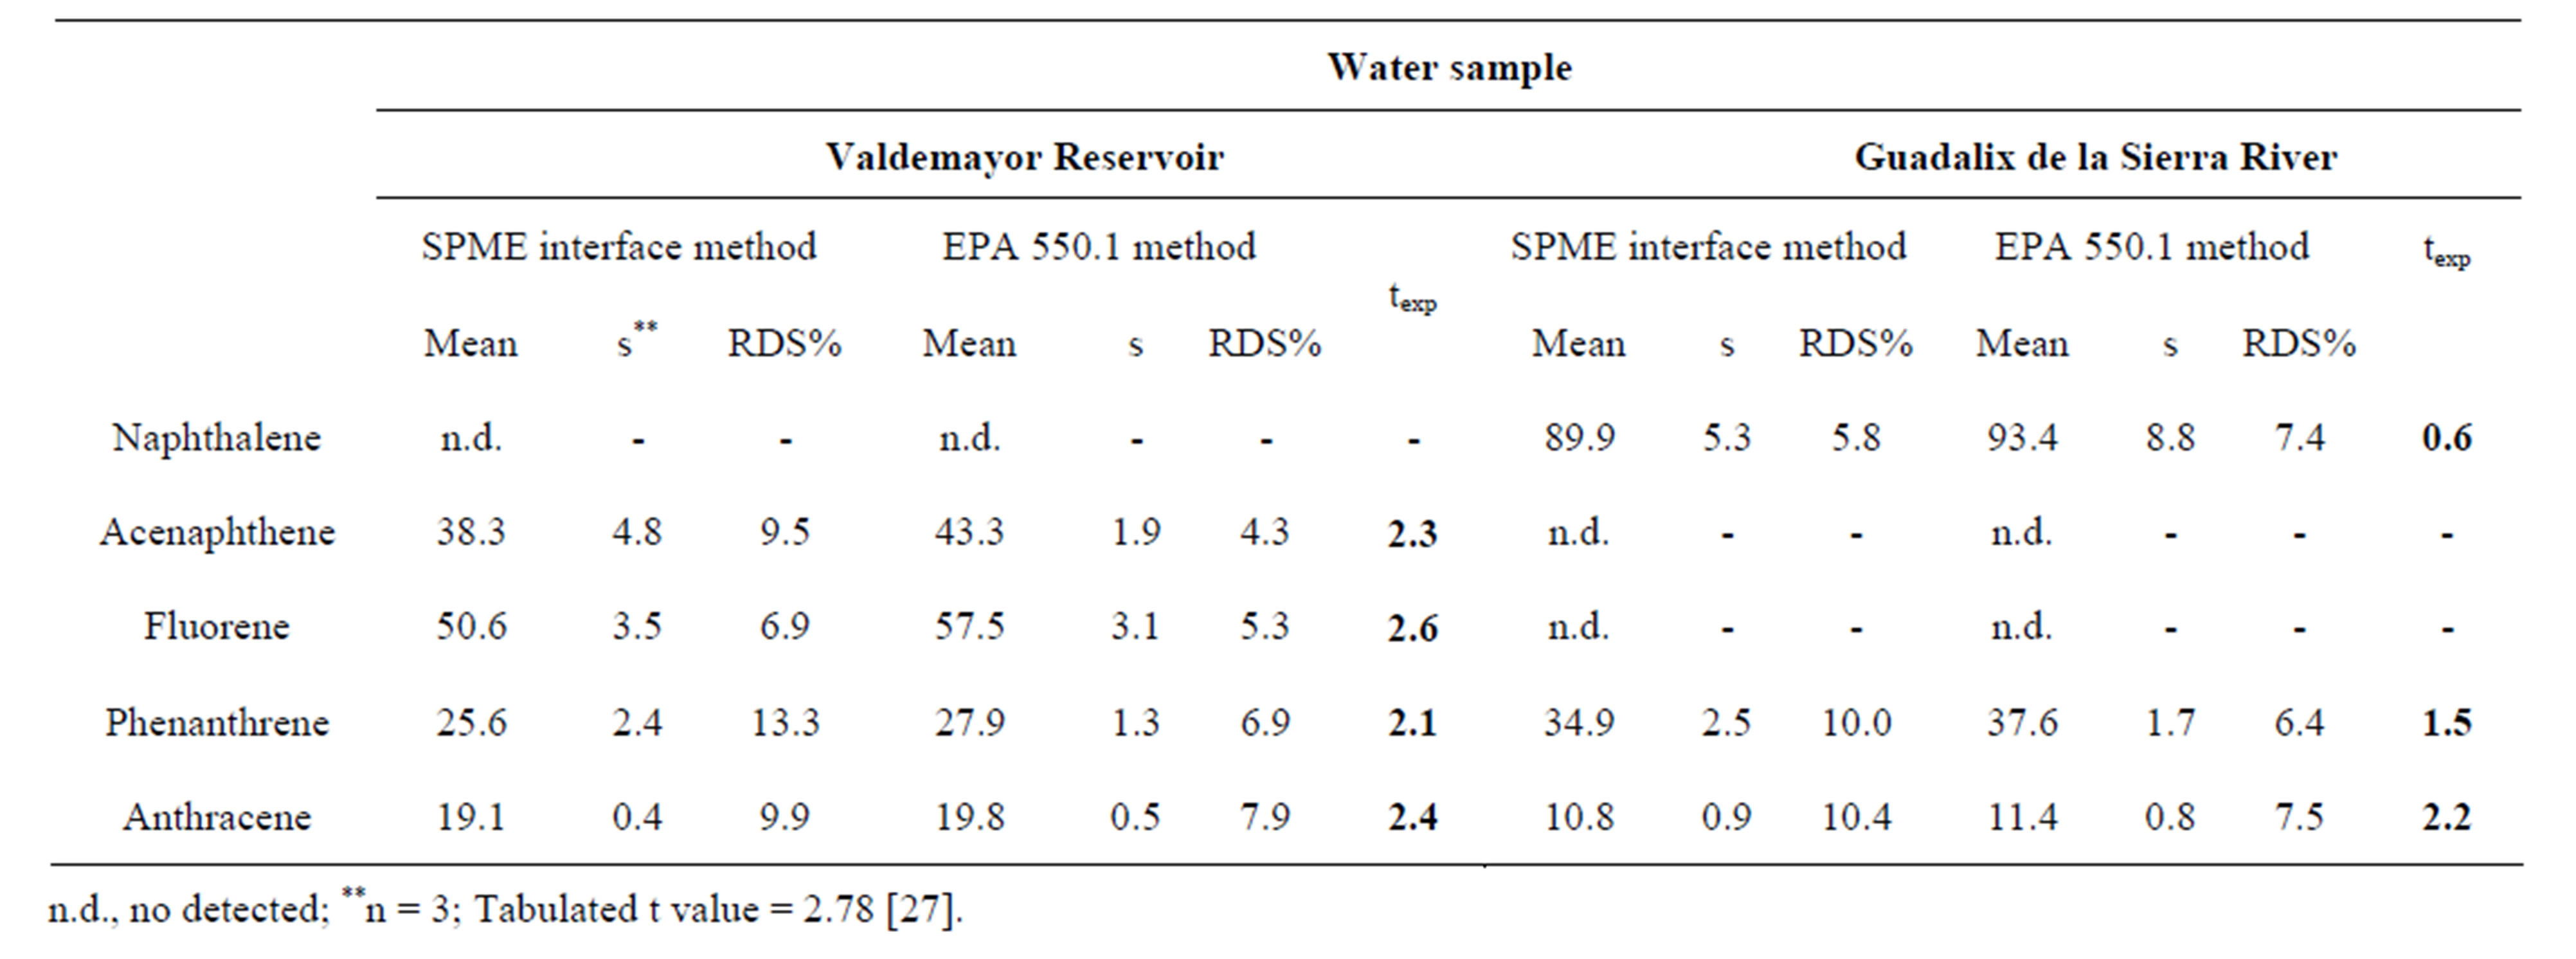
Table 4. Determination of PAHs by SPME thermal desorption/solvent collection interface and SPE (EPA Method 550.1).
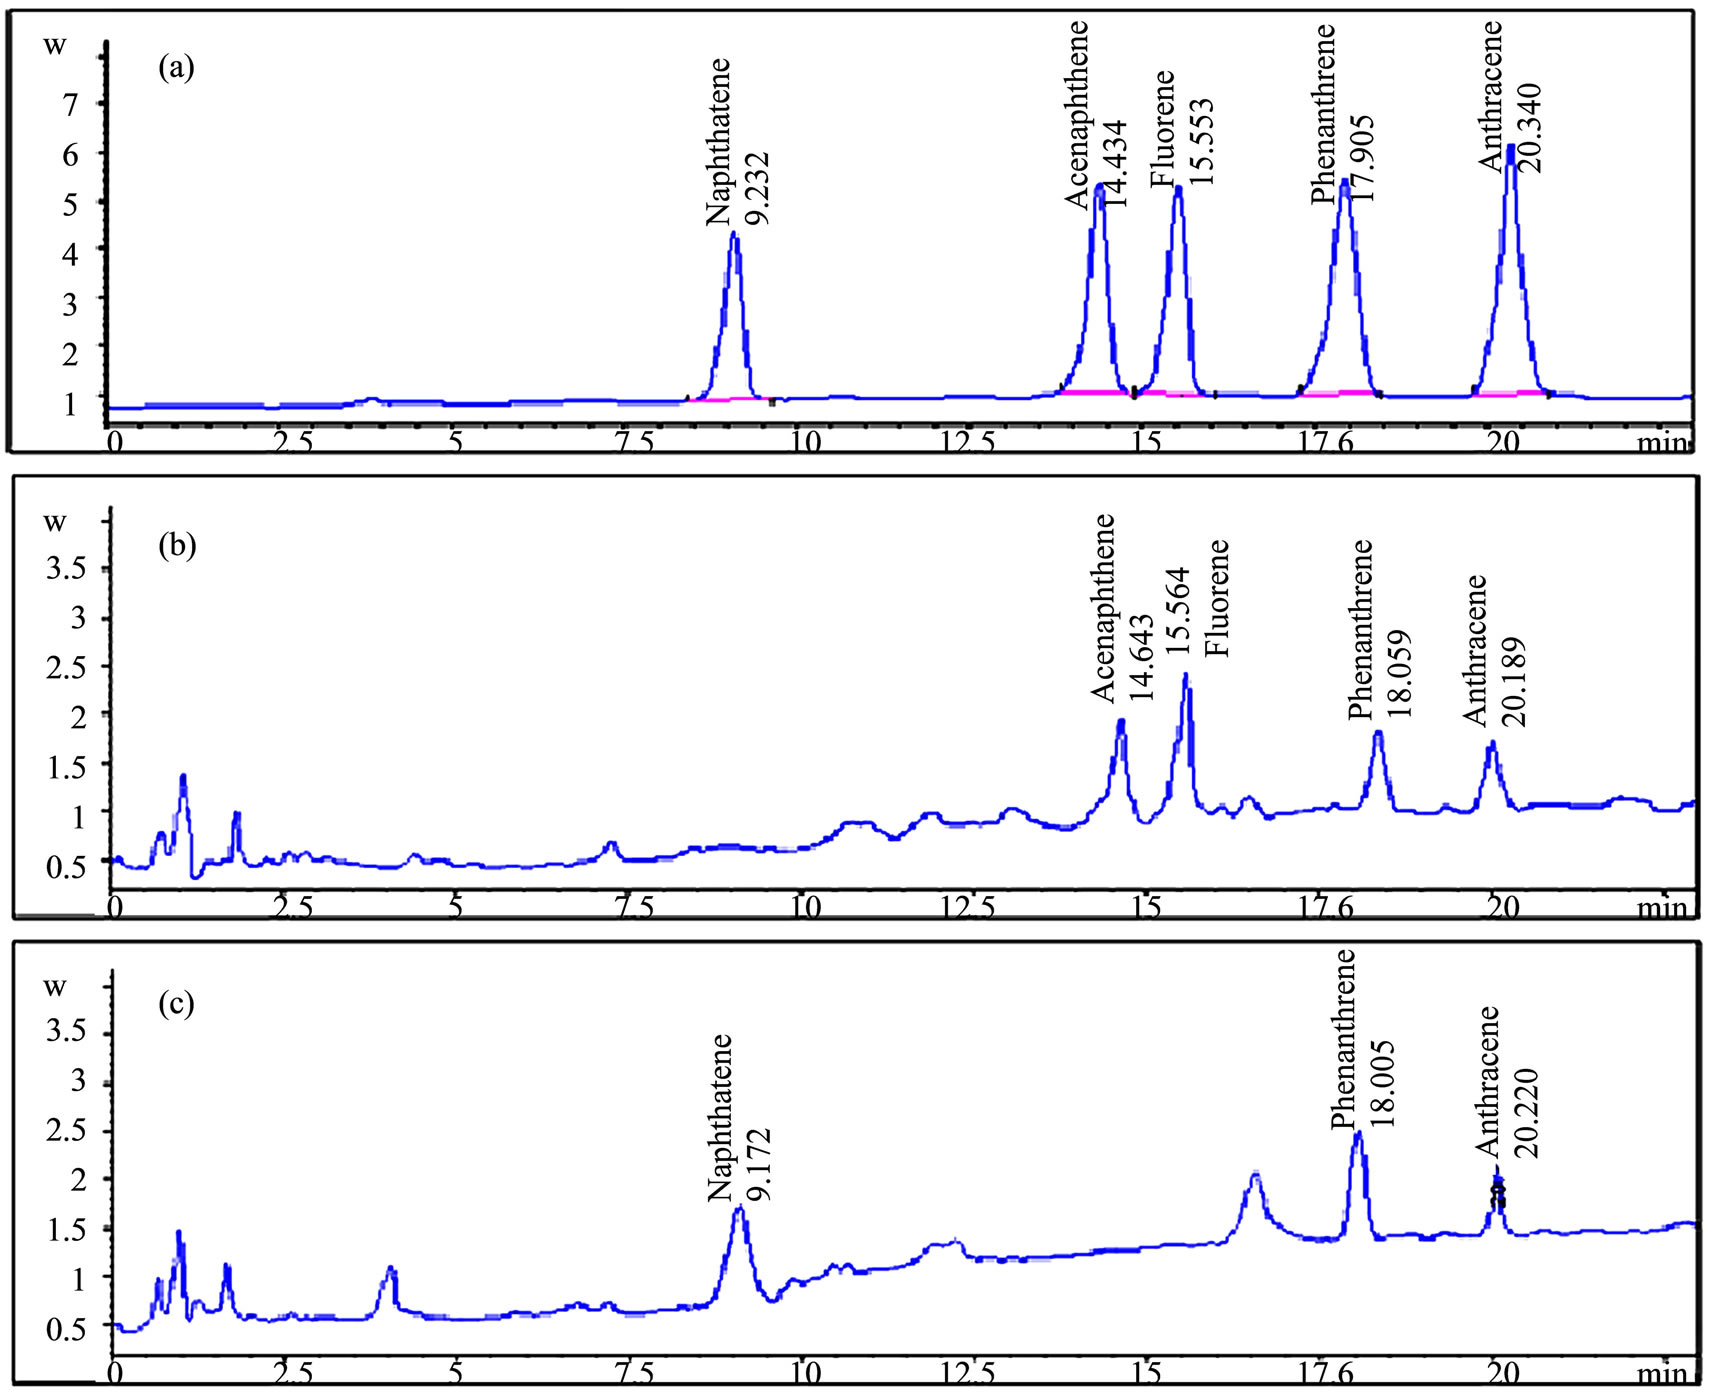
Figure 6. HPLC Chromatograms obtained from (a) A standard mixture of five PAHs, (b) Valdemayor reservoir sample and (c) Guadalix de la Sierra River sample.
of this interface to determine semivolatile compounds and others of different volatility.
REFERENCES
- Z. Mester, R. Sturgeon and J. Pawliszyn, “Solid Phase Microextraction as a Tool for Trace Element Speciation,” Spectrochimica Acta Part B: Atomic Spectroscopy, Vol. 56, No. 3, 2001, pp. 233-260. http://dx.doi.org/10.1016/S0584-8547(00)00304-9
- Y. Fan, Y. Feng, T. Zhang, S. Da and M. Zhang, “Poly (Methacrylic Acid-Ethylene Glycol Dimethacrylate) Monolith In-Tube Solid Phase Microextraction Coupled to High Performance Liquid Chromatography and Analysis of Amphetamines in Urine Samples,” Journal of Chromatography A, Vol. 1074, No. 1, 2005, pp. 9-16
- R. P. Belardi and J. Pawliszyn, “The application of chemically modified fused silica fibers in the extraction of organics from water matrix samples and their rapid transfer to capillary columns,” Water Pollution Research Journal of Canada, Vol. 24, 1989, pp. 179-191.
- M. N. Kayali, S. Rubio, M. P. Cuesta and L. M. Polo, “Rapid Determination of Polycyclic Aromatic Hydrocarbons in Tea Infusion Samples by High-Performance Liquid Chromatography and Fluorimetric Detection Based on Solid-Phase Extraction,” Analyst, Vol. 123, No. 10, 1998, pp. 2145-2148. http://dx.doi.org/10.1039/a803967d
- A. Peñalver, E. Pocurull, F. Borrull and R. M. Marcé, “Method Based on Solid-Phase Microextraction—HighPerformance Liquid Chromatography with UV and Electrochemical Detection to Determine Estrogenic Compounds in Water Samples,” Journal of Chromatography A, Vol. 964, No. 1-2, 2002, pp. 153-160. http://dx.doi.org/10.1016/S0021-9673(02)00694-5
- Y. Wang, J. Zhang, et al., “Quantitative Determination of 16 Polycyclic Aromatic Hydrocarbons in Soil Samples Using Solid-Phase Microextraction,” Journal of Separation Science, Vol. 32, No. 22, 2009, pp. 3951-3957. http://dx.doi.org/10.1002/jssc.200900420
- Gaurav, A. K. Malik and P. K. Rai, “Development of a New SPME-HPLC-UV Method for the Analysis of Nitro Explosives on Reverse Phase Amide Column and Application to Analysis of Aqueous Samples,” Journal of Hazardous Materials, Vol. 172, No. 2-3, 2009, pp. 1652- 1658. http://dx.doi.org/10.1016/j.jhazmat.2009.08.039
- R. J. Bartelt, “Calibration of a Commercial Solid-Phase Microextraction Device for Measuring Headspace Concentrations of Organic Volatiles,” Analytical Chemistry, Vol. 69, No. 3, 1997, pp. 364-372. http://dx.doi.org/10.1021/ac960820n
- C. Arthur and J. Pawliszyn, “Solid Phase Microextraction with Thermal Desorption Using Fused Silica Optical Fibers,” Analytical Chemistry, Vol. 62, No. 19, 1990, pp. 2145-2148. http://dx.doi.org/10.1021/ac00218a019
- M. R. Negräo and M. F. Alpendurada, “Solvent-Free Method for the Determination of Polynuclear Aromatic Hydrocarbons in Waste Water by Solid-Phase Microextraction-High-Performance Liquid Chromatography with Photodiode-Array Detection,” Journal of Chromatography A, Vol. 823, No. 1-2, 1998, pp. 211-218. http://dx.doi.org/10.1016/S0021-9673(98)00586-X
- K. Hiroyuki, “Recent Advances in Solid-Phase Microextraction and Related Techniques for Pharmaceutical and Biomedical Analysis,” Current Pharmaceutical Analysis, Vol. 1, No. 1, 2005, pp. 65-84. http://dx.doi.org/10.2174/1573412052953373
- M. E. Miller and J. D. Stuart, “Comparison of Gas-Sampled and SPME-Sampled Static Headspace for the Determination of Volatile Flavor Components,” Analytical Chemistry, Vol. 71, No. 1, 1999, pp. 23-27. http://dx.doi.org/10.1021/ac980576v
- O. Ezquerro and M. Tena, “Determination of Odour-Causing Volatile Organic Compounds in Cork Stoppers by Multiple Headspace Solid-Phase Microextraction,” Journal of Chromatography A, Vol. 1068, No. 2, 2005, pp. 201-208. http://dx.doi.org/10.1016/j.chroma.2005.01.089
- W. Zhang and C. Zlin, “Mussel Inspired Polydopamine Functionalized Poly (Ether Ether Ketone) Tube for Online Solid-Phase Microextraction—High Performance Liquid Chromatography and Its Application in Analysis of Protoberberine Alkaloids in Rat Plasma,” Journal of Chromatography A, Vol. 1278, 2013, pp. 29-36. http://dx.doi.org/10.1016/j.chroma.2013.01.014
- A. Bordagaray, R. García and E. Millán, “Development and Application of a Screening Method for Triazole Fungicide Determination in Liquid and Fruit Samples Using Solid-Phase Microextraction and HPLC-DAD,” Analytical Methods, Vol. 5, No. 10, 2013, pp. 2565-2571. http://dx.doi.org/10.1039/c3ay26433e
- S. Panseri, S. Soncin, L. M. Chiesa and P. A. Biondi, “A Headspace Solid-Phase Microextraction Gas-Chromatographic Mass-Spectrometric Method (HS-SPME-GC/MS) to Quantify Hexanal in Butter during Storage as Marker of Lipid Oxidation,” Food Chemistry, Vol. 127, No. 2, 2011, pp. 886-889. http://dx.doi.org/10.1016/j.foodchem.2010.12.150
- M. Tankiewicz, C. Morrison and M. Biziuk, “Application and Optimization of Headspace Solid-Phase Microextraction (HS-SPME) Coupled with Gas ChromatographyFlame-Ionization Detector (GC-FID) to Determine Products of the Petroleum Industry in Aqueous Samples,” Microchemical Journal, Vol. 108, 2013, pp. 117-123. http://dx.doi.org/10.1016/j.microc.2012.10.010
- Q. L. Ma, N. Hamid, A. E. D. Bekhit, J. Robertson and T. F. Law, “Optimization of Headspace Solid Phase Microextraction (HS-SPME) for Gas Chromatography Mass Spectrometry (GC-MS) Analysis of Aroma Compounds in Cooked Beef Using Response Surface Methodology,” Microchemical Journal, Vol. 111, 2013, pp. 16-24. http://dx.doi.org/10.1016/j.microc.2012.10.007
- Gaurav, V. Kaur, A. Kumar, A. Kumar and P. K. Rai, “SPME-HPLC: A New Approach to the Analysis of Explosives,” Journal of Hazardous Materials, Vol. 147, No. 3, 2007, pp. 691-697. http://dx.doi.org/10.1016/j.jhazmat.2007.05.054
- C. Fernandes, A. J. dos Santos Neto, J. C. Rodrigues, C. Alves and F. Mauro Lanças, “Solid-Phase Microextraction-Liquid Chromatography (SPME-LC) Determination of Fluoxetine and Norfluoxetine in Plasma Using a Heated Liquid Flow through Interface,” Journal of Chromatography B, Vol. 847, No. 2, 2007, pp. 217-223. http://dx.doi.org/10.1016/j.jchromb.2006.10.011
- L. Cárdenes, J. Ayala, M. A. Afonso and V. González, “Solid-Phase Microextraction Coupled with High-Performance Liquid Chromatography for the Analysis of Heterocyclic Aromatic Amines,” Journal of Chromatography A, Vol. 1030, No. 1-2, 2004, pp. 87-93. http://dx.doi.org/10.1016/j.chroma.2003.10.040
- H. Kataoka and K. Saito, “Recent Advances in SPME Techniques in Biomedical Analysis,” Journal of Pharmaceutical and Biomedical Analysis, Vol. 54, 2011, pp. 926-950.
- J. S. Aulakh, A. K. Malik, V. Kaur and P. M. Kopplin, “A Review on Solid Phase Micro Extraction—High Performance Liquid Chromatography (SPME-HPLC) Analysis of Pesticides,” Critical Reviews in Analytical Chemistry, Vol. 35, No. 1, 2005, pp. 71-85. http://dx.doi.org/10.1080/10408340590947952
- N. Kayali, F. G. Tamayo and L. M. Polo, “Determination of Diethylhexyl Phtalate in Water by Solid Phase Microextraction Coupled to High Performance Liquid Chromatography,” Talanta, Vol. 69, No. 5, 2006, pp. 1095- 1099. http://dx.doi.org/10.1016/j.talanta.2005.12.016
- H. L. Lord, “Strategies for Interfacing Solid-Phase Microextraction with Liquid Chromatography,” Journal of Chromatography A, Vol. 1152, No. 1, 2007, pp. 2-13. http://dx.doi.org/10.1016/j.chroma.2006.11.073
- M. N. Kayali-Sayadi, J. M. Bautista, L. M. Polo-Díez and I. Salazar, “Identification of Pheromones in Mouse Urine by Head-Space Solid Phase Microextraction Followed by Gas Chromatography-Mass Spectrometry,” Journal of Chromatography B, Vol. 796, No. 1, 2003, pp.55-62. http://dx.doi.org/10.1016/j.jchromb.2003.08.001
- J. N. Miller and J. C. Miller, “Statistics and Chemometrics for Analytical Chemistry,” 4th Edition, Prentice-Hall, Harlow, 2000.
- L. H. Keith, “Compilation of EPA’s Sampling and Analysis Methods,” 2nd Edition, CRC Press, Boca Raton, 1996. http://dx.doi.org/10.1201/9781420050615