Journal of Analytical Sciences, Methods and Instrumentation
Vol. 3 No. 1 (2013) , Article ID: 29156 , 8 pages DOI:10.4236/jasmi.2013.31006
Novel Approach for Quantitative Measurement of Matrix Metalloprotease-1 (MMP1) in Human Breast Cancer Cells Using Mass Spectrometry*

1Texas Therapeutics Institute, Houston, USA; 2Proteomics Center, Brown Foundation Institute of Molecular Medicine, The University of Texas Health Science Center at Houston, Houston, USA.
Email: #Ningyan.zhang@uth.tmc.edu
Received November 22nd, 2012; revised December 29th, 2012; accepted January 8th, 2013
Keywords: Matrix Metalloprotease-1 (MMP1); SKBR3 Breast Cancer Cells; Mass Spectrometry; Selected Reaction Monitoring; Absolute Quantification
ABSTRACT
Identification and quantification of low abundance growth factors and regulators in complex biological samples still present a challenging task in analytical biochemistry. Immunoassays are often used for such purpose but immunoassays face limitation of both availability and qualities of antibody reagents that are necessary for development of immune assays. With genomics data base available, mass spectrometry (MS) can analyze protein tryptic peptides directly for quantitative determination of proteins. In this study, we report a method for detection of matrix metalloproteinase 1 (MMP1), an important extracellular matrix modulator, in human breast cancer cells by quadrupole time-of-flight (Q-TOF) MS. Absolute quantification of MMP1 was conducted using the selected reaction monitoring (SRM) on a triple quadrupole (Triple-Quad) MS via transitions selected from MMP1 tryptic peptides using non isotope labeled MMP1 protein as a titration standard. In comparison with immune based assay, this MS method showed picogram level sensitivity for quantitative determination of MMP1 in total cell lysates. Our results demonstrated the feasibility of absolute quantification of low abundance proteins using label-free protein standard by mass spectrometry. Therefore, this method provides not only advantages of high sensitivity but also cost saving in comparison with the commonly used mass spectrometry that currently employs isotype labeled proteins for quantitative analysis.
1. Introduction
Liquid chromatography-tandem mass spectrometry (LCMS/MS) has been widely used for protein analysis, ranging from protein expression profiling to specific post-translational modifications. However, quantitative detection of low abundance proteins in complex biological samples is still difficult and often requires multiple enrichment steps before analysis using mass spectrometry (MS). To increase sensitivity of MS analysis, a quadrupole time-of-flight (Q-TOF) MS [1] has been used for shotgun analysis of complex biological samples. In recent years, a more sensitive and selective approach named selected reaction monitoring (SRM), also called multiple reaction monitoring (MRM), has become increasingly popular in targeted and quantitative proteomics studies [2]. Triple quadrupole (Triple-Quad) mass analyzer enables targeting specific proteins of interest from a complex biological mixture based on precursor ions (charged peptide) and collision-induced product ions (fragmented peptide), and the SRM method provides both high sensitivity and selectivity for quantitative analysis of low abundance proteins in complex biological samples [3-5].
Matrix metalloproteinases (MMPs) are a family of zinc-dependent endopeptidases that modulate extracellular matrix proteins as well as activate or process protein receptors and regulators [6]. MMPs have been strongly implicated in multiple stages of cancer progression and promoting invasive and metastatic properties. Our recent studies suggest that MMPs in the tumor microenvironment may compromise the efficacy of therapeutic antibodies by proteolytic cleavage of antibody hinge region which results in the loss of Fc-mediated function such as antibody dependent cell mediated cytotoxicity (ADCC) [7]. Therefore, analysis of MMP expression in tumor samples is important for understanding their roles in cancer progression. Commonly used methods for studying MMP protein expression include immunoassays and zymograms using unnatural protease substrate for detection of proteolytic activities after separation on gel electrophoresis. LC-MS/MS detection method can provide high sensitivity for identification of specific proteins based on their amino acid sequences and SRM-MS can provide absolute quantitation through a purified protein standard. As expression levels of MMPs are generally in the nanogram to picogram (ngpg)/μg of cellular protein [8], method for detection of such low abundance of proteins by MS in complex biological samples is not well established. In the present work, we report a new mass spectrometry based method for identification and absolute quantification of a low abundance protein (MMP1) in cancer cell lysates using label free protein as standard and the method should applicable to detection of other low abundance proteins in complex biological samples.
2. Material and Method
2.1. Chemicals and Reagents
Urea (99.5%), dithiothreitol (DTT), iodoacetamide, acetonitrile, and ammonium bicarbonate were from SigmaAldrich (St. Louis, MO). Tris (2-carboxyethyl) phosphine (TECP) 0.5 M solution was from Thermo Scientific (Rockford, IL). Bradford Protein Assay Kit was from Bio-Rad (Hercules, CA). TPCK (L-1-tosylamido-2-phenylethyl chloromethyl ketone) treated trypsin was from AB SCIEX (Foster City, CA). Strong cation exchange (SCX) column-ICAT® and buffer kit were from Applied Biosystems (Foster City, CA). Oasis HLB 1ml (10 mg) reverse phase cartridges were from Waters (Milford, MA). Stable isotope labeled peptides were synthesized by JPT (Berlin, Germany). Recombinant human MMP-1 (produced in murine myeloma cell line) was from R&D Systems (Minneapolis, MN). Breast cancer cells lines SKBR3 and MCF-7 were obtained from American Type Culture Collection (ATCC).
2.2. Sample Preparation
Breast cancer cells SKBR3 and MCF-7 were cultured in RPMI media at 37˚C incubator, 5% CO2 as recommended by ATCC and cell extracts were prepared as previously reported [7]. Briefly, breast cancer cells were cultured to 80% - 90% confluency and cell lysates were made with RIPA buffer with EDTA (Boston BioProducts, Ashland, MA) plus protease inhibitor cocktail (EMD Millipore, Billerica, MA). Total lysate proteins were measured by Bradford protein assay kit according to manufacturer’s suggestion. One hundred microgram (100
µg) of cell lysate was dried in a SpeedVac concentrator (Thermo Electron Corporation Pty. Ltd., Elandsfontein, South Africa) to total dryness and reconstituted in 40 µl freshly prepared 8M Urea in 150 mM Tris-HCl, pH 8.5. The denatured lysate proteins were reduced by 5 mM TCEP (15 minutes at room temperature) and subsequently alkylated using 10 mM iodoacetamide for 30 minutes at room temperature in the dark. Then 240 μL of 150 mM Tris-HCl, pH 8.5 was added to dilute the urea to less than 2 M. For the tryptic protein digestion, trypsin was added to the solution at enzyme/protein ratio of 1:20 and was incubated at 37˚C for 12 hours. The digests were dried in a SpeedVac, resuspended in 0.5 ml of 10 mM KH2PO4, pH 8.0 containing 25% acetonitrile, and loaded onto a SCX column. The SCX column was washed with the same buffer and stepwise elution was performed with increasing concentrations of KCl (52.5, 105, 157.5, 253.75 and 350 mM) in the same buffer. The eluted fractions were dried again and reconstituted in 0.5 ml of 0.1% trifluoroacetic acid (TFA) in water before applying on Oasis® HLB 1ml C18 cartridges (Waters Co., Milford, MA) for desalting. Eluted fractions from SCX were dried and reconstituted in solvent containing 2% acetonitrile/0.1% formic acid (solvent A) for MS analysis.
2.3. Mass Spectrometry Instrumentation
Mass spectrometric analyses were performed on 6538 UHD Accurate-Mass Q-TOF LC/MS and 6430 TripleQuad LC/MS (Agilent Technologies, Santa Clara CA). Liquid chromatography (LC) was performed on Agilent HPLC-Chip II: G4240-62010 using a 7.5 × 150 mm C - 18 analytical column with 1 μl of sample in each injection. The mobile phase buffer was solvent A and the flow rate was 0.3 μL/minutes. Tryptic peptides were eluted with a linear gradient from 5% to 30% of Solvent B (90% acetonitrile/0.1% formic acid) over 100 minutes for Q-TOF MS and 30 minutes for Triple Quad MS. For Q-TOF experiment, electrospray voltage (V) was set at 1850 V and collision energy was set based on the equation: (slope)*(m/z)/100 + offset where slope was equal to 3.6 and offset was –4.8. For SRM analysis, collision energy was set at 100 constant value. Data acquisition and analysis were carried out using Agilent’s Workstation Software-MassHunter Qualitative Analysis (version B.04.00).
2.4. Proteomic Data Analysis
Database search for proteins and peptides matching tandem spectra of lysate sample was performed using Mascot software (Matrix Science, Boston, MA). Data files from Agilent MS spectrometers were converted to Mascot Generic Format (MGF) and searched in protein sequence database, SwissProt. The peptide mass tolerance was set at 10 ppm and the fragment ion mass tolerance was at 0.05 Da.
2.5. MMP1 Determination Using Reverse Phase Protein Array
Fifty microgram (50 μg) of protein lysate of SKBR3 cancer cells was used for MMP1 determination with the Quantibody human MMP array kit (RayBiotech Inc., Norcross, GA) according to manufacturer’s instruction. Briefly, the glass chip was blocked with BSA containing blocking solution and cancer cell lysates were added into wells in the glass slide and incubated overnight at 4˚C. The next day, the glass chip was washed 5 times (5 minutes each time) with wash buffer and detection antibody with fluorescent dye-conjugate (Cyanine 3) was added and incubated for 2 hours at 25˚C. After washing step, fluorescence signal was imaged using a GenePix 4100A (Molecular Devices, Sunnyvale, CA) and the data was analyzed using QAH-MMP1 GAL software. The concentration of MMP1 was determined based on a titration curve made from different concentrations of MMP1 standard from the array kit.
3. Results
3.1. Identification of MMP1 Using Q-TOF MS
To improve the MS sensitivity for low abundance proteins, tryptic peptides from cancer cell lysates were applied to a strong cation exchange (SCX) column for further partitioning into 5 fractions with increasing concentrations of KCl. All five fractionated lysates were analyzed by Q-TOF MS. The most abundant proteins (214 ions based on the preliminary run) were preset to be excluded during the acquisition. Mascot search picked up several MMPs among which MMP1 appeared to be dominant based on its quantitation index (score = 52; emPAI = 0.13). Table 1 presents the precursor ions from SKBR3 lysate matching a number of peptides based on MMP1 amino acid sequences (MMP1_HUMAN, P03956). The MMP1 peptides covering different regions were detected in four (#1, 2, 4, and 5) out of five fractions from the SCX separation (Table 1) and confirmed presence of MMP1 in the tryptic lysates.
3.2. Detection of MMP1 by SRM on Triple-Quad MS
Analysis of MS spectra of MMP1 digests indicated that a doubly charged peptide LTFDAITTIR showed the strongest ion intensity as well as defined tandem mass spectrum (Figure 1). Therefore a number of product ions of this peptide were chosen as transitions for SRM analysis of MMP1 on Triple-Quad MS. BLAST search (NCBI) of protein database indicates that LTFDAITTIR is a unique tryptic peptide for MMP1 protein. The selected transitions for this signature peptide LTFDAITTIR were 575.8→603.4; 575.8→674.4; 575.8→789.4; 575.8 →936.5 m/z, based on their strong ion abundances. Stable isotope labeled peptide LTFDAITTIR with [13C, 15N]Arginine was spiked at 0.2 pmol/µl into samples as internal reference. Consistent with Q-TOF MS data, all four transitions were detected by SRM on Triple Quad MS and the fraction 5 from SCX separation showed significant stronger ion intensities. Figure 2 indicates the SRM chromatogram for MMP1 transitions in fraction 5 of SCX and endogenous MMP1 transition peaks are aligned well with those corresponding heavy peptides labeled with stable isotopes at the same retention time.
3.3. Quantification of MMP1 by SRM Using Non-Isotope Labeled MMP1 Protein Standard
In our effort to quantify MMP1 concentration in SKBR3 cancer cell lysate, we tried to use non-isotope labeled MMP1 protein as a standard and to correlate MMP1 concentration with its transitional signals. Various amounts of purified human MMP1 protein (0, 50, 100 and 200 ng)
Table 1. MMP1 peptides discovered by MASCOT search in fractionated SKBR3 cell lysates.
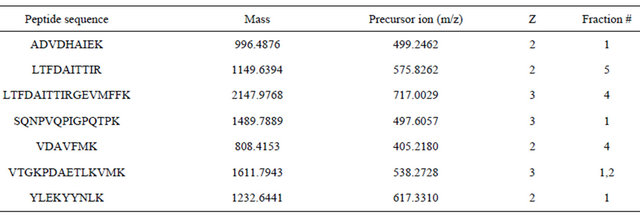
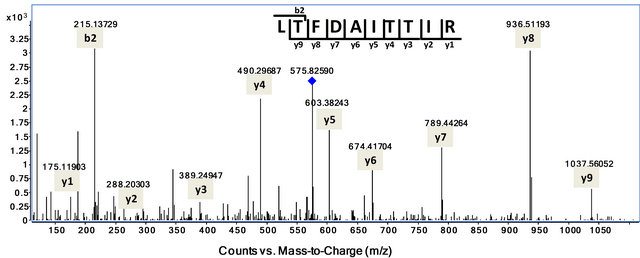
Figure 1. Tandem MS Spectrum of MMP1 peptide LTFDAITTIR (575.8 m/z, Z=2) showing product ions used as transitions for SRM. Diamond indicates precursor ion 575.8 m/z, Z=2. All the y-ions (y1-y9) and one b-ion (b2) were marked on the peptide sequence. The experiments were repeated 3 times and representitive of mass spectra is shown.
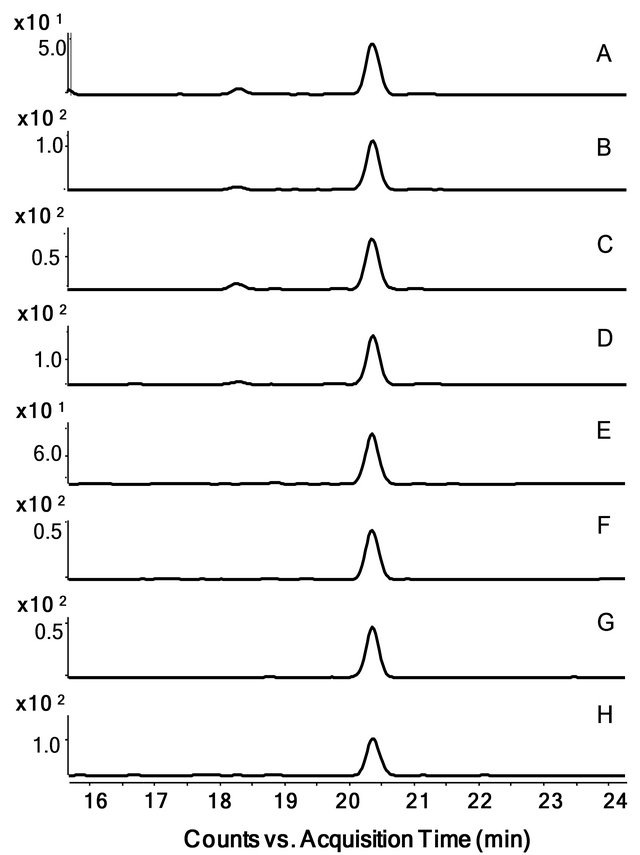
Figure 2. Extracted SRM chromatograms of MMP1 transitions detected in fractionated SKBR3 cell lysate on Triple-Quad MS. Stable isotope labeled peptide LTFDAITTIR (Label:13C(6)15N(4)) was spiked at 0.2 pmol/µl into SCX partitioned SKBR3 cell lysate (fraction #5) and measured on Triple-Quad LC/MS (Agilent Technologies) coupled to Agilent HPLC-Chip II: G4240-62010 as described in the Method section. SRM chromatograms (one from triplicate runs) for all LTFDAITTIR transitions were extracted using Agilent’s MassHunter Qualitative Analysis Software. Panels A through D show transitions of spiked heavy peptide (A: 580.8→613.4 m/z; B: 580.8→684.4 m/z; C: 580.8→799.4 m/z; D: 580.8→946.5 m/z). Panels E through H show transitions of natural peptide from lysate sample (E: 575.8→603.4 m/z; F: 575.8→674.4 m/z; G: 575.8→789.4 m/z; H: 575.8→936.5 m/z).
were spiked individually into an aliquot of 100 µg cell lysate made from MCF-7 cancer cells that have no detectable level of MMP1 based on data from antibody array analysis (Figure 3). The MMP1 protein standard was spiked in MCF-7 cancer cell lysates and analyzed using the same procedures as that for SKBR3 cell lysates on Triple Quad LC/MS. For quantification, the signal from transition 575.8→789.4 m/z in peptide LTFDAITTIR was used for developing standard curve and calculating the amounts of MMP1 protein. The transition 575.8→ 789.4 m/z in MCF-7 lysate without spiked standard was at background level, suggesting that endogenous MMP1 in MCF-7 cells had little contribution to the ion intensity. Ion intensities (integrated peak area) of the transition 575.8→789.4 m/z were plotted against the corresponding concentrations of spiked MMP1 standard in MCF-7 lysate and the ion intensities showed linear correlation with MMP1 concentrations (Figure 4). MMP1 protein concentration in SKBR3 cell lysates (0.85ng/µg total lysate protein) was calculated using the standard curve. In order to evaluate the sensitivity and accuracy of the method, the same lysates were also assayed using immune based protein array method. The MMP1 concentration obtained by SRM approach in SKBR3 cell lysates was comparable to that determined by the protein array assay at 0.85 ng/µg and 0.99 ng/µg protein (Figure 3), respectively.
4. Discussion
Antibody based immuno assays are commonly used for detecting low abundance protein from complex biological samples. Since immune assays depend on specific antibodies for detection, lack of available antibody reagents or poor quality of reagents often pose limitation on reliability of immune assays. With increased resolution and sensitivity, MS technology is increasingly used for quantitative protein analysis and biomarker discovery. In comparison with immune assays, sequence based MS analysis provides advantage of unambiguous sequence identification of target proteins and has no need for expensive antibody reagents that are necessary in immune based assays.
LC-MS/MS applications can be classified into two general categories: qualitative and quantitative analysis [9]. Qualitative analysis typically is used for identification of unknown target compounds in applications such as
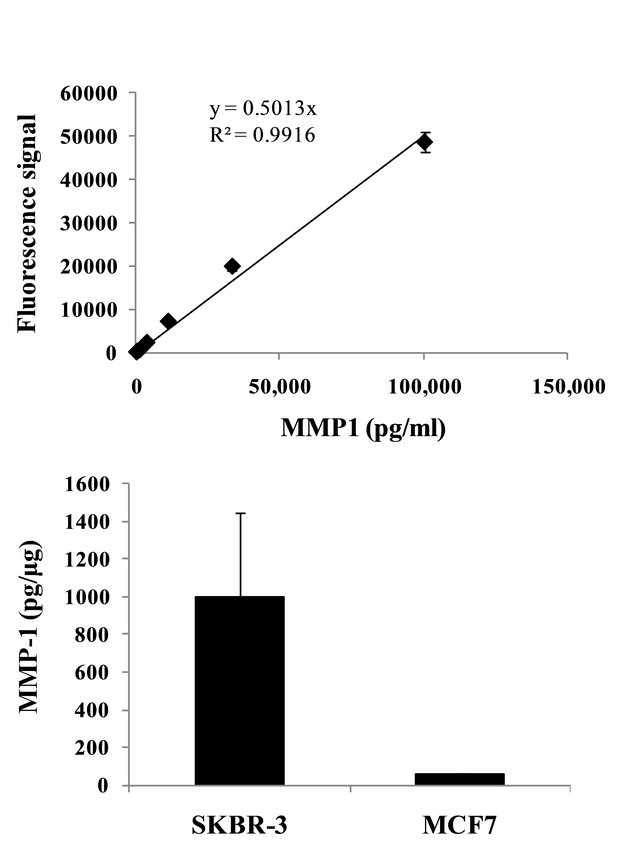
Figure 3. MMP1 detection using an antibody array method. The concentrations of MMP1 from SKBR3 and MCF-7 cell lysates (lower bar graph) were determined based on a titration curve (upper plot) made from various quantities of standard MMP1 antigen (137 - 100,000 pg/ml, in 3-fold titration) supplied in the array kit. Each assay points have 4 replications (n = 4) and error bars show the standard deviations. Formula derived from the linear slope and correlation coefficient (shown in the graph insert) were generated using linear fitting with GraphPad Prism software.
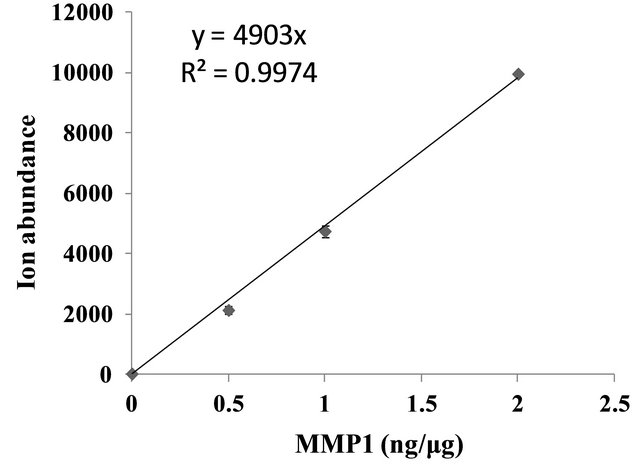
Figure 4. MMP1 protein standard curve based on transition (575.8→789.4 m/z). MCF-7 cell lysate spiked with different amount of MMP1 (0, 50, 100 and 200 ng) were trypsin digested and processed in the same fashion as that for SKBR3 cell lysate. The ion abundance signals (Y-Axis) from MMP1 peptide transition 575.8→789.4 m/z on Triple Quad LC/MS were plotted against the amounts of MMP1 protein spiked in MCF-7 lysates (X-axis). The ion intensity of transition represents average of integrated peak area (n = 3) and error bar indicates the standard deviations. Formula derived from the linear slope and correlation coefficient (shown in the graph insert) were generated using linear fitting with GraphPad Prism software.
proteomic profiling. This type of analysis requires the acquisition of a complete mass spectrum for each chromatographic data point. The TOF (as well as Fourier transform) mass analyzer can obtain high-resolution mass spectra throughout a broader mass range with great sensitivity and is well suited for qualitative analysis. Quantitative applications, on the other hand, often target specific known compounds, which makes the acquisition of a complete mass spectrum unnecessary. However, it demands the lowest detection limit. Despite somewhat lower mass resolution, the quadrupole mass analyzer generally achieves lower detection limit by operating under selected-ion monitoring, therefore better suited for quantitative analysis. SRM approach used in this study which is primarily performed on triple quadrupole mass spectrometer maximizes the selection and quantification power of quadrupole mass analyzer for targeted proteomics. In addition, proper sample purification is often required to achieve best sensitivity for both types of analyses, especially in detecting low abundance proteins. Nevertheless, it is still very challenging to have high sensitivity and quantitative MS analysis to detect low abundance proteins such as growth factors and regulators like MMP1 in complex biological samples. The reported lowest detection limit in complex biological samples currently ranges from 1 - 10 ng/ml in plasma [5] and sensitivity of MS detection in cell lysates is not well established. This study demonstrated that combination use of Q-TOF and SRM mass spectrometry can provide detection at nanogram to picogram level in cell lysates and the sensitivity is comparable to that by immune assays.
In this report we presented an example of detecting a low abundance protein MMP1 in cancer cell lysates by Q-TOF and SRM on Triple Quad MS. The overall working flow is summarized in Figure 5. To facilitate the detection of low abundance proteins, this study used sample enrichment through ion exchange chromatography and setting exclusion list for most abundant ions to lower the proteomic complexity in cell lysate mixture. Moreover, the MS/MS spectra of MMP1 peptides directly provided the chance to select transitions that would be used in SRM analysis. By employing both enrichment through SCX separation and SRM quantitation using selective peptide sequences from MMP1, we were able to determine MMP1, a low abundant protein, in complex cancer cell lysates with assay sensitivity comparable to that using immune based reverse phase protein array method in low picogram per microgram of cell lysate. Although proteomic tools (e.g. Skyline, MaxQaunt) are available to obtain transitions based on protein sequences, the best way of obtaining sensitive and reliable transitions is still through shotgun proteomic data using protein of interest [10]. This approach is particularly effective when the instrument for qualitative analysis is compatible to that for SRM based quantification. In this study, we used Agilent’s 6538 Q-TOF LC/MS and 6430 TripleQuad LC/MS that allows instrumental settings from Q-TOF LC/MS directly applicable to triple-quad LC/MS for SRM detection.
Based on MS/MS spectra of MMP1 peptides, we selected four product ions from a MMP1 signature peptide LTFDAITTIR (575.8 m/z) as transitions for SRM measurement because they were the strongest product ions shown on the spectra of all MMP1 precursor ions detected on Q-TOF MS. All four transitions were detectable by SRM on triple-quad MS for fractionated SKBR3 lysates.
SRM based quantification is usually conducted based on stable isotope-labeled standard (SIS) peptides [11]. Absolute quantification can be achieved by comparing the transition signal of the “heavy” reference peptide with that of a “light” endogenous peptide that results from proteolytic cleavage of the target protein. However, there is always a bias for the quantity of target protein to be represented by that of its proteolytic digests due to the fact that both the degree of protease digestion of any given protein and the ionization efficiency of its proteolytic peptides are not known. To overcome the limitation of using SIS peptide as titration standard, a new strategy (Protein Standard Absolute Quantification) that uses in
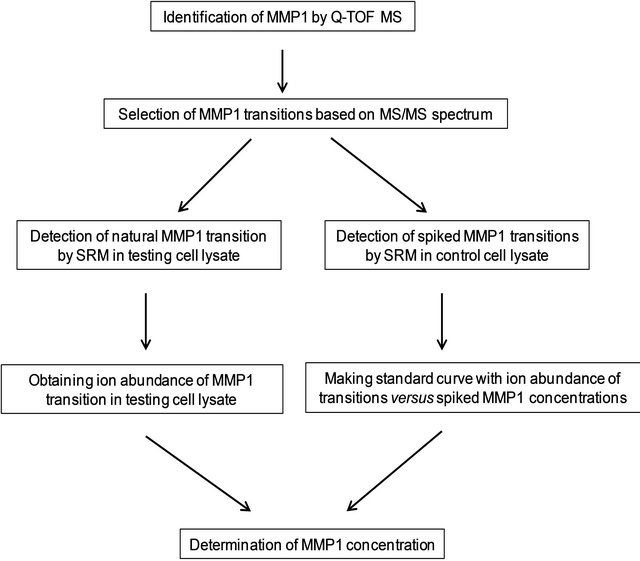
Figure 5. Diagram of key steps used for the quantitative measurement of MMP1.
vitro synthesized isotope-labeled full-length proteins as standards is merging as a powerful tool for absolute quantification [12]. As those protein standards perfectly match the biochemical properties of the target proteins, they can be directly added into the samples to be analyzed, allowing a highly accurate quantification of proteins even in complex samples. However, this approach can be expensive and time consuming. Although some efforts have been made to lower the production cost of isotope labeled protein such as implanting multiple transitions into a single hybrid protein [13], spiking entire labeled protein as quantification reference is still necessary if the complex biological sample needs to go through purification steps for target protein enrichment. Here we demonstrated the feasibility of protein quantification by SRM using non-labeled target protein as titration standard. Major advantages of using non-isotope protein as standard are simple and cost effective, as compared to making its full length isotope labeled counterpart.
Although the quantitative determination using the nonlabeled protein standard requires analysis of the purified protein in a background negative lysate, the approach can work effectively by selecting the “control lysate” for spiking pure target protein with low interference. As both control lysate with spiked standard and sample lysates were processed under identical condition, experimental variation in the assay should be cancelled when calculating the testing samples using the control spiked standard curve. The control should have similar proteomic background to the testing sample with undetectable amount of target protein. Shotgun proteomic analyses of cell lysates from both SKBR3 and MCF-7 cells on Q-TOF LC/MS showed that their base peak chromatograms (BPC) were well overlapped, suggesting very similar proteomic background for the two cell lines. In addition, we picked MCF-7 cells because it had undetectable target protein MMP1 by MS method. If fractionation of lysates is necessary, it is also important for both target and standard proteins to undergo identical treatment. Overall, the method described in this study showed clear advantage over peptide based quantification in its accuracy. It can provide a good alternative when the production of isotope labeled full length protein is not available.
5. Conclusion
This study demonstrated the possibility of using SRM based mass spectrometry for quantitative measurements of low abundance proteins with sensitivity comparable to immune assays. This method can provide valuable alternative to immune assays for quantitative analysis of low expressing cellular proteins without needs of using specific antibodies for detection. This method also employed non-isotope labeled protein standard and provided a cost saving approach in comparison with commonly reported mass spectrometry for quantitative determination of proteins using isotope-labeled internal standard.
6. Acknowledgements
We thank Dr Nataliya Bulayeva for her technical assistance.
REFERENCES
- I. V. Chernushevich, A. V. Loboda and B. A. Thomson, “An Introduction to Quadrupole-Time-of-Flight Mass Spectrometry,” Journal of Mass Spectrometry, Vol. 36, No. 8, 2001, pp. 849-865. doi:10.1002/jms.207
- V. Lange, P. Picotti, B. Domon and R. Aebersold, “Selected Reaction Monitoring for Quantitative Proteomics: A Tutorial,” Molecular Systems Biology, Vol. 4, No. 222, 2008, pp. 1-14. doi:10.1038/msb.2008.61
- L. Anderson and C. L. Hunter, “Quantitative Mass Spectrometric Multiple Reaction Monitoring Assays for Major Plasma Proteins,” Molecular & Cellular Proteomics, Vol. 5, No. 4, 2006, pp. 573-588. doi:10.1074/mcp.M500331-MCP200
- P. Mitchell, “Proteomics Retrenches,” Nature Biotechnology, Vol. 28, No. 7, 2010, pp. 665-670. doi:10.1038/nbt0710-665
- H. Keshishian, T. Addona, M. Burgess, E. Kuhn and S. A. Carr, “Quantitative, Multiplexed Assays for Low Abundance Proteins in Plasma by Targeted Mass Spectrometry and Stable Isotope Dilution,” Molecular & Cellular Proteomics, Vol. 6, No. 12, 2007, pp. 2212-2229. doi:10.1074/mcp.M700354-MCP200
- G. Murphy and H. Nagase, “Progress in Matrix Metalloproteinase Research,” Molecular Aspects of Medicine, Vol. 29, No. 5, 2008, pp. 290-308. doi:10.1016/j.mam.2008.05.002
- X. Fan, R. J. Brezski, M. Fa, H. Deng, A. Oberholtzer, A. Gonzalez, W. P. Dubinsky, W. R. Strohl, R. E. Jordan, N. Zhang and Z. An, “A Single Proteolytic Cleavage within the Lower Hinge of Trastuzumab Reduces Immune Effector Function and in Vivo Efficacy,” Breast Cancer Research, Vol. 14, No. 4, 2012, p. R116. doi:10.1186/bcr3240
- A. Kohrmann, U. Kammerer, M. Kapp, J. Dietl and J. Anacker, “Expression of Matrix Metalloproteinases (MMPs) in Primary Human Breast Cancer and Breast Cancer Cell Lines: New Findings and Review of the Literature,” BMC Cancer, Vol. 9, No. 188, 2009, pp. 1-20. doi:10.1186/1471-2407-9-188
- B. K. Choi, D. M. Hercules, T. Zhang and A. I. Gusev, “Comparison of Quadrupole, Time-of-Flight, and Fourier Transform Mass Analyzers for LC-MS Applications,” Current Trends in Mass Spectrometry, Vol. 18, No. 5S, 2003, pp. 524-531.
- A. Prakash, D. M. Tomazela, B. Frewen, B. Maclean, G. Merrihew, S. Peterman and M. J. Maccoss, “Expediting the Development of Targeted SRM Assays: Using Data from Shotgun Proteomics to Automate Method Development,” Journal of Proteome Research, Vol. 8, No. 6, 2009, pp. 2733-2739. doi:10.1021/pr801028b
- D. S. Kirkpatrick, S. A. Gerber and S. P. Gygi, “The Absolute Quantification Strategy: A General Procedure for the Quantification of Proteins and Post-Translational Modifications,” Methods, Vol. 35, No. 3, 2005, pp. 265-273. doi:10.1016/j.ymeth.2004.08.018
- V. Brun, A. Dupuis, A. Adrait, M. Marcellin, D. Thomas, M. Court, F. Vandenesch and J. Garin, “Isotope-Labeled Protein Standards: Toward Absolute Quantitative Proteomics,” Molecular & Cellular Proteomics, Vol. 6, No. 12, 2007, pp. 2139-2149. doi:10.1074/mcp.M700163-MCP200
- R. J. Beynon, M. K. Doherty, J. M. Pratt and S. J. Gaskell, “Multiplexed Absolute Quantification in Proteomics Using Artificial QCAT Proteins of Concatenated Signature Peptides,” Nature Methods, Vol. 2, No. 8, 2005, pp. 587- 589. doi:10.1038/nmeth774
NOTES
*Funding source: This work was supported in part by a grant from Janssen Research & Development, L.L.C and the Welch Foundation Grant AU00024.
#Corresponding authors.