Journal of Analytical Sciences, Methods and Instrumentation
Vol.2 No.3(2012), Article ID:23284,4 pages DOI:10.4236/jasmi.2012.23025
Flow Injection Analysis of Hydrazine in the Aqueous Streams of Purex Process by Liquid Chromatography System Coupled with UV-Visible Detector
![]()
Reprocessing Group, Indira Gandhi Centre for Atomic Research, Kalpakkam, India.
Email: velp@igcar.gov.in
Received January 30th, 2012; revised March 12th, 2012; accepted April 12th, 2012
Keywords: Hydrazine; Liquid Chromatography; Purex Process; Flow Injection Analysis; Para-Dimethylaminobenaldehyde; UV-Vis Detector
ABSTRACT
Present study describes the development of a rapid, sensitive and selective flow injection analysis of hydrazine in the aqueous streams of purex process by liquid chromatography system coupled with UV-Visible detector. The method is based on the formation of yellow coloured azine complex by reaction of hydrazine with para-dimethy laminobenzaldehyde (pDMAB). The formed yellow coloured complex is stable in acidic medium and has a maximum absorption at 460 nm. The presence of uranium in hydrazine solution is not interfering in the analysis. Under optimum condition, the absorption intensity linearly increased with the concentration of hydrazine in the range from 0.05 - 10 mg·L–1 with a correlation coefficient of R2 = 0.9999 (n = 7). The experimental detection limit is 0.05 mg·L–1. The sampling frequency is 15 samples·h–1 and the relative standard deviation was 2.1% for 0.05 mg·L–1. This method is suitable for automatic and continuous analysis and successfully applied to determine the concentration of hydrazine in the aqueous stream of nuclear fuel reprocessing.
1. Introduction
Hydrazine and its derivatives have been used in industries, agriculture and other fields, including photographic development, oxygen scavenging, rocketry, explosives, and insecticides and blowing agents for plastics [1]. In nuclear fuel reprocessing industry hydrazine is used as a stabilizing reagent to keep uranium and plutonium in a stable oxidation state [2]. It acts as a scavenger for nitrous acid which is responsible for converting U (IV) and Pu (III) to U (VI) and Pu (IV), respectively [3]. Hydrazine reacts with nitrous acid to form hydrogen azide.

In alternate solvent cleanup process hydrazine compounds were used to reduce the quantity of waste generated in the Purex process [4]. An application is the use of hydrazine nitrate-HNO3-KF solutions for dissolving plutonium metal [5]. However, hydrazine is a local irritant that is readily absorbed through the skin, and its inhalation results in respiratory tract irritation, bronchititis and pulmonary edema. Furthermore, hydrazine is suspected of being a mutagen and carcinogenic compound. Environmental Protection Agency and Agency for Toxic Substance and Disease Registry calculated an intermediate inhalation minimum risk level of 0.004 µg·mL–1 and in work place air not exceed 0.03 µg·mL–1 for a 2 h period. Thus, because of its toxicological effects and industrial significance, its detection by automatic and continuous analysis has attracted considerable analytical interest. Various methods are described in the literature for the determination of hydrazine, using different analytical techniques, such as spectrophotometric [6-8], spectrofluorimetric [9,10], voltametric [11,12], amperometric [13], coulometric [14], titrimetric [15], potentiometric [16,17], gas chromatographic [18], ion selective electrode [19] and indirect methods [20,21]. Though most of these methods are recommended for various applications. Many automatic flow injection techniques have been used for the determination of hydrazine [22]. Some of the sensitive methods are based on the construction of chemical sensors/electrodes for carefully controlled conditions or, in some, complete on selectivity. Therefore, the need for a simple, sensitive, fast and reliable method for the determination of hydrazine is realized. The proposed method is applied successfully for the determination of hydrazine in the aqueous streams of purex process by liquid chromatography system coupled with UV-VIS detector. The developed method is applicable for all trace level as well as higher concentration of hydrazine in the aqueous streams and the results were compared with the standard methods.
2. Experimental
2.1. Reagents
Stock solutions of hydrazine (0.3 - 1.0 M) were prepared by diluting hydrazine nitrate, obtained from Orion Chem. Pvt.Ltd., Mumbai, in millipore water and standardized as per standard procedure [23,24]. Working solutions were prepared freshly every day by dilution from this stock solution. Nuclear grade U3O8 was dissolved in 1:1 HNO3 and uranium concentration was determined by potentiometric redox titration using Davies and Gray method [25]. Para-dimethylaminobenzaldehyde (Purity > 99%) was used as complexing reagent. All other reagents employed were analytical grade and the solutions were prepared with Millipore water.
2.2. Instrumentation
Metrohm make modular liquid chromatographic system equipped with with lambda 1010 detector (UV-VIS) with 10 mm optical path length used. Isocratic pump (818) is used to deliver carrier solution accurately. Liquid handling unit (833) is a peristaltic pump that is used to deliver reagent mixture. Sample was injected through a 20 µl PEEK loop fitted with injector. IC-net 2.3 metrohm software was used for instrument control and data acquisition. A schematic diagram of FIA setup is shown in Figure 1.
2.3. Parameters Used
Concentration of carrier solution: 5 mM Hydrochloric acid;
Flow rate of carrier solution: 0.4 ml/min;
Flow rate of reagent: 0.6 ml/min;
Pump Pressure (Carrier solution): 13.5 Mpa;
Detector: Lambda 1010 UV-VIS detector;
Injection loop: 20 µl;
Temperature: Ambient (25˚C);
Run time: 5 min;
Quantitation: Peak area.
3. Procedure
Flow injection analysis (FIA) is a continuous flow analysis, samples and standards are injected in to the continuously flowing stream of reagents. A stock hydrazine solution was prepared in millipore water and from this stock solution various hydrazine standards were prepared. Hydrochloric acid (5 mM) with a flow rate of 0.4 ml/min was used as carrier solution. A mixture of para-dimethylaminobenzaldehyde (42 mM), hydrochloric acid (0.6 M) and methanol (1%) with a flow rate of 0.6 ml/min was used as complexing reagent. Standard and samples were injected through 20 µL PEEK loop. Absorbance was measured at 460 nm wavelength using Metrohm Lambda 1010 UV-VIS detector with 10 mm optical path length.
4. Result and Discussion
Figure 1 is the schematic diagram of FIA setup. FIA is an automated method in which sample is injected into a continuous flow of carrier solution that mixes with other continuously flowing solutions before reaching detector. Present developed method is the flow injection analysis of hydrazine in presence of U (IV) in nitric acid medium. In one stream (R1) hydrochloric acid with a flow rate of 0.4ml/min was allowed to flow continuously through reactor using 818 Isocratic pump (P1). While another stream (R2) para-dimethylaminobenzaldehyde, hydrochloric acid and methanol solutions mixture was continuously flowing through reactor with a flow rate of 0.6 ml/min using 833 liquid handling units (P2). Hydrazine standards (S) and samples (S) were injected into the carrier stream with an aid of an injection valve (20 μl loop) and complex formation has occurred in the reactor before reaching the detector (D). Figure 2 shows the formation of yellow coloured azine complex by the reaction between hydrazine and the complexing agent para-dimethylaminobenzaldehyde. The complex is stable in acidic medium and has maximum absorption at 460 nm which was detected by lambda 1010 UV-VIS detector with 10 mm optical path length. Figure 3 refers typical calibration graph. Under optimum condition, the absorption intensity linearly increased with the concentration of hydrazine in the range from 0.05 - 10 mg·L–1
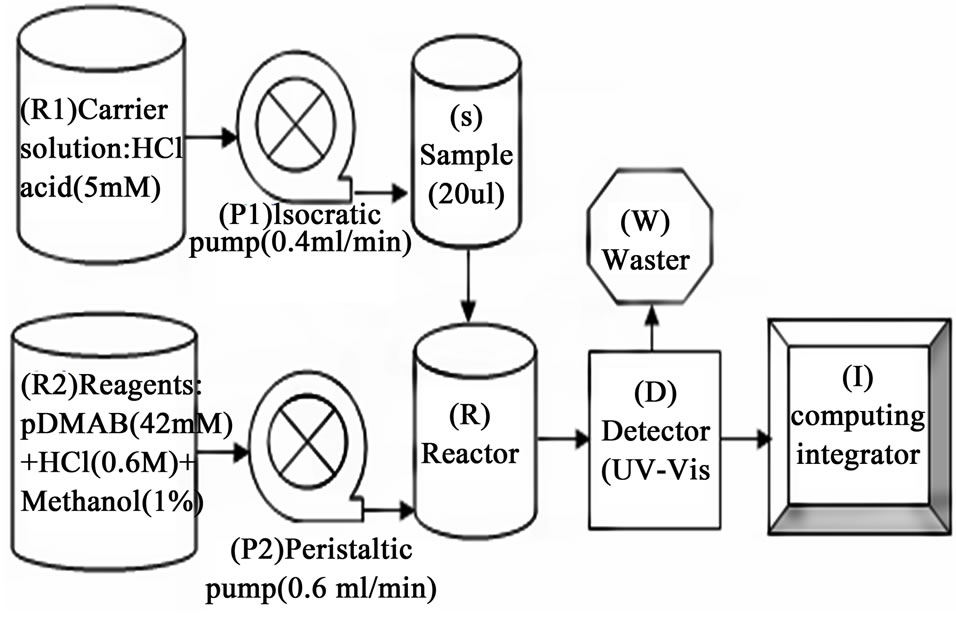
Figure 1. Schematic diagram of FIA setup.

Figure 2. Hydrazine formed yellow coloured azine complex with pDMAB.
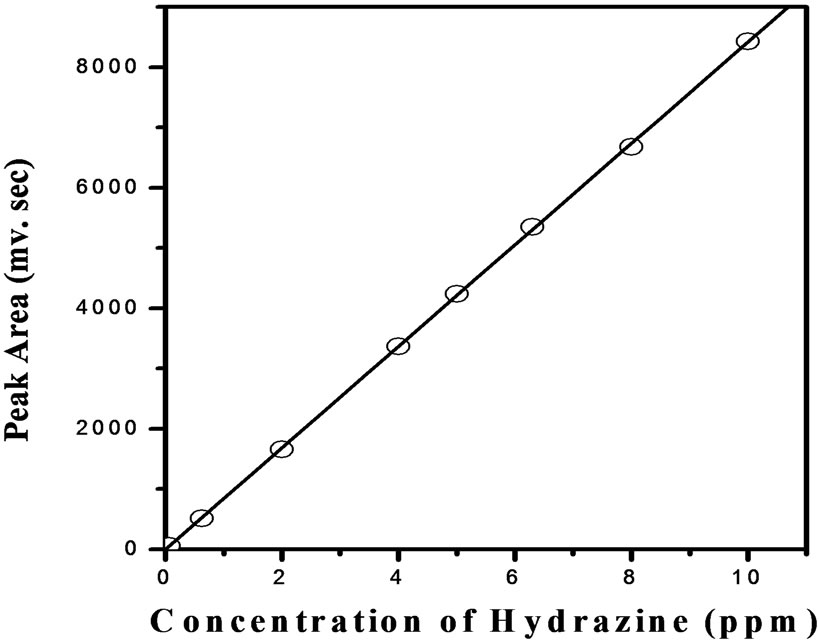
Figure 3. Calibration graph for the determination of hydrazine based on formation of yellow coloured azine complex with pDMAB.
with a correlation coefficient of R2 = 0.99992 (n = 7). The experimental minimum detection limit is 0.05 mg·L–1. The sampling frequency is 15 samples h–1 and the relative standard deviation was 2.1% for 0.05 mg·L–1. Figure 4 is typical chromatogram of the hydrazine standard (10 ppm). A sharp narrow hydrazine peak is eluted at 0.95 min. The concentration of hydrazine in the sample was determined by comparing peak area of each obtained chromatogram with standard calibration graph as shown in Figure 3. Figure 5 refers chromatogram of hydrazine in presence of uranium and nitrate ions. The results reveal that the azine complex formation is selective for hydrazine and no interference due to presence of uranium/nitrate ions in the hydrazine solution was observed and the complex has maximum absorption at 460 nm. Higher concentrations of hydrazine can be determined by diluting the sample and applying appropriate dilution factor. The present developed FIA method is applicable to hydrazine estimation in the aqueous streams of nuclear fuel reprocessing solutions containing U (IV) and nitric acid. The efficiency of the developed
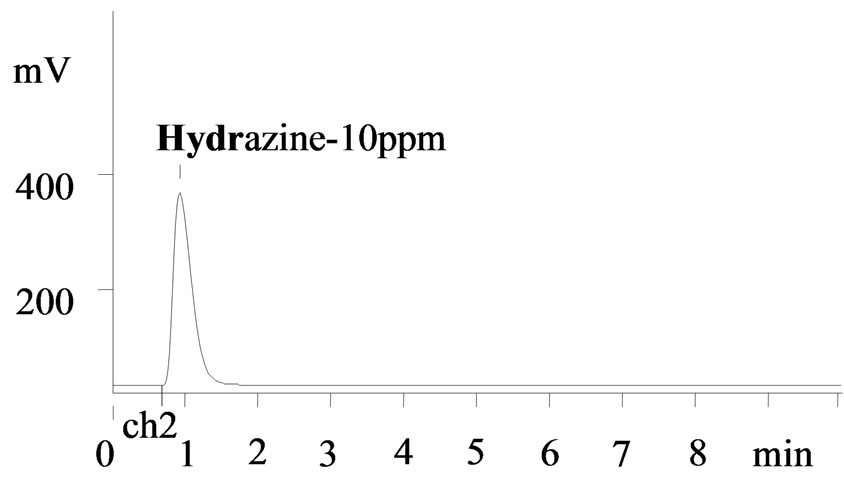
Figure 4. Chromatogram of hydrazine standard (10 ppm) after complex formation with pDAB. Volume injected: 20 ul, Wavelength: 460 nm, Detector: UV-Vis.
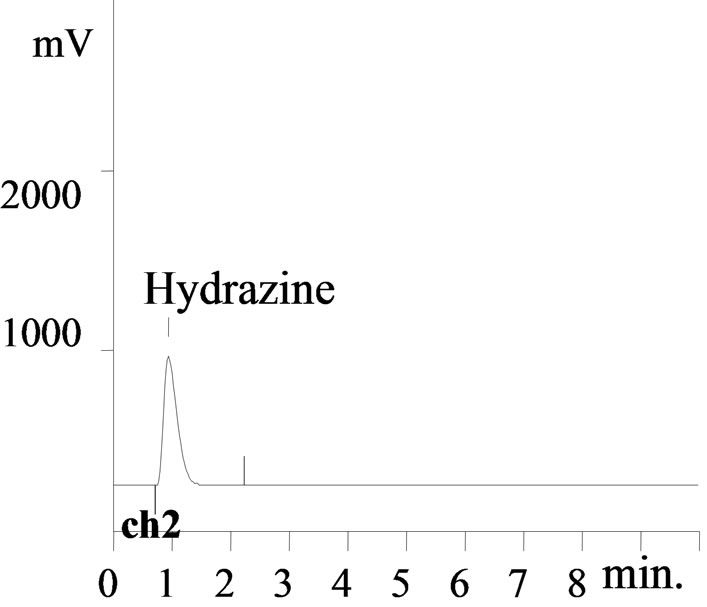
Figure 5. Chromatogram of Hydrazine (0.5 M) in presence of 7 g/L U (IV) and nitric acid (0.5 M) after complexation with pDMAB, Volume injected: 20 ul, DF: 1000, Wavelength: 460 nm, Detector: UV-Vis.
FIA technique for the determination of hydrazine in real samples were established by comparing the results with those obtained by standard spectrophotometric and titrimetric methods (Tables 1 and 2). These results are found to be in good agreement. The simplicity and rapidity of the proposed method are better than the standard spectrophotometric method and titrimetric methods.
5. Conclusion
FIA of hydrazine in the aqueous streams of Purex process by liquid chromatography system coupled with UV-Visible detector using the complexing reagent pdimethyl amino benzaldehyde is developed. The method is simple, automatic, selective, sensitive and rapid compared to other standard methods. The present method is applicable to all ranges of nitric acid, uranium and hydrazine concentration relevant to Purex process used in nuclear fuel reprocessing.
6. Acknowledgements
The authors are extremely grateful to Shri. S. C. Chetal
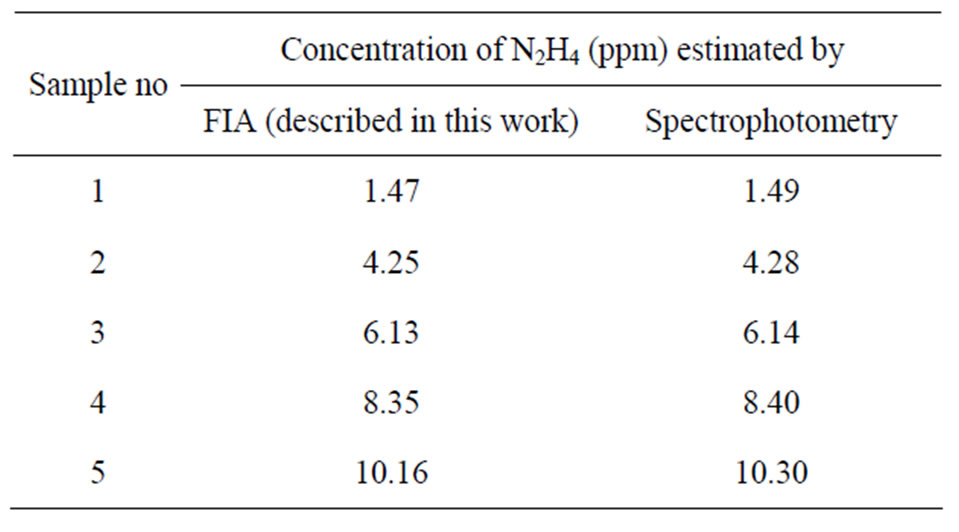
Table 1. Comparison of estimated values of N2H4 by present method and standard spectrophotometric method.
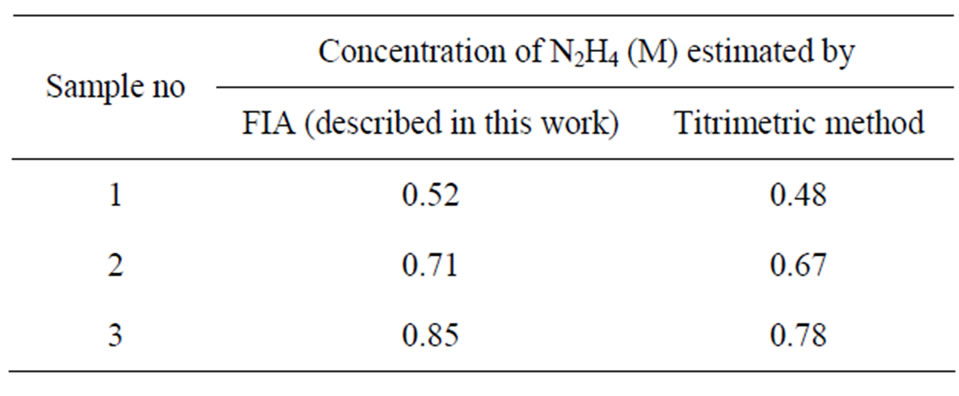
Table 2. Comparison of estimated values of N2H4 by present method and standard titrimetric method.
director, IGCAR, Kalpakkam. The authors also wish to express their sincere thanks to Mr. A. Chinnusamy, Smt. S. Varalakshmi and Smt. Ramakannan for their support during this work.
REFERENCES
- L. F. Audrieth and B. A. Ogg, “The Chemistry of Hydrazines,” John Wiley & Sons, Inc., New York, 1951, p. 225.
- N. S. B. Singh, S. V. Mohan and G. R. Balasubramanian, “Simutlanous Determination of U (IV) and Hydrazine,” Radiochimica Acta, Vol. 72, No. 2, 1996, p. 93.
- P. Biddle and J. H. Miles, “Rate of Reaction of Nitrous Acid with Hydrazine and with Sulphamic Acid: Its Application to Nitrous Acid Control in Two-Phase in Dustrial Systems,” Journal of Inorganic and Nuclear Chemistry, Vol. 30, No. 5, 1968, pp. 1291-1297.
- J. C. Mailen and O. K. Tallent, “Review of Recent ORNL Studies in Solvent Cleanup and Diluents Degradation. Consolidated Fuel-Reprocessing Program,” Report Conference 821056, Vol. 8, 1982.
- D. G. Karraker, “The Oxidation of Hydrazine by Nitric Acid,” USDOE Report DP-1666, 1983.
- R. Kaveeshwar and V. K. Gupta, “A New Spectrophotometric Method for the Determination of Hydrazine in Environmental Samples,” Fresenius Journal of Analytical Chemistry, Vol. 344, No. 3, 1992, pp. 114-117. doi:10.1007/BF00325125
- O. A. Sire and J. Burno, “Spectrophotometric Determination of Micro Amounts of Hydrazine and Hydroxylamine Alone and in the Presence of Each Other,” Talanta, Vol. 26, 1979, pp. 47-49.
- S. Wang, L. Du, A. Zhang and D. Liu, “Kinetic Spectrophotometric Determination of Hydrazine with Neutral Red-Nitrite System,” Mikrochimica Acta, Vol. 134, 2000, p. 167.
- A. A. Ensafi and B. Naderi, “Flow Injection Determination of Hydrazine with Fluorimetric Detection,” Talanta, Vol. 47, No. 3, 1998, pp. 645-649. doi:10.1016/S0039-9140(98)00113-1
- M. L. Balconi, F. Sigon, M. Borgarello, R. Ferraroli and F. Realini, “Flow-Injection Analysis for Power Plants: Evaluation of Detectors for the Determination of Control Parameters in Conditioned Water-Steam Cycles,” Analytica Chimica Acta, Vol. 234, 1990, pp. 167-173. doi:10.1016/S0003-2670(00)83552-7
- M. Yang and H. L. Li, “Determination of Trace Hydrazine by Differential Pulse Voltammetry Using Magnetic Microspheres,” Talanta, Vol. 55, No. 3, 2001, pp. 479- 484. doi:10.1016/S0039-9140(01)00456-8
- J. Wang and Z. Taha, “Catalytic-Adsorptive Stripping Voltammetric Measurements of Hydrazines,” Talanta, Vol. 35, No. 12, 1988, pp. 965-968. doi:10.1016/0039-9140(88)80229-7
- S. Ikeda, H. Sutake and Y. Kohri, “Flow Injection Analysis with Amperometric Detector Utilizing the Redox Reaction of Iodate Ion,” Chemistry Letters, Vol. 13, No. 6, 1984, pp. 873-876. doi:10.1246/cl.1984.873
- E. Athanasio-Malaki and M. K. Koupparis, “Kinetic Study of the Determination of Hydrazines, Isoniazid and Sodium Azide by Monitoring Their Reactions with 1- Fluoro-2,4-dinitrobenzene, by Means of a Fluoride-Selective Electrode,” Talanta, Vol. 36, No. 4, 1989, pp. 431-436. doi:10.1016/0039-9140(89)80224-3
- J. Huamin, H. Weiying and W. Erkany, “Amperometric Flow-Injection Analysis of Hydrazine by Electrocatalytic Oxidation at Cobalt Tetraphenylporphyrin Modified Electrode with Heat Treatment,” Talanta, Vol. 39, No. 1, 1992, pp. 45-50. doi:10.1016/0039-9140(92)80048-I
- J. R. Stetter, K. F. Blurton, A. M. Valentine and K. A. Tellefsen, “The Electrochemical Oxidation of Hydrazine and Methylhydrazine on Gold: Application to Gas Monitoring,” Journal of the Electrochemical Society, Vol. 125, No. 11, 1978, pp. 1804-1807. doi:10.1149/1.2131299
- S. Ganesh, F. Khan, M. K. Ahmed and S. K. Pandey, “Potentiometric Determination of Free Acidity in Presence of Hydrolysable Ions and a Sequential Determination of Hydrazine,” Talanta, Vol. 85, No. 2, 2011, pp. 958-963. doi:10.1016/j.talanta.2011.05.001
- W. R. McBride, R. A. Heny and S. Skolnik, “Potentiometric Analytical Methods for Hydrazino Compounds. Sydrazine Sulfate,” Analytical Chemistry, Vol. 23, No. 6, 1951, pp. 890-893. doi:10.1021/ac60054a016
- V. Vatsala, V. Bansal, D. K. Tuili, M. M. Rai, M. M. Jian, S. P. Srivastava and A. K. Bhatnagar, “Gas Chromatographic Determination of Residual Hydrazine and Morpholine in Boiler Feed Water and Steam Condensates,” Chromatorgraphia, Vol. 38, No. 7-8, 1994, pp. 456-460. doi:10.1007/BF02269836
- N. M. Ratcliffe, “Polypyrrole-Based Sensor for Hydrazine and Ammonia,” Analytica Chimistry Acta, Vol. 239, 1990, pp. 257-262. doi:10.1016/S0003-2670(00)83859-3
- H. A. Safavi, F. Sedaghatpour and M. R. H. Nezhad, “Indirect Simultaneous Kinetic Determination of Semicarbazide and Hydrazine in Micellar Media by H-Point Standard Addition Method,” Talanta, Vol. 59, No. 1, 2003, pp. 147-153. doi:10.1016/S0039-9140(02)00465-4
- A. A. Ensafi and B. Naderi, “Flow-Injection Spectrophotometric Determination of Hydrazine,” Microchemical Journal, Vol. 56, No. 3, 1997, pp. 269-275. doi:10.1006/mchj.1996.1403
- A. M. Haji Shabani, S. Dadfarnia and K. Dehghan, “Indirect Spectrophotometric Determination of Trace Quantities of Hydrazine,” Bulletin of the Korean Chemical Society, Vol. 25, No. 2, 2004, pp. 213-215. doi:10.5012/bkcs.2004.25.2.213
- J. Mendham, R. C. Denney, J. D. Barnes and M. Thomas, “Vogel’s Text Book of Quantitative Chemical Analysis,” 6th Edition, Prentice Hall, Upper Saddle River, 2002, p. 441.
- W. Davies and W. Gray, “A Rapid and Specific Titrimetric Method for the Precise Determination of Uranium Using Iron (II) Sulphate as Reductant,” Talanta, Vol. 11, No. 8, 1964, pp. 1203-1211. doi:10.1016/0039-9140(64)80171-5