 American Journal of Plant Sciences, 2015, 6, 2426-2438 Published Online September 2015 in SciRes. http://www.scirp.org/journal/ajps http://dx.doi.org/10.4236/ajps.2015.614245 How to cite this paper: Avendaño, R., Díaz, E.G., Valdez-Melara, M., Solano, N.C., Villalob os, A.M., Cascante, F.A., Bena- vides, B.W. and So lís -Ramos, L.Y. (2015) Genetic Diversity Analysis of Jatropha Species from Costa Rica Using AFLP Markers. American Journal of Plant Sciences, 6, 2426-2438. http://dx.doi.org/10.4236/ajps.2015.614245 Genetic Diversity Analysis of Jatropha Species from Costa Rica Using AFLP Markers Roberto Avendaño1, Elmer García Díaz2, Marta Valdez-Melara2, Nefertiti Chaves Solano1, Aníbal Mora Villalobos1, Francisco Aguilar Cascante1, Bruce Williamson Benavides2, Laura Y. Solís-Ramos2* 1Center for Biotechnological Innovations (CENIBiot), CeNAT-CONARE, San José, Costa Rica 2School of Biology, University of Costa Rica, San José, Costa Rica Email: *laura.solisramos@uc r.ac.cr Received 4 August 2015; accepted 25 September 2015; published 28 September 2015 Copyright © 2015 by authors and Scientific Research Publishing Inc. This work is licensed under the Creative Commons Attribution International License (CC BY). http://creativecommons.org/licenses/by/4.0/ Abstract The genetic diversity from species of the genus Jatropha collected from Costa Rica was analyzed by AFLP (amplified fragments length polymorphism). The study consisted of 114 accessions from 15 populations of 4 different species: J. curcas, J. c ostaricensis, J. gossypifolia and J. stevensii. These were collected from different locations in Costa Rica. Three different primers were used, resulting in 428 loci, and they were classified in three categories: unique and double bands (UBD), rare bands (RB) and shared bands (SB). The UBD were excluded for a total of 339 polymorphic loci used for the UPGMA dendrogram and principal component analysis (PCA). The species that ob- tained the highest average of polymorphic loci was J. curcas, which obtained the highest percen- tage of polymorphic loci (80.24%), followed by J. gossypifolia (79.35%), J. costaricensis (78.76%), and finally J. stevensii (40.71%). The average for the polymorphic loci was of 69.76%. Thus, the phylogeny of the Jatropha species in Costa Rica was elucidated, showing J. curcas more related to J. stevensii and this one with J. costaricensis, and J. gossypifolia as the most distant member of the genus. For the best of our knowledge this is the first report of a genetic analysis of J. costaricensis and J. stevensii. The obtained molecular evidence showed high levels of polymorphisms in the present study compared with reports from Africa, India, and China. The molecular diversity esti- mated in our analysis, together with agronomical or morphological data, can be very useful for plant breeding programs, given the importance of Jatropha species in oil production. Interestingly, Central American Jatropha material can be used to increase the genetic base of J. curcas popula- tions localized in Asia and Africa, where reduced genetic diversity has been reported. Keywords Jatropha spp., AFLP, Molecular Markers, Polymorphism, Genetic Diversity *Corresponding a uthor.  R. Avendaño et al. 1. Introduction The genus Jatropha is morphologically diverse with 1 60 - 175 old and new w orld woody species comprising of trees, shrubs, rhizomatous subshrubs, tuberous perennial herbs, geophytes, and facultative annuals, which are distributed chiefly in the tropical and sub-tropical regions of America, Africa and India [1]. J. costaricensis is described from Guanacaste, Costa Rica [2], J. stevensii is described from collections in Dept. Boaco in Nicara- gua [3], and J. gossypifolia L. is a major weed in Australia [4]. Jatropha stevensii represents yet another exten- sion of the Mexican xerophytic element into Central America, and the second record for Jatropha subg. curcas [3]. Easy adaptation to different kinds of marginal lands, drought endurance, avoidance by animals, and its short time interval to give first yield make th is plant species more attractive for cultivation [5]. The species can g row even in areas with extreme climate and soil conditions which could not be inhabited by most of the agricultural- ly important plant species that circumvent the food versus fuel resentment [6]. Assessment of genetic diversity using molecular markers is crucial for the efficient management and conser- vation of plant genetic resources in gene banks [7]. There are very few studies on the genetic diversity of J. curcas that involve a variety of populations and molecular marker technologies [7]-[13]. Two common features of the majority of these stud ies are the inclusion of only a narrow selection of genetic materials, typically w ithin one or a few countries [7]-[9] [12] [14], and the fact that they have generally revealed low genetic diversity within countries [10] [15]-[18]. Most of the research was focused on J. curcas originating from India, and it showed low genetic diversity [8] [9] [14] [15] [19]. Ranade et al. [15] characterized 22 accessions from six regions using RAPD and amplifica- tion of minisatellite DNA (DAMD) profiles and separated the wild and non-wild accessions; they observed a low level of variation among accessions within a g roup [15]. The analysis of the genetic diversity among 28 ac- cessions using RAPD and amplified fragment length polymorphism (AFLP) revealed low genetic diversity in J. curcas [19], and similar results have been reported by Basha and Sujatha [9] and Tatikond a et al. [8]. In another research done in India, Sudheer et al. [14 ], using microsatellite marker s, also concluded a genetic d isequilibriu m of J. cu rca s. The n arrow genetic base of J. c ur ca s in India has been attributed to the small number of introduced plants an d the ir veget a t i ve propaga t ion [7]. For Chinese samples of J. curcas, 58 accessions were assessed in a study based on simple sequence repeat (SSR) and AFLP analysis, it demonstrated low levels of variation [7]. Ther efore, the genetic diversity of J. cur- cas in China may only represent part of the Indian population [7]. In this way, it is likely that there is a greater genetic diversity in J. curcas individuals from the center of origin; however, with the exception of research using germplasm from Guatemala [20] and Mexico [10] [13] [16], rela- tively less work has appeared from its center of origin, as well as Africa and other regions of the tropics where it occurs extensively. Although genetic diversity of J. curcas in its native Central America is still unknown, it is suggested that germplasm for genetic improvement programs should be introduced from its native range rather than from other introduced populations [7]. Therefore, a collaborative global Jatropha genetic diversity evalua- tion effort is immediately needed for a better use of this valuable spe c ies in breeding pr og r a ms. The present study surveys the molecular diversity in four wild species of Jatropha from Cos ta Rica: J. costa- ricensis, J. curcas, J. gossypifolia and J. stevensii, by using amplified fragment length polymorphism analysis (AFLP). AFLP is a rich information marker system due to its ability to generate a large number of polymorphic/ informative loci simultaneously in a single lane with a single-primer combination, as compared to RAPDs, RFLPs and microsatellites [8]. With AFLP, which does not require any prior DNA sequence information, the main disadvantage of SSR markers is that they need to be isolated again from most species being examined for the first time, and the development of the s e markers is both time consuming and expensive [8]. 2. Materials and Methods 2.1. Plant Materials Samples of leaves of Jatropha spp. were collected from Diriá and Santa Rosa National Parks, off road and commercial availability, fo r a total of 114 samples (Table 1). 2.2. AFLP Analysis The genomic DNA of Jatropha sp. samples were extracted using the NucleoSpin Plant II commercial system  R. Avendaño et al. Table 1. Details of the Jatropha spp. accessions used for the AFLP analysis collected in Costa Rica. Species N. of individuals N. of populations Site J. costaricensis 7 1 Península Santa Elena, Area Conservación Guanacaste, La Cruz. Cantera La Marbolita. 4 1 Península Santa Elena, Area Conservación Guanacaste, La Cruz. 22 1 Cerro La Flor, Playas del Coco, Carrillo, Guanacaste. J. curcas 3 1 Tárcoles, Puntarenas. 16 1 Fila cenizosa, Parque Nacional Diriá, Santa Cruz, Guanacaste. 12 1 Parque Nacional Diriá, Santa Cruz, Guanacaste. J. gossypifolia 42 4 Liberia, Guanacaste. 1 Nicoya, Guanacaste. 1 La Cruz, Guanacaste. 1 Carrillo, Guanacaste. 1 Palmares, Alajuela. J. stevensii 8 1 Parque Nacional Santa Rosa, La Cruz, Guanacaste. Total 114 15 (Macherey-Nagel). AFLP plant mapping kit, with ligation and pre-selective amplification core mix modules, (Life Technologies, USA) was used for AFLP fingerprinting according to the manufacturer’s instructions. The restriction-ligation reactions were performed using genomic DNA, with EcoRI and MseI enzymes, EcoRI and MseI adaptors and T4 ligase at room temperature overnight. The restriction-ligation product was diluted 1:2. The DNA prepared by restriction-ligation was pre-amplified using EcoRI-A and MseI-C primers. The pre-am- plified product was diluted 1:20 with sterile deionized water. The diluted pre-amplification products were am- plified using selective f luorescent dye-labeled EcoRI primers with the following combination: E-AGC/M-CTA, E-ACT/M-CTA and E-AGG/M-CTA [8] [19]. Data collection of selective amplification products was carried out on a 3130xl genetic analyzer (Applied Biosystems, USA). The polymorphic loci were classified in 3 catego- ries: unique and double bands (UBD), rare bands (RB) (present in less than 10% accessions) and shared loci (SB). 2.3. Data Analysis The genetic diversity analysis (principal coordinates, AMOVA, banding pattern) were in GenAlEx with binary database of AFLP, both for species and for populations. The phylogenetic tree was made in the Infotstat soft- ware using the Jaccard index. The genetic distance matrix resulting from GenAlEx analysis was used in the SigmaPlot 12.0 software to generate 3D graphic. The GenAlEx program was used to obtain allele frequencies, heterozygosity estimated, values of “p” and “q” to calculate the statistics ( PI C, EMR, MI, RP, DI) of the p rimers. Equations were programmed in excel and were run with data. AFLP scoring was conducted using GeneMapper v4.1 with default parameter settings (Applied Biosystems, USA). Sample fingerprints were individually scored and statistically analyzed, assuming fragment size as a lo- cus, they were considered as biallelic (present = 1, absent = 0) and made the binary matrix. Phylogenetic tree according to Jaccard and band pattern analysis were constructed using the binary matrix. The genetic distance was calculated as proposed by Huff et al. [21]: (1) Equation (1), Here, = number of shared character states, n = total number of binary characters. When calculated across multiple loci for a given pair of samples, this is equivalent to the total of state differences among the two DNA profiles. The genetic distance matrix was subject of principal coordinates and AMOVA analysis using GenAlEx v6.5.1. Analysis of molecular variance (AMOVA) procedure follows the methods of Peakall and Smouse [22]:  R. Avendaño et al. (2) Equation (2), Whe re , = among-population variable , and = within-populat i on variable. Genotyping data obtained from the AFLP primer combinations was used for assessing the discriminatory power of AFLP primer combinations by evaluating three parameters [23]: 1) polymorphism information content (PIC), 2) marker index (MI), and 3) resolving po wer (RP). The PIC value for each AFLP primer combination was calculated as proposed by Roldan-Ruiz et al. [24]: (3 ) Equation (3), where PICi is the polymorphism information content of marker i, fi the frequency of the marker fragments, which were present and 1 − fi the frequency of marker fragments, which were absent. PIC was aver- aged over the fragments for each primer combination. The marker index was calculated as given in Varshney et al. [25]: (4) Equation (4), w here EMR: “The effective multiplex ratio (E) is defin ed as the product of the total number of loci/fragments per primer (n) and the fraction of polymorphic loci/fragments (β) (E = n * β).” Resolving power of each primer was calculated according to Prevost and Wilkinson [26]: (5 ) Equation (5), where represents fragment informativeness. The can be represented into a 0 - 1 scale by the following formula: (6) Equation (6), whe re p is the proportion of the 48 accessions containing the fragment. Diversity values were calculated for each locus as proposed by Russell et al. [27]: (7) Equation (7), is the phenotypic frequency for each AFLPs-primer combination. 3. Results 3.1. AFLP Profiling and Marker Polymorphism A total of 3 combinations of AFLP primers were used in the study to generate AFLP profiles over 114 acces- sions of Jatropha species collected in the province of Guanacaste, Costa Rica. In the analysis of the AFLP pro- file, only the loci with high resolution were considered. A total of 428 loci were generated and distributed ho- mogeneously within 3 primer combinations (Table 2). The polymorphic loci were classified in 3 categories: unique and double bands (UBD), rare bands (RB), and shared loci (SB) (Table 3). The first consist of loci present in one or two samples by specific primer combinations. The UBD loci were excluded and, for further analysis, a total of 339 loci (TL) were used (Table 3). By this analysis, J. curcas obtained the highest percentage of polymorphic loci (80.24%), followed by J. gossypifolia (79.35%), J. costaricensis (78.76%), and finally J. stevensii (40.71%). The average for the polymorphic loci was of 69.76%. 3.2. Discriminatory Power of AFLP Primer Combination 3.2.1. Polymorphism Information Content (PIC) The PIC value for polymorphic fragments oscillated between 0.245 and 0.269, with an average of 0.257 per primer combination. With the purpose of distinguishing different primer combinations, the PIC value for all the generated fragments by primer combination were averaged to obtain an average PIC value, corresponding to each primer combination. The highest PIC value was observed for the E-ACT/M-CTA primer combination and the lowest for the E-AGG/M-CTA primer (Table 2).  R. Avendaño et al. Table 2. Marker attributes for AFLP combinations used. Primer combinations PICa EMRb MIc RPd DIe E-ACT/M-CTA 0.269 112 30.99 26.50 0.911 E-AGG/M-CTA 0.245 110 26.96 21.81 0.943 E-AGC/M-CTA 0.256 116 29.72 23.47 0.944 Average 0.257 113 29.22 23.93 0.933 aPolymorph i sm information content (PIC); bEffective multiplex ratio (EMR); cMarker index (MI). d Resolving power (RP); eDiversity Index (DI) Table 3. Number of polymorphic bands in relation to primer combinations. TB = T otal bands. P B = Polymorphic Bands. MB = Monomorphic Ban ds. UBD = Unique a nd Double Ban ds. RB = Rare Bands < 10% from samples. SB = Shared Ba nds > 70% from samples. Primer combinations TB PB MB % Polymorphism UBD RB SB EcoRI-ACT X MseI-CTA 146 146 1 99.34 33 76 4 EcoRI-AGG X MseI-CTA 138 138 0 100 28 75 2 EcoRI-AGC X MseI-CTA 144 144 0 100 28 76 0 3.2.2. Marker Index (MI) The MI value had a range between 26.96 and 30.99 with an average of 29.22 per primer combination. The high- est MI value (30.99) was observed for the E-ACT/M-CTA primer and the lowest MI value (26.96) for the E-AGG/M-CTA primer (Table 2). 3.2.3. Resolving Power (RP) The RP is a characteristic for each primer combination that indicates the discriminatory potential of the primer combination. The RP range was 21.81 to 26.50 with an average of 23.93 per primer combination. The highest value (26.50) was shown for the E-ACT/M-CTA primer and the lowest for the E-AGG/M-CTA primer (Table 2). 3.2.4. Diversity Index (DI) The diversity index value for 339 polymorphic loci ranged between 0.911 and 0.944 with an average of 0.933 per AFLPs-primer combinations. Highest value (0.944) was scored with the primer pair for E-AGG/M-CTA and the lowest value (0.911) for the primer pair E-ACT/M-CTA (Table 2). 3.3. Genetic Relationships of Jatropha Populations The results of the principal component analysis (PC) showed that samples grouped by species in four groups (Figure 1). By doing the same analysis by species, the distribution was confirmed and the variation increased, explained by 100% (Figure 2) . The cluster analysis shows that the species J. cur cas and J. stevensii are gen eti- cally close, and at the same time, these were close with J. costaricensis. Consequently, J. gossypifolia is the far- thest compared to the others (Figure 3). Analyzing the total band patterns by species, J. curcas presented the highest band quantity (273), followed by J. gossypifolia (271), then J. costaricensis (268), and finally J. stevensii (145). From the 281 bands of J. costa- ricensis, 242 have a frequency equal or higher than 5%, resulting in the species with the highest quantity. Fur- thermore, J. curc as with 238 bands, then J. gossypifolia with 214 bands, and J. stevensii with 145 bands. J. cos- taricensis was the species with the highest quantity of private bands (24), then J. gossypifolia (13 bands), J. curcas (5 bands), and J. ste vensii (none) (data not showed). In relation with the average of the expected hetero- zygosity, J. curcas obtained the highest value (0.177), then J. costaricensis (0.161), J. gossypifolia (0.160), and finally J. stevensii (0.124) (Figure 4). The AMOVA analysis of the different species of Jatropha showed that genetic differences exist both between and within species (n = 114, PhiPT = 0.471, P < 0.01) (Figure 5). Sub- sequently, an analysis for genetic difference was performed for the J. costaricensis and J. curcas species. For J. costaricensis , I and II populations showed no genetic difference between them (n = 11, PhiPT = 0.01, valor P = 0.40), but toge ther t hey prese nted di ffere nces with popul at ion III (n = 33, Phi PT = 0.47, value P < 0.01) (Figure 6). 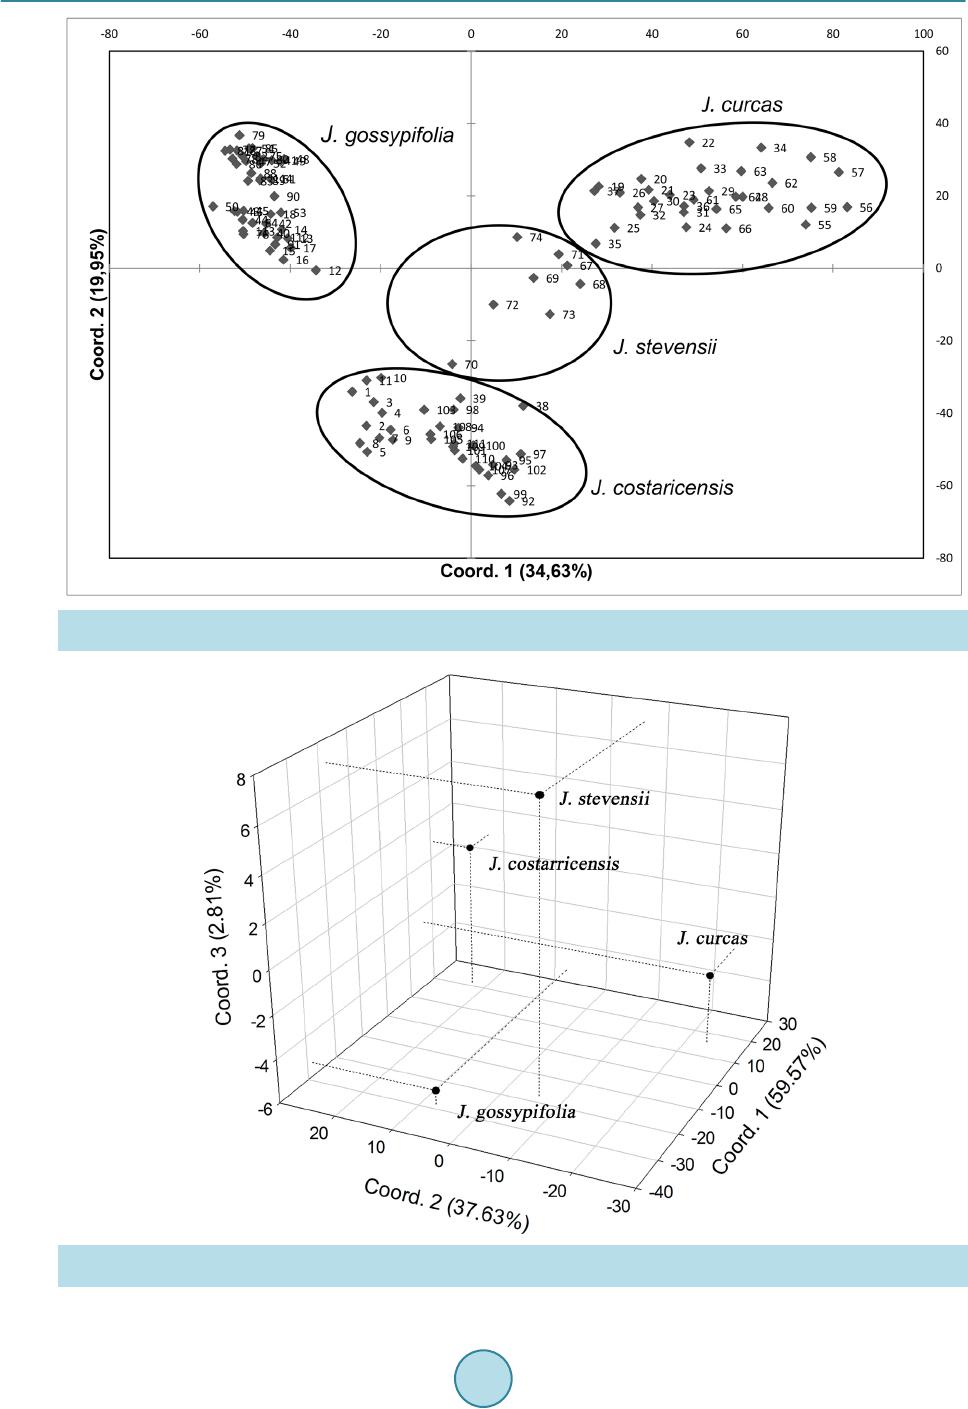 R. Avendaño et al. Figure 1. Genetic relations of 4 species of Jatropha base d on the principal component analysis (PCA). Percentage of varia- tion explained by the 2 axis: 53.82%. Figure 2. Principal coordinates per species. J. curc as n = 31, J. costarricenses n = 33, J. gossypifolia n = 42, J. stevensii n = 8. Percentage of variation explained by the 3 axis = 100%.  R. Avendaño et al. Figure 3. Phylogenetic tree for 4 species of Jatropha based in Jaccard coefficient similarity. cophenetic correlation = 99. J. curcas n = 31, J. costarricens es n = 33, J. gossypifolia n = 42, J. stevensii n = 8. Figure 4. Banding pattern between species of Jatropha. Figure 5. Percentage of molecular variation between and within J. curcas, J. gossypifolia, J. costaricen- sis and J. ste vensii. Pops: populations.  R. Avendaño et al. Figure 6. Principal coordinates between the different populations of J. costaricensis. Percentage of variation explained by the 2 axis = 63.69%. I = Península Santa Elena, Area Conservación Guanacaste, La Cruz, Guanacaste. Cantera La Marbolita. II = Penísula Santa Elena, Àrea de Conservación Guancaste, La Cruz, Guanacaste. Nearness of river Potrero Grande. Sam- ples marked with an asterisk. III = Cerro La Flor, Playas del Coco, Carrillo, Guanacaste. Unlike J. costaricensis , the 3 populations of J curcas are genetically different from each other (n = 31, PhiPT = 0.39, P < 0.01). Populations I and III had the greatest genetic difference in the study (n = 15 PhiPT = 0.54, P < 0.01). Although the populations II and III overlap in a region according to the principal coordinate analysis (Figu re 7 ), th ese po pulatio n s were g eneticall y d if feren t (n = 28, PhiPT = 0.38, P value < 0.01). Similarly for the populations I and II, although th e ir genetic difference is lower (n = 19, PhiPT = 0.24, P < 0.01). 4. Discussion 4.1. AFLP Profiling and Marker Polymorphism It has been shown that the amplified fragment length polymorphism analysis (AFLP) is an efficient method for the molecular characterization and phylogenetic relation studies among the Jatropha species [14] [17] [19]. In this study, the level of polymorphism based on AFLP with 3 primer combinations was high and sufficient to dis- tinguish the four species of Jatropha (J. costaricensis, J. curcas, J. gossypifolia and J. stevensii) collected in Costa Rica. This result agrees with other studies where AFLP technique allowed to estimate the genetic rela- tionships of germplasm (J. curcas) and to detect a high level of polymorphism [13]. Unique, rare, shared, and double fragments detected by the 3 primer combination were identified. The primer combination named E-ACT/M-CTA was found to be more effective to detect a higher number of unique fragments and a good number of rare fragments. Therefore, these primer combinations are useful for the detection of informative fragments in the Jatropha germplasm. The availability of rare fragments present in different accessions, together with the genetic dissimilarity data, may be useful for the improvement of species through conventional methods as molecular improvement trials, like marker assisted selection (MAS) and the occurrence of shared fragments in accession. It is very useful to understand the relations and similarities between accessions [8]. 4.2. Discriminatory Power of AFLP Primer Combination A number of markers attributes like PIC, MI and RP have been used in different studies to evaluate the informa-  R. Avendaño et al. Figure 7. Principal coordinates between the different populations of J. curcas. Percentage of variation explained by the two axis = 58.78%. I = non toxic commercial variety. II = Fila cenizosa, Parque Nacional Diriá, Santa Cruz, Guanacaste. III = Parque Nacional Diriá, Santa Cruz, Guanacaste. tive or discriminatory po wer in the pr imer combination in gen etic d ivers ity stud ies [8 ]. In this s tudy, the 3 AFLP primer combinations showed an average PIC of 0.257. The maximum PIC value for bi-allelic markers as AFLP can be expected of 0.264. Based on the PIC value, the E-ACT/M-CTA primer combination is the recommended for the analysis of Ja tropha germplasm in our study. The MI parameter confirmed in our study that the E-ACT/M-CTA combination is recommended to use it in the analysis of germplasm, which showed a value of 30.99. In this study, an MI value was obtained in the range of 26.96 - 30 (29.22 average) and a PIC value in the range of 0. 245 - 0.269 (0.257 average), which are comparable to other studies. The primer combination used in our study showed RP values be t we e n 21.81 - 26.50 (23.93 average). 4.3. Genetic Relationships of Jatropha Pop ulations Also, it is important to optimize the design of the genetic improvement program to select genotypes and develop new populations [27]. In plant species, the genetic diversity tends to be higher near the geographical origin, which has been demonstrated in studies of J. curcas showing high genetic diversity in samples collected in Mexico (Veracruz, Puebla, Chiapas, Quintana Roo) [13] [16] [28]-[30]. This supports the hypothesis, based on morphological data and the natural distribution, indicating the Mesoamerican region (Mexico and Central America) as the possible center of origin of J. curcas [28]-[31]; although th e average of the genetic diver sity is limited, compared to the reported by other taxa from other endemic species. Apart from J. curcas, the genetic diversity from other species of the genus considered native from Central America is still unknown. Therefore our research is pioneer in the study of the genetic diversity of 4 species of the genus Jatropha in the natural distribution area (Central America), and mainly of J. costaricensis. For the best of our knowledge this is the first report of a genetic analysis of J. costaricensis and J. stevensii. In the 114 accessions analyzed, high levels of polymorphisms were obtained compared with the reported from studies with materials from Africa, India and, China [13] [14] [17] [30] [32]. This pronounced genetic diversity indicates higher probabilities to improve the species by interspecific crossing, which has been successfully documented  R. Avendaño et al. previously (J. curcas × J. integerrima) [11] [19] [33]. The interspecific hybridization reveals the possibility of obtaini ng hybrids of J. curcas with other species of Jatropha [11]. Both PCA and UPGMA dendrogram divided the IV population in principal groups, coinciding by species. The dendogram shows high genetic similarity (Jaccard’s similarity coefficient) between J. curcas and J. steven- sii, and these two with J. costa r ic ensis, and farthest with J. gossyp ifolia. This suggests that J. curcas with J. ste- vensii and J. costaricensis could have a common ancestor and more distant J. gossypifolia. This is consistent with the reports that point J. curcas, J. integerrima, J. glandulifera, and J . gossypifolia as native from America, and that they have been introduced to tropical countries in Africa and South East Asia (Indian, Indonesia, Ma- laysia and China) [30] [31] [34] [35]. However, our results differ from those found by Popluechai et al. [32 ], which report J. gossypifolia and J. in- tegérrima closer to J. curcas. Also the same AFLP phylogram obtained by Sudheer et al. [19] showed a major cluster conformed by 5 species of Jatropha (J. curcas, J. glandulifera, J. gossypifolia, J. integerrima, and J. tanjorensis) and a minor cluster with J. multifida and J. podagrica, distributed in India. Basha and Sujatha [11], by combined data of RAPD and ISSR markers, grouped J. curcas with J. gossypifolia determining them as close relatives and as natural hybrid J. tanjorensis. In another study using RAPD markers, all accessions of J. curcas were grouped in one group; a second group was formed of 6 species: J. ramanadensis, J. gossypiifolia, J. podagrica, J. tanjorensis J. villosa and J. in- tegérrima, and finally a separate group of J. glandulifera [36]. J. curcas is considered the ancestral primitive species due to its morphological distinctive characteristics, where other species evolved from J. curcas and an- cestral forms [37]. In our study, the principal component analysis (PCA) with only the accessions from J. curcas showed the formation of III principal groups, suggesting a broad genetic base from the germplasm. This germplasm base shows genotypes that could have few and probably unique genetic changes. This agrees with Pecina-Quintero et al. [13], where several accessions of J. curcas collected in three agro-climate regions of Chiapas, Mexico, showed high diversity. This shows nonrandom mating between groups and/or regions of accessions of J. curcas, which makes the selection of representative co llections difficult. According to Pecina-Quintero et al. [13], these changes can be the result of the evolution of J. curcas to different environments or adaptation to different habi- tats, contrary to the study by He et al. [16], where AFLP analysis r eported low genetic diversity from materials from Madagascar, Tanzania, and Surinam. Also, from four combinations of fluorescent primers, the genetic variation was characterized by 63 populations of J. curc as from 10 countries in Asia, Africa, and Mexico result- ing in low genetic diversity between populations [17]. Nevertheless, the analyzed Mexican populations showed high values of genetic variation [16] [17]. In general, it has been demonstrating low genetic variation between accessions of J. cu rc as in Africa and Asia, and the reasons are no t clearly defined [32 ]. However, Subramanyam et al. [24] reported high genetic diversity of J. curcas collected in 10 different eco-climate regions in India but by using RAPD markers. The variation of the genetic diversity within species is commonly related with the geographic range, reproduction mode, mating system, seed dispersal, and fertility [38]. Taking into account the local and global results [13] [16] [17] [32], we suggest that the high genetic variation detected between and within the populations of Jatropha curcas could be explained because of America being considered the range for the natural distribution of the species [31]. Th e introduction of this germplasm could be used to broaden the genetic base of Jatropha in countries like Africa and Asia (mainly in China and India), where the genetic diversity has been reported as low (35% - 50%), partly attributed to reduced genetic flow be- tween populations, favored by the limited seed dispersal which occurs by gravity and anthropogenic dispersal (clonal reproduction) [10] [17] [32] [39]. It is agreed by several authors to use the germplasm from the range of natural distribution (Central America and Mexico) in genetic breeding programs for the species (mainly J. cur- cas) to broaden the genetic base [10] [17] [18] [32] [39], instead of germplasm from the same origins or intro- ductions [7]. Knowledge of the genetic diversity of wild species Jatropha from Costa Rica will be useful for breeding programs and for the development of improved varieties. Understanding the genetic diversity, in- ter-relatedness, and d ifferentiatio n of wild and introduced subpopulations of the species is a critical step towards selection and breeding of superior genotypes [17]. Conduct studies to determine whether the differentiation between populations of J. costarricensis is due to stochastic factors such as relief or wind direction, or if the distance between populations prevents pollen reach the nearest population, or flowering patterns differ between populations, or if there is an anthropomorphic factor, or the poll inators can’t reac h ne ighboring popula t ions.  R. Avendaño et al. The number of samples obtained was due to factors such as difficult access to collection sites, the fact that the species is deciduous and scarcity of individuals in some species. It was not possible to analyze microsatellites because the genome of some of the species under study is unknown. 5. Conclusion The AFLP primer combination AFLP E-ACT/M-CTA can be used in an efficient way for the differentiation of the four species, as it resulted in the highest number of polymorphic markers, which were specific for the spe- cies and population s of J. c u rc a s and J. costaricensis. The identification of private bands per species can be used for screening samples of Jatropha spp. from unknown origin when comparing the unknown sample with the panel of private bands. The genetic analysis that elucidates the phylogeny of the Jatropha ssp. species states that J. curcas is more related to J. stevensii, those two with J. costar icensis, and J. gossypifolia as the farthest mem- ber of the genus. The populations of J. curcas are different between them. The identification collection and the maintenance of such genetically diverse wild germplasm from Costa Rica are of great importance in economic improvement of this species and for the selection of promising lines. Also the populations with very little or no human intervention may contribute more substantially towards the germplasm heterogeneity of Jatropha costa- ricensis for traits such as adaptability and oil yield. Acknowledgements This work was supported by the Vicerrectoría de Investigación of the University of Costa Rica and the National Center for Biotechnological Innovations—CENIBiot, through the p roject No. 111-B2-503 and CB-D1-2010 re- spectively. To Mario Fernández, Kimberly Valverde, Alexis Briceño, Jorge Gómez Laurito+, Rafael Acuña, Joaquín Ruiz and Marcela Peña for their cooperation with the co llecting of materials. Max Chavarría, Che mistry School, Universidad de Costa Rica and Research Center for Natural Products (CIPRONA), for the comments on the manuscript. References [1] Dehgan B. (1984) Phylogenetic Significance of Interspecific Hybridization in Jatropha (Euphorbiaceae). Systematic Botany, 9, 467-478. http://dx.doi.org/10.2307/2418796 [2] Webster, G.L. and Poveda, L.J. (1978) A Phytogeographically Significant New Species of Jatropha (Euphorbiaceae) from Costa Rica. Brittonia, 30, 265-270. http://dx.doi.org/10.2307/2806661 [3] Webster, G.L. (1987) A New Species of Jatropha Euphorbiaceae from Nicaragua. Annals of the Missouri Botanical Garden, 74, 117-120. http://dx.doi.org/10.2307/2399266 [4] Taofeeq, O., Ganiyu, O.A., Tesleem, A.O., Godwin, O.A. and Mutiyat, A.O. (2005) Mechanism of Action of Jatropha gossypifolia Stem Latex as a Haemostatic Agent. European Journal of General Medicine, 2, 140-143. [5] Islam, A., Yaakob, Z. and Anuar, N. (2011) Review Jatropha: A Multipurpose Plant with Considerable Potential for the Tropics. Scientific Research and Essays, 6, 2597-2605. [6] Kumar, A. and Sharma, S. (2008) An Evaluation of Multipurpose Oil Seed Crop for Industrial Uses: A Review. Indus- trial Crops and Products, 28, 1-10. http://dx.doi.org/10.1016/j.indcrop.2008.01.001 [7] Sun, Q.B., L i, L.F., Li, Y., Wu, G.J. and Ge, X.J. (2008) SSR and AFLP Markers Reveal Low Genetic Diversity in the Biofuel Plant Jatropha curcas in China. Crop Science, 48, 1865-1871. http://dx.doi.org/10.2135/cropsci2008.02.0074 [8] Tatikonda, L., Wani, S.P., Kannan, S., Beerelli, N., Sreedevi, T.K., Hoisington, D.A., Devi, P. and Varshney, R.K. (2009) AFLP-Based Molecular Characterization of an Elite Germoplasm Collection of Jatropha curcas L., a Biofuel Plant. Plant Science, 176, 505-513. http://dx.doi.org/10.1016/j.plantsci.2009.01.006 [9] Basha, S.D. and Sujatha, M. (2007) Inter and Intra-Population Variability of Jatropha curcas (L.) Characterized by RAPD and ISSR Markers and Development of Population-Specific SCAR Markers. Euphytica, 156, 375-386. [10] Basha, S.D., Francis, G., Makkar, H.P.S., Becker, K. and Sujatha, M. (2009) A Comparative Study of Biochemical Traits and Molecular Markers for Assessment of Genetic Relationships between Jatropha curcas L. Germplasm from Different Countries. Plant Science, 176, 812-823. http://dx.doi.org/10.1016/j.plantsci.2009.03.008 [11] Basha, S.D. and Sujatha, M. (2009) Genetic Analysis of Jatropha Species and Interspecific Hybrids of Jatropha curcas Using Nuclear and Organelle Specific Markers. Euphytica, 168, 197-214. http://dx.doi.org/10.1007/s10681-009-9900-0 [12] Shen, J.L., Jia, X.N., Ni, H.Q., Sun, P.G., Niu, S.H. and Chen, X.Y. (2010) AFLP Analysis of Genetic Diversity of Ja- tropha curcas Grown in Hainan, China. Trees, 24, 455-462. http://dx.doi.org/10.1007/s00468-010-0413-1  R. Avendaño et al. [13] Pecina-Quintero, V., Anaya-López, J.L., Zaparripa, A., Montes, N., Núnez, A., Solís, J.L., Aguilar-Rangel, M.R., Gill, H.R. and Méjia, D.J. (2011) Molecular Characterization of Jatropha curcas L. Genetic Resources from Chiapas, México through AFLP Markers. Biomass and Bioenergy, 35, 1897-1905. http://dx.doi.org/10.1016/j.biombioe.2011.01.027 [14] Sudheer, P.D.V.N., Radhakrihnan, H., Mastan, S.G. and Reddy, M.P. (2010) Isolation of Novel Microsatellites Using FIASCO by Dual Probe Enrichment from Jatropha curcas L. and Study on Genetic Equilibrium and Diversity of In- dian Population Revealed by Isolated Microsatellites. Molecular Biology Reports, 37, 3785-3793. http://dx.doi.org/10.1007/s11033-010-0033-2 [15] Ranade, S.A., Srivastava, A.P., Rana, T.S., Srivastava, J. and Tuli, R. (2008) Easy Assessment of Diversity in Jatropha curcas L. Plants Using Two Single-Primer Amplification Reaction (SPAR) Methods. Biomass and Bioenergy, 32, 533 - 540. http://dx.doi.org/10.1016/j.biombioe.2007.11.006 [16] He, W., King, A.J., Khan, M.A., Cuevas, J.A., Ramianramanana, D. and Graham, I.A. (2011) Analysis of See d Phor- bol-Ester and Curcin Content Together with Genetic Diversity in Multiple Provenances of Jatropha curcas L. from Madagascar and Mexico. Plant Physiology and Biochemistry, 49, 1183-1190. http://dx.doi.org/10.1016/j.plaphy.2011.07.006 [17] Shen, J., Pinyopusarerk, K., Bush, D. and Chen, X. (2012) AFLP-Based Molecular Characterization of 63 Populations of Jatropha curcas L. Grown in Provenance Trials in China and Vietnam. Biomass and Bioenergy, 37, 265-274. http://dx.doi.org/10.1016/j.biombioe.2011.12.003 [18] Warrier, R.R., Devika, N.B., Savitha, C., Anandalakshmi, R., Nicodemus, A. and Singh, G.B. (2012) Assessment of Macrogeographical Genetic Variations in Jatropha curcas L in India Using Allozyme and RAPD Markers. Tropical Agricultural Research & Extension, 15, 24-31. http://dx.doi.org/10.4038/tare.v15i1.5239 [19] Sudheer, P.D.V.N., Nirali, P., Reddy, M.P. and Radhakrishnan, T. (2009) Comparative Study of Interspecific Genetic Divergence and Phylogenic Analysis of Genus Jatropha by RAPD and AFLP. Molecular Biology Reports, 36, 901-990. http://dx.doi.org/10.1007/s11033-008-9261-0 [20] Azurdia, C., Asturias, R., Barrillas, E. and Montes, L. (2005) Caracterización molecular de las variedades de Jatropha curcas L. en Guatemala con fines de mejoramiento. Guatemala, Guatemala: Informe Final Proyecto AGROCYT 012-2005: CONCYT, MAGA, OC T AGON, S.A. & AGEXPORT, p. 46. [21] Huff, D.R., Peakall, R. and Smouse, P.E. (1993) RAPD Variation within and among Natural-Populations of Outcross- ing Buffalograss (Buchloe dactyloides (Nutt) Engelm.). Theoretical and Applied Genetics, 86, 927-934. http://dx.doi.org/10.1007/BF00211043 [22] Peakall, R. and Smouse, P.E. (2006) GenAlEx 6: Genetic Analysis in Excel. Population Genetic Software for Teaching and Research. Molecular Ecology Notes, 6, 288-295. http://dx.doi.org/10.1111/j.1471-8286.2005.01155.x [23] Laurentin, H. and Karlovsky, P. (2007) AFLP Fingerprinting of Sesame (Sesamum indicum L.) Cultivars: Identifica- tion, Genetic Relationship and Comparison of AFLP Informativeness Parameters. Genetic Resources and Crop Evolu- tion, 54, 1437-1446. http://dx.doi.org/10.1007/s10722-006-9128-y [24] Roldan-Ruiz, I., Dendauw, J., VanBockstaele, E., Depicker, A. and De Loose, M. (2000) AFLP Markers Reveal High Polymorphic Rates in Ryegrasses (Lolium spp.). Molecular Breeding, 6, 125-134. http://dx.doi.org/10.1023/A:1009680614564 [25] Varshney, R.K., Thiel, T., Sretenovic-Rajicic, T., Baum, M., Valkoun, J., Guo, P., Grando, S., Ceccarelli, S. and Gran- er, A. (2008) Identification and Validation of a Core Set of Informative Genic SSR and SNP Markers for Assaying Functional Diversity in Barley. Molecular Breeding, 22, 1-13. http://dx.doi.org/10.1007/s11032-007-9151-5 [26] Prevost, A. and Wilkinson, M.J. (1999) A New System of Comparing PCR Primers Applied to ISSR Fingerprinting of Potato Cultivars. Theoretical and Applied Genetics, 98, 107-112. http://dx.doi.org/10.1007/s001220051046 [27] Russell, J.R., Fuller, J.D., Macaulay, M., Hatz, B.G., Jahoor, A., Powell, W. and Waugh, R. (1997) Direct Comparison of the Levels of Genetic Variation among Barley Accessions Detected by RFLPs, AFLPs, SSRs and RAPDs. Theoret- ical and Applied Genetics, 95, 714-722. http://dx.doi.org/10.1007/s001220050617 [28] Ovando-Medina, I., Espinosa-García, F.J., Núnez-Farfán, J. and Salvador-Figueroa, M. (2011) Genetic Variation in Mexican Jatropha curcas L. Estimated with Seed O il Fatty Ac ids. Journal of Oleo Science, 60, 301-311. http://dx.doi.org/10.5650/jos.60.301 [29] Ovando-Medina, I., Adriano-Anaya, L., Vázquez-Ovando, A., Ruiz-González, S., Rincón-Rabanales, M. and Salvador- Figueroa, M. (2013) Chapter 12: Genetic Diversity of Jatropha curcas in Southern Mexico. In: Bahadur, B., Sujatha, M. and Carels, N., Eds., Jatropha, Challenges for a New Energy Crop: Genetic Improvement and Biotechnology, Springer Science + Business Media, New York, 219. http://dx.doi.org/10.1007/978-1-4614-4915-7_12 [30] Sudheer, P.D.V.N. and Reddy, M.P. (2014) Phylogeography and Molecular Diversity Analysis of Jatropha curcas L. and the Dispersal Route Revealed by RAPD, AFLP and nrDNA-ITS Analysis. Molecular Biology Reports, 41, 3225- 3234. http://dx.doi.org/10.1007/s11033-014-3185-7  R. Avendaño et al. [31] Heller, J. (1996) Phy sic Nut Jatropha curcas L. Promoting the Conservation and Use of Underutilized and Neglected Crops. Institute of Plant Genetics and Crop Plant Research, Gatersleben; International Plant Genetic Resources Insti- tute, Rome. [32] Popluechai, S., Breviario, D., Mulpuri, S., Makkar, H.P.S., Raorane, M., Reddy, A.R., Palchetti, E., Gatehouse, A.M.R., Syers, J.K., O’Donnell, A.G. and Kohli, A. (2009) Narrow Genetic and Apparent Phenetic Diversity in Jatropha cur- cas: Initial Success with Generating Low Phorbol Ester Interspecific Hybrids. http://hdl.handle.net/10101/npre.2009.2782.1 [33] Sujatha, M. and Prabakaran, A.J. (2003) New Ornamental Jatropha Hybrids through Interspecific Hybridization. Ge- netic Resources and Crop Evolution, 50, 75-82. http://dx.doi.org/10.1023/A:1022961028064 [34] Prabakaran, A.J. and Sujatha, M. (1999) Jatropha tanjorensis Ellis & Saroja, a Natural Interspecific Hybrid Occurring in Tamil Nadu, India. Genetic Resources and Crop Evolution, 46, 213-218. http://dx.doi.org/10.1023/A:1008635821757 [35] Félix-Silva, J., Brandt, R., Arnóbio, A., da Silva Jr., A., Zucolotto, S.M. and Fernández-Pedrosa, F. (2014) Jatropha gossypiifolia L. (Euphorbiaceae): A Review of Traditional Uses, Phytochemistry, Pharmacology, and Toxicology of This Medicinal Plant. Evidence-Based Complementary and Alternative Medicine, 2014, Article ID: 369204. [36] Ganesh, S., Parthiban, K.T., Kumar, R.S., Thiruvengadam, V. and Paramathma, M. (2008) Genetic Diversity among Jatropha Species as Revealed by RAPD Markers. Genetic Resources and Crop Evolution, 55, 803-809. http://dx.doi.org/10.1007/s10722-007-9285-7 [37] Dehgan, B. and Webster, G.L. (1979) Morphology and Intrageneric Relationships of the Genus Jatropha (Euphorbia- ceae). University of California Publications in Botany, 74, 1-73. [38] Subramanyam, K., Muralidhara, M.R., Devanna, N., Aravinda, A. and Pandurangadu, V. (2010) Eva luatio n of Genetic Diversity among Jatropha curcas (L.) by RAPD Analy sis. Indian Journal of Biotechnology, 9, 283-288. [39] Sudhakar, T., Eswaran, N. and Sujatha, M. (2011) Molecular Approaches to Improvement of Jatropha curcas Linn. as a Sustainable Energy Crop. Plant Cell Reports, 30, 1573-1591. http://dx.doi.org/10.1007/s00299-011-1083-1
|