 OpenJournalofMedicalImaging,2015,5,117‐132 PublishedOnlineSeptember2015inSciRes.http://www.scirp.org/journal/ojmi http://dx.doi.org/10.4236/ojmi.2015.53016 Howtocitethispaper:Lee,Y.C.,Fullerton,G.D.andGoins,B.A.(2015)ComparisonofMultimodalityImage‐BasedVolumes inPreclinicalTumorModelsUsingIn‐AirMicro‐CTImageVolumeasReferenceTumorVolume.OpenJournalofMedical Imaging,5,117‐132.http://dx.doi.org/10.4236/ojmi.2015.53016 ComparisonofMultimodalityImage‐Based VolumesinPreclinicalTumorModelsUsing In‐AirMicro‐CTImageVolumeasReference TumorVolume YongsookC.Lee1*,GaryD.Fullerton2,BethA.Goins2 1DepartmentofRadiationOncology,UniversityofKansasMedicalCenter,KansasCity,Kansas,USA 2DepartmentofRadiology,UniversityofTexasHealthScienceCenteratSanAntonio,SanAntonio, Texas,USA Email:*dr.cecilialee@hotmail.com Received25July2015;accepted5September2015;published8September2015 Copyright©2015byauthorsandScientificResearchPublishingInc. ThisworkislicensedundertheCreativeCommonsAttributionIntern ationalLicense(CCBY). http://creativecommons.org/licenses/by/4.0/ Abstract Purpose:Changesintumorvolumeareusedfortherapyresponsemonitoringinpreclinicalstud‐ ies.Unlikepriorstudies,thisarticleintroducesin‐airmicro‐computedtomography(micro‐CT) imagevolumeasreferencetumorvolumeinrodenttumormodels.Tumorvolumesdetermined usingimagingmodaliti es suchasmagneticresonance imaging(MRI),micro‐CTandultrasound (US),andwithanexternalcaliperarecomparedwiththereference tumorvolume.Materialsand Methods:InvivoMR,USandmicro‐CTimagingwasperformed4,6,9,11and13daysaftertumor cellinoculationintonuderats.Onthedayoftheimagingstudy,invivocalipermeasurementswere alsomade.Afterinvivoimaging,tumorswereexcisedfollowedbyin‐airmicro‐CTimagingandex vivocalipermeasurementsofexcisedtumors.Thein‐airmicro‐CTimagevolumeofexcisedtumors wasdetermine dasreferencetumorvolume.ThentumorvolumeswerecalculatedusingformulaV =(π/6)×a×b×c,wherea,bandcaremaximumdiametersinthreeperpendi culardimensions determinedbythethreeimagemodalitiesandcaliper,andcomparedwithreferencetumorvol‐ umebylinearregressionanalysisaswellasBland‐Altmanplots.Results:Thecorrelationcoeffi‐ cients(R2)oftheregressionlinesforinvivotumorvolumesmeasuredbythethreeimagingmo‐ dalitieswere0.9939,0.9669and0.9806forMRI,USandmicro‐CTrespectively.Forcalipermeas‐ urements,thecoefficientswere0.9274and0.9819forcaliperinvivoandcaliperexvivorespectively.In Bland‐Altmanplots,theaverageoftumorvolumedifferencefromreferencetumorvolume(bias) wassignificantforcaliperandmicro‐CT,butnotforMRIandUS.Conclusion:Usingthein‐airmi‐ cro‐CTimagevolumeasreferencetumorvolume,tumorvolumemeasuredbyMRIwasthemost accurateamongthethreeimagingmodalities.Invivocalipervolumemeasurementsshowedunre‐ liabilitywhileexvivocalipermeasurementsreducederrors. *Corresponding author.  Y.C.Leeetal. 118 Keywords In‐AirMicro‐CT,MagneticResonanceImag ing,Ultrasound,Caliper,Tum orVolumeMeasurements 1.Introduction The treatment efficacy of anti-tumor drugs is often assessed by measurements of tumor size change, as tumor size is thought to correlate with the remaining number of viable tumor cells in a tumor mass [1]. Radiologic as- sessment of tumor size has been extensively performed using one-dimensional measurement (RECIST) or area calculated from two linear dimensions (WHO criteria), which are the only United States food and drug admini- stration (US FDA) approved imaging biomarkers [2] [3]. Yet, one- or two-dimensional measurements often ma- thematically misrepresent the change in tumor size by disregarding the second and/or third dimensions and lead to biased measurement results [4]. For more accurate assessment of tumor burden, volume can be calculated from two or three linear dimensions using a variety of equations [5] or other volumetric techniques [4] [6] [7]. Recently, a National Institutes of Health (NIH) study introduced combined density and volume assessment crite- ria to accurately reflect tumor burden and to predict cancer survival by using automated density and volume ap- plication (ADaVA) [8]. Unlike in the clinic, most preclinical anti-tumor drug studies use the caliper technique for in vivo volume measurement of subcutaneous tumors since this technique is convenient, cost-effective and non-invasive [9] [10]. However, the technique readily overestimates tumor size due to skin thickness, hair, edema and obesity [7] [11]- [13]. Inconsistent measurements by insufficiently trained personnel can also cause variable errors. In addition, available tumor volume equations do not necessarily represent actual tumor shape. Moreover, deeply located tumors cannot be measured using this technique. Thus, it has been proposed that the weight of an excised tumor is the most consistent and reproducible reflection of its volume (correlation coefficient ≈ 1.0000) [1] [7] [10]. Yet, determination of a more accurate tumor volume from the weight would require the accurate density infor- mation of a particular tumor type even though the density doesn’t vary greatly between one tumor type and an- other [7] [10]. Recently, Fullerton et al. confirmed the high accuracy of in-air micro-computed tomography (micro-CT) im- age (i.e. micro-CT image of a sample surrounded by air) volume by a voxel counting method using National In- stitute of Standards and Technology (NIST) traceable cylindrical phantoms [14]. Micro-CT resolution is typi- cally at the micron level [15]. When an excised tumor is placed in a high contrast radiographic background such as air, the tumor size on the order of ten microns can be readily measured. This high contrast between tumor and air allows for accurate voxel counting for calculation of tumor volume in the micro-CT images [14]. In addition, in comparison to magnetic resonance imaging (MRI), micro-CT is more cost-effective [16] and allows for much faster scan time, which can prevent dehydration of excised tumors. Foster and Ford used a similar technique— algorithm based volume calculation of excised tumors submerged in ethyl alcohol by using the contrast between tumors and ethyl alcohol—to avoid inconsistency of contouring tumors [17] and their study supports Fullerton et al.’s methodology. Other researchers have used micro-CT to determine image volume of tumors after processing for histology [16]-[18]. However, histologic processing is known to decrease the linear dimensions of tissue by 10% - 15% and volume by 27% - 38% [18]-[20]. Imaging modalities such as ultrasound (US), micro-CT, MRI or micro-Positron Emission Tomography (mi- cro-PET) have been often utilized to monitor chemotherapeutic response to cancer treatment in preclinical tumor models [7] [10] [21]-[24]. Jensen et al. compared tumor volume by micro-CT with micro-PET and caliper, and showed that micro-CT was more accurate than micro-PET or caliper [7]. These results match Ishimori et al.’s findings on sequential CT scanning versus caliper measurements [12]. Ayers et al. reported that US imaging was better than caliper for tumor volume measurement [10]. Validation studies by Martiniova et al. demonstrated that the accuracy of T2-weighted MRI volume measurements was within about 8% [22]. In the present study, unlike the prior studies, in-air micro-CT image volume of excised tumors was calculated as reference tumor vo- lume using the methodology previously shown by Fullerton et al. [14]. Using the reference tumor volume, then image-based volumes were quantified and compared among three commonly used imaging modalities (US, mi- cro-CT and MRI) in rodent tumor models. In addition, we used the same data set to compare tumor volume de- 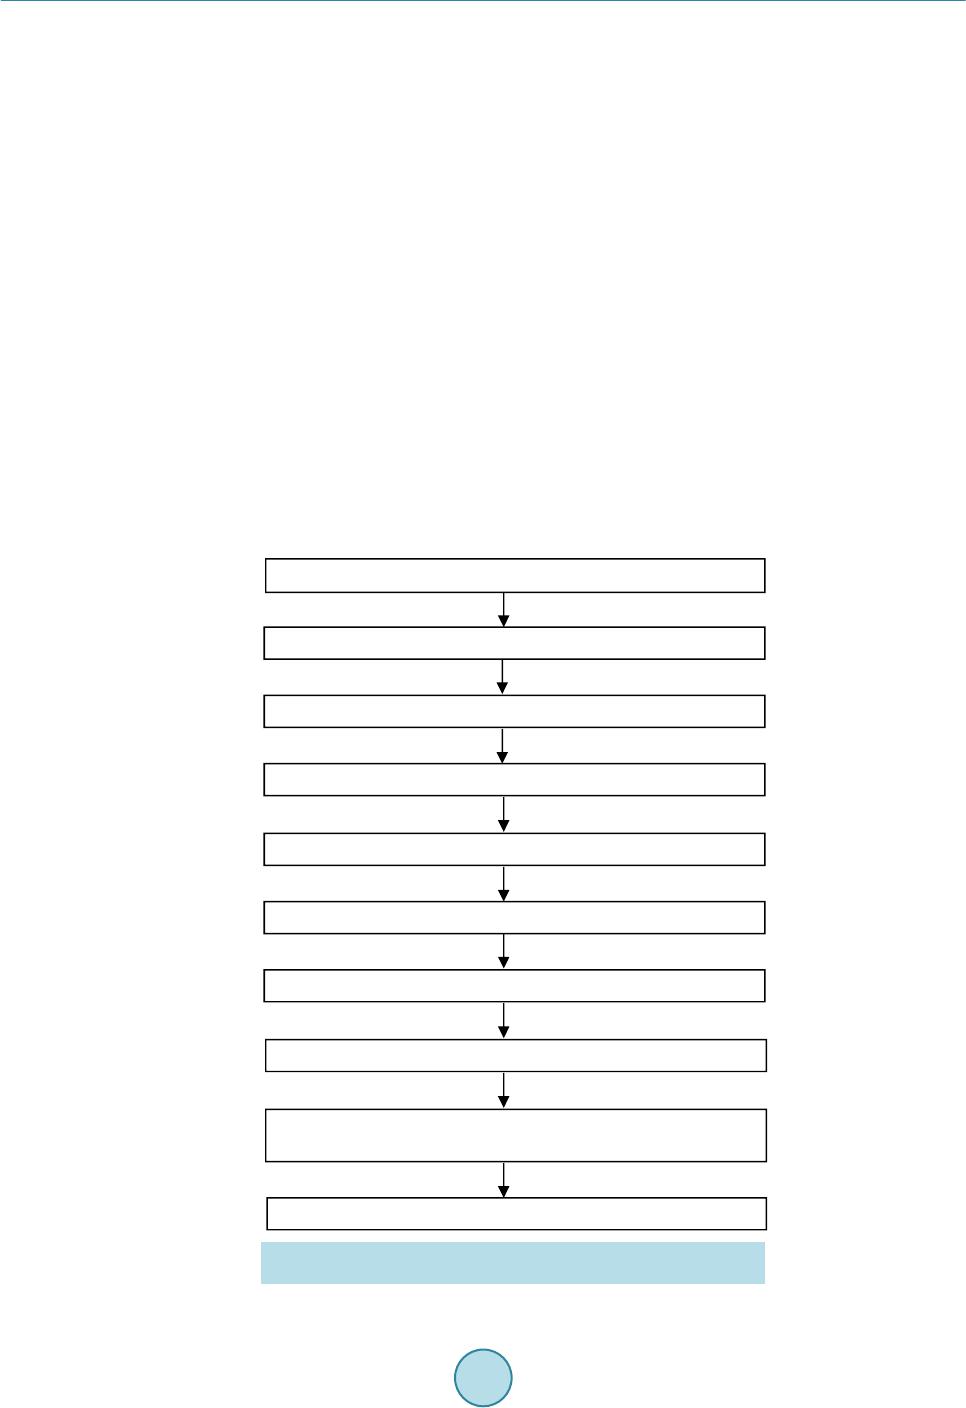 Y.C.Leeetal. 119 termined by the caliper method with the reference tumor volume. 2.MaterialsandMethods 2.1.TumorCellInoculation The animal studies were conducted in accordance with federal guidelines and approved by our institutional ani- mal care and use committee. For all procedures the rats were anesthetized with isoflurane inhalation (2%) in 100% oxygen. Twenty male rnu/rnu nude rats (3 - 4 weeks old, 75 - 100 g; Harlan, Indianapolis, IN) were in- oculated subcutaneously with squamous cell carcinoma (SCC4) tumor cells (ATCC, Manassas, VA) in 0.20 ml of saline on the dorsum at the level of the neck as previously described by Bao et al. (2006) [25]. One rat failed to form a tumor and the tumor take rate was 95%. The nineteen tumor-bearing rats were divided into five groups (each group had 4 rats except for group 4 which had 3 rats). Groups 1, 2, 3, 4 and 5 were studied 4, 6, 9, 11 and 13 days after tumor cell inoculation, respectively, to provide a range of tumor sizes based on SCC4 tumor growth characteristics determined by our laboratory. A workflow of the studies is shown in Figure 1. 2.2.CaliperMeasurementofInVivoTumors When each tumor group reached the determined day after inoculation, the tumor imaging measurement studies were initiated. Immediately before MR image acquisition, in vivo tumor dimensions were determined under an- esthesia using a NIST traceable digital caliper (Fisher Scientific, Pittsburgh, PA) with an accuracy of 0.02 mm and a resolution of 0.01 mm by measuring the length (the longest dimension), width (the dimension perpendicular to the length in the plane parallel to the skin surface), and height of each tumor [5]. Then tumor volume was Caliper measurement of in vivotumor MRI scans of in vivotumor US scans of in vivotumor Micro-CT scans of i n vivotumor Caliper measurement of excised (ex vivo ) tumor In-airmicro-CT scans of excised (ex vi vo ) tumor Weighing of excised (ex vivo) tumor Volume calculation of excised (e x vivo ) tumor on in-airmicro-CT image (reference tumor volume) Volume measurement of in vivotumor on US, micro-CT and MR images Subcutaneous injection of tumor cells (SCC4) into nape of rats Figure 1. Workflow for tumor volume measurement in the SCC4 ro- dent tumor model.  Y.C.Leeetal. 120 calculated using the equation V = (π/6) × a × b × c where a, b and c are diameters in three perpendicular dimen- sions [2] [3] [5]. 2.3.MRImageAcquisitionofInVivoTumors MR imaging of tumor-bearing rats was performed using the 7T Bruker MR scanner (Bruker BioSpin MRI GmbH, Ettlingen, Germany) and Bruker linear volume coil. Under anesthesia, MR images were acquired using Turbo Rapid Acquisition with Relaxation Enhancement (RARE)-T2 weighted image sequences (repetition time (TR): 500 ms, echo time (TE): 51.138 ms, number of average: 1, echo train length: 12, flip angle: 70˚, resolution: 0.20 mm × 0.28 mm × 0.31 mm, slice thickness: 0.31 mm) and saved as the Digital Imaging and Communica- tions in Medicine (DICOM) format. Average MR scan time per rat was about 20 - 25 min. 2.4.USImageAcquisitionofInVivoTumors US imaging of tumor-bearing rats was performed under anesthesia using the Vevo 770 unit with a 35 MHz- frequency transducer (Visualsonics Inc., Toronto, ON, Canada). Following hair removal, using B-mode, the plane with the greatest diameter (width) of each tumor in the transverse plane (plane perpendicular to the length of rats) was selected by moving the transducer to measure the width and depth of each tumor. The transducer was then rotated by 90˚ and the plane with the greatest diameter (length) of each tumor was selected to measure length of each tumor. Raw data were recorded and stored in the US system. Average scan time per rat was 10 min. 2.5.Micro‐CTImageAcquisitionofInVivoTumors Micro-CT imaging of tumor-bearing rats was performed using the FLEX X-O micro-CT unit (Gamma Medica- Ideas (now Trifoil Imaging), Northridge, CA). Under anesthesia, CT projection images of the rats were acquired in fly mode as raw data using 75 kVp tube voltage, 370 µA tube current, 256 X-ray projections equally distrib- uted over a 360˚ image acquisition angle, and 1024 × 1024 square image matrix size (resolution: 160 μm × 160 μm × 160 μm). Average scan time per rat was 2 min. The 256 X-ray projections were reconstructed to generate a 512 × 512 × 512 three dimensional (3D) CT data set using the COBRA software (EXXIM Computing Corpora- tion, Pleasanton, CA) and the 3D CT data were converted to the DICOM format using Volumetric Image Visu- alization Identification and Display (VIVID) software (Gamma Medica-Ideas, Northridge, CA). 2.6.Weighing,Ca liperMeasurementandIn‐AirMicro‐CTImageAcquisitionofExcised (ExVivo)Tumors After in vivo micro-CT image acquisitions, anesthetized rats were sacrificed by cervical dislocation and tumors were excised from the rats and trimmed of surrounding tissues. Tumors were immediately weighed on an OHaus GA 2000 electronic balance (Ohaus Corp., Pine Brook, NJ). The precision and accuracy of the balance were confirmed by three repeated measurements of a 1.00000 g NIST traceable standard mass, giving 1.0003 ± 0.0001 g (all empirical values reported as mean ± standard deviation). Then caliper measurements of excised tumors were made in three dimensions and volumes were calculated. In-air micro-CT images of excised tumors were obtained using the FLEX X-O micro-CT unit. Excised tu- mors were mounted on a radiolucent Styrofoam holder of 5 cm × 7 cm × 2.5 cm (Figure 2(a)). The tumor and the Styrofoam holder were completely sealed using clear plastic wrap (Anchor Packing Co., Fenton, MO) to prevent dehydration of excised tumors during micro-CT scans. Then micro-CT images of excised tumors were acquired as the DICOM format using the same imaging protocols as described for in vivo tumors. The time be- tween tumor excision and completion of the micro-CT scan was less than 10 min and it was assumed that no tissue dehydration occurred during that time. 2.7.VolumeCalculationofExcisedTumorsonIn‐AirMicro‐CTImageasReferenceTumor Volume In-air micro-CT image volume of the excised tumors was calculated using an automatic voxel counting method in Analyze software (Version 6.0, Mayo Clinic, Rochester, MN). First, window width and level were set as follows. 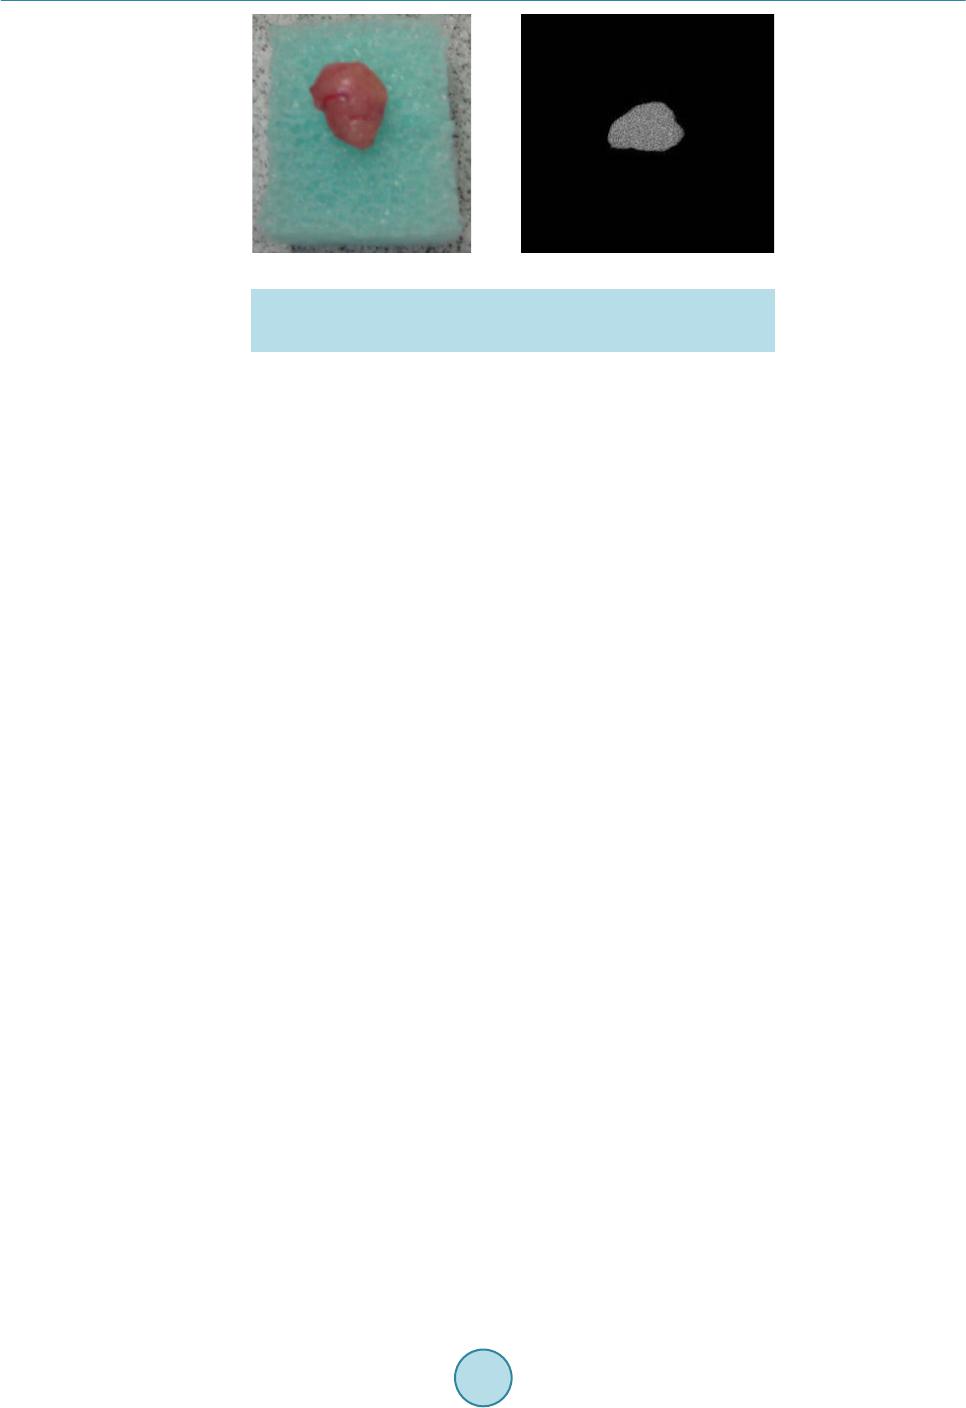 Y.C.Leeetal. 121 (a) (b) Figure 2. (a) An excised tumor mounted on a Styrofoam holder and (b) in-air micro-CT image of the excised tumor after the adjustment of window width and level. The image slice corresponding to the axial-middle of the tumor was selected and a small (10 pixel × 10 pixel) region of interest (ROI) was placed at the center of the tumor. Then mean signal intensity of the ROI (SItumor) was recorded. A similar ROI was placed over air (background) adjacent to the tumor and the mean background signal intensity (SIbackground) was recorded. Then an image display window level was set to SItumor and a window width to the difference SItumor – SIbackground in the entire micro-CT images (Figure 2(b)). Second, a ROI sur- rounding the tumor was defined. Third, the number of voxels inside the ROI was automatically counted and vo- lume was calculated by multiplying the number of voxels by the voxel size. In-air micro-CT image volume of excised tumors was defined as “Reference Tumor Volume”. Then mean density for excised tumors in all groups was calculated by plotting mass as a function of in-air micro-CT image volume of excised tumors using Graph- Pad Prism 5 software (Version 5.04, GraphPad Software Inc., San Diego, CA). 2.8.VolumeMeasurementofInVivoTumorsonUS,Micro‐CTandMRImages Tumor size was measured in three perpendicular dimensions on raw data images saved during US scanning. The longest diameter (width) and the longest perpendicular diameter (depth) of each tumor were measured in the transverse plane perpendicular to the length of the rats using a measurement tool in Vevo 770 v.2.2.3 software. In the sagittal plane parallel to the length of the rats, the longest diameter (length) perpendicular to the two di- ameters was measured. Tumor size was measured in three perpendicular dimensions on MR and micro-CT images using a Full Width at Half Maximum (FWHM) method in ImageJ software (Version 1.42q, National Institutes of Health, Bethesda, MD). ROIs (area: about 1.00 cm2) were designated on tumor and background (soft tissue next to tumor) and the mean signal intensities (SItumor and SIbackground) were recorded. Window width and level were set to SItumor − SIbackground and (SIbackground + SItumor)/2, respectively. In the transverse plane perpendicular to the length of the rats, the longest diameter (width) and the longest perpendicular diameter (depth) of tumors were measured. Likewise, the longest diameter (length) perpendicular to the two diameters was measured in the sagittal plane. In the mi- cro-CT images of tumor-bearing rats, the tumor margins were estimated by contouring the tumors, and the longest perpendicular diameters (width and depth) within the margins measured accordingly. US, MR and mi- cro-CT image-based volumes were calculated for tumors in each group using the same equation as used for ca- liper-based volume. 2.9.StatisticalAnalysis Statistical analysis was performed using GraphPad Prism 5 software. In vivo tumor volumes determined by ca- liper, MRI, US and micro-CT were compared with reference tumor volume by linear regression plots. In addi- tion, caliper measurements of in vivo tumors and caliper measurements of excised (ex vivo) tumors were com- pared by performing a Student’s t-test to determine if there is a statistically significant difference between the two caliper measurements. A p value less than 0.05 was considered statistically significant. Agreement between caliper-based, MR, US, micro-CT image-based volumes and reference tumor volume was also analyzed by Bland-Altman plots (plots of volume difference against mean of volumes) where the central 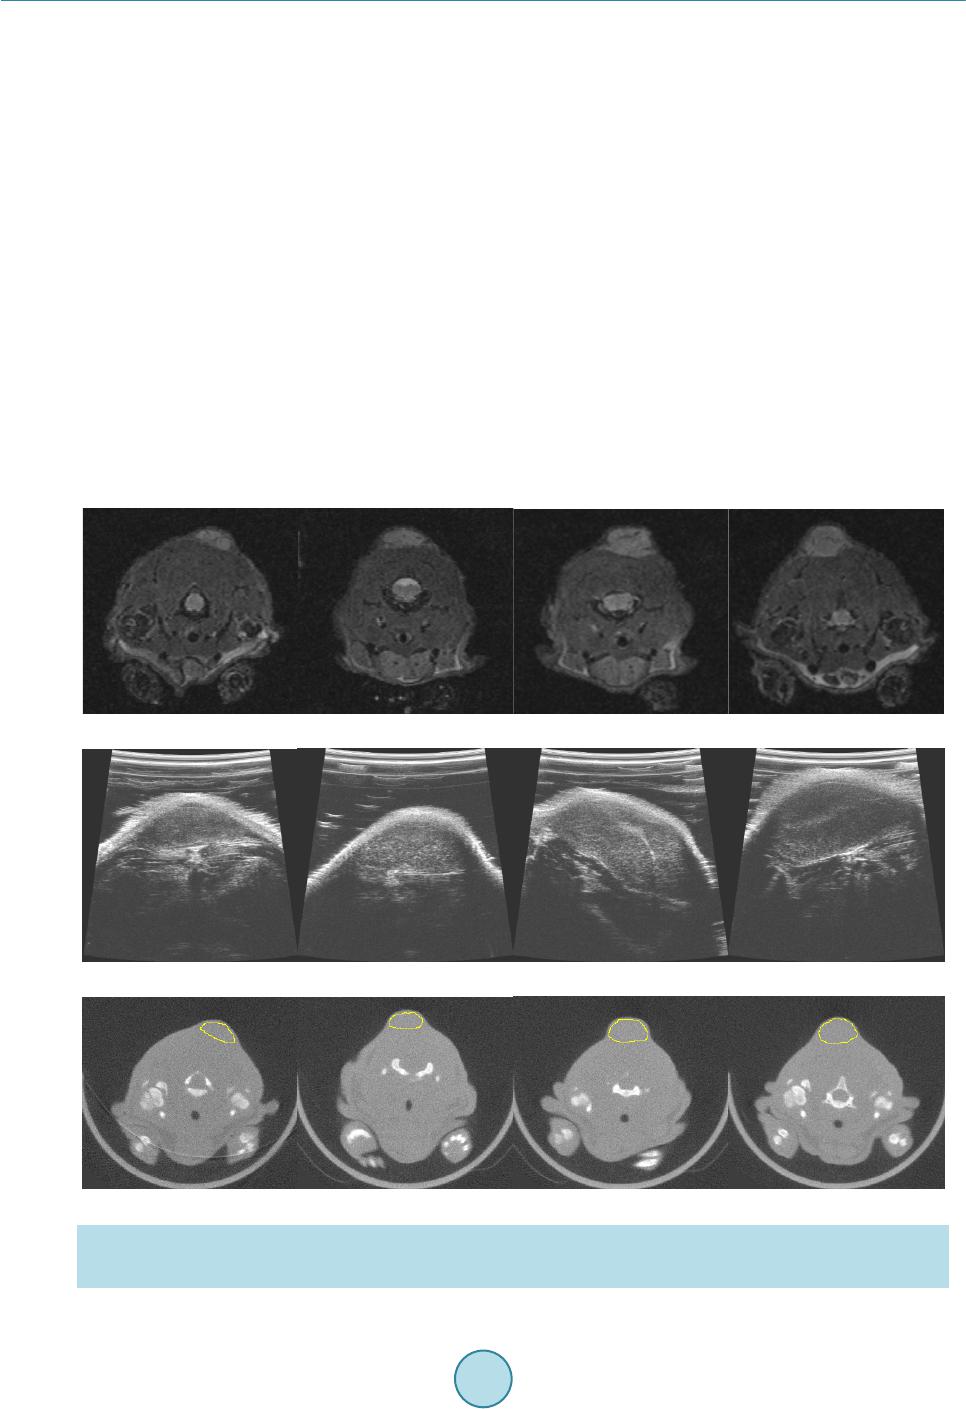 Y.C.Leeetal. 122 line (mean of volume difference) and the other two lines (±2 × standard deviation) indicate the bias and the lim- its of agreements (LoA), respectively [7] [26]. The 95% confidence interval (CI) on bias was calculated to de- termine if bias is significant and if 0 was excluded in the 95% CI on bias, bias was considered significant [7]. 3.Results 3.1.MultimodalityImagingofInVivoTumorsforImage‐BasedVolume In vivo tumor images for four rats in group 3 (average tumor volume: 319.68 mm3) acquired by MRI, US and micro-CT are shown in Figure 3. Tumors appeared with higher signal than surrounding tissues in MR and US images (Figure 3(a) and Figure 3(b)). The contrast between tumors and surrounding tissues was adequate to measure tumor size without contrast agent. CT images (Figure 3(c)) had poor soft tissue contrast as expected and tumor margins were estimated for segmentation of tumor from adjacent soft tissue. 3.2.In‐AirMicro‐CTImageVolumeasAlternativeGoldStandard Excellent contrast between tumor and air in in-air micro-CT image allowed for accurate voxel counting in tumor mass (Figure 2(b)) and the calculated in-air micro-CT image volumes (i.e. micro-CT image-based volumes of ex vivo tumors) as reference tumor volumes are listed in Table 1. Mass (g) was plotted as a function of the in-air micro-CT image volume (cm3) of excised tumors in all groups along with a linear regression plot in Figure 4. Mean density of excised tumors was 1.079 g/cm3 from the slope of the regression line. (a) (b) (c) Figure 3. (a) MR, (b) US and (c) micro-CT images of in vivo tumors for four rats (#9-12 listed in Table 1) in group 3. The images were acquired 9 days after tumor cell inoculation. Estimation of tumor margins in micro-CT images are de- noted by yellow contours.  Y.C.Leeetal. 123 Table 1. Tumor volumes (% deviation from reference tumor volume) measured using various modalities for each rat. In-air micro-CT image volume of ex vivo tumors is reference tumor volume. Volume (mm3) (% deviation) Tumor # Caliper in vivo MRI in vivo US in vivo Micro-CT in vivo Caliper ex vivo Reference in-air micro-CT ex vivo Group 1 (4 Days Post Tumor Cell Inoculation) 1 13.33 (−21.68) 17.88 (5.05) 6.72 (−60.52) 33.53 (97.00) 19.99 (17.45) 17.02 2 49.48 (160.97) 10.68 (−43.67) 37.45 (97.52) 33.10 (74.58) 20.83 (9.86) 18.96 3 59.62 (122.63) 29.30 (9.41) 37.27 (39.17) 45.30 (69.16) 33.42 (24.79) 26.78 4 134.68 (242.17) 62.60 (59.04) 48.84 (24.09) 54.15 (37.58) 48.81 (24.01) 39.36 Mean 64.28 (151.78) 30.12 (17.98) 32.57 (27.58) 41.52 (62.63) 30.76 (20.50) 25.53 Group 2 (6 Days Post Tumor Cell Inoculation) 5 33.07 (−28.45) 45.50 (−1.56) 34.29 (−25.82) 63.46 (37.30) 63.15 (36.63) 46.22 6 44.96 (164.63) 15.40 (−9.36) 19.24 (13.24) 26.72 (57.27) 20.80 (22.43) 16.99 7 65.01 (28.30) 45.67 (−9.87) 59.43 (17.29) 42.32 (−16.48) 45.76 (−9.69) 50.67 8 26.11 (5.62) 23.00 (−6.96) 16.97 (−31.35) 34.34 (38.92) 12.59 (−49.07) 24.72 Mean 42.29 (22.04) 32.39 (−6.52) 32.48 (−6.26) 41.71 (20.38) 35.58 (2.67) 34.65 Group 3 (9 Days Post Tumor Cell Inoculation) 9 202.59 (30.54) 133.69 (−13.85)140.59 (−9.41) 209.75 (35.16) 157.57 (1.53) 155.19 10 248.74 (−1.84) 204.54 (−19.28)271.16 (7.02) 288.55 (13.88) 223.18 (−11.92) 253.39 11 460.40 (17.08) 416.67 (5.96) 422.13 (7.35) 472.39 (20.13) 357.20 (−9.16) 393.24 12 364.60 (−5.89) 420.10 (8.44) 464.11 (19.80) 309.29 (−20.16) 398.32 (2.82) 387.41 Mean 319.08 (7.32) 293.75 (−1.20) 324.50 (9.15) 319.99 (7.63) 284.07 (−4.45) 297.31 Group 4 (11 Days Post Tumor Cell Inoculation) 13 575.43 (−0.19) 607.94 (5.45) 559.85 (−2.89) 529.59 (−8.14) 509.81 (−11.57) 576.51 14 552.48 (34.26) 397.99 (−3.28) 369.49 (−10.21)527.00 (28.07) 418.76 (1.76) 411.50 15 515.24 (52.39) 329.75 (−2.47) 373.96 (10.61) 375.84 (11.16) 393.75 (16.46) 338.10 Mean 547.72 (23.91) 445.23 (0.72) 434.43 (−1.72) 477.48 (8.02) 440.77 (−0.29) 442.04 Group 5 (13 Days Post Tumor Cell Inoculation) 16 725.77 (2.97) 701.46 (−0.48) 676.37 (−4.04) 790.61 (12.17) 832.67 (18.13) 704.85 17 1042.11 (0.25) 1086.33 (4.50) 836.92 (−19.49)1196.39 (15.09) 1096.46 (5.48) 1039.52 18 867.63 (32.01) 617.05 (−6.12) 519.56 (−20.95)740.42 (12.65) 734.46 (11.74) 657.27 19 675.67 (81.55) 350.55 (−5.81) 383.65 (3.09) 424.17 (13.98) 312.33 (−16.08) 372.16 Mean 827.79 (19.37) 688.85 (−0.66) 604.13 (−12.88)787.90 (13.62) 743.98 (7.29) 693.45 3.3.ComparisonofCaliper‐,MR,USandCTImage‐BasedVolumewithReferenceTumor Volume Reference tumor volumes from in-air micro-CT images ranged from 16.99 mm3 to 1039.52 mm3 with a median of 253.39 mm3. The means for the reference tumor volume in each group were 25.53 mm3, 34.65 mm3, 297.31 mm3, 442.04 mm3 and 693.45 mm3 in order. Table 1 summarizes the in vivo tumor volumes measured by caliper, MRI, US and micro-CT, and ex vivo tumor volumes measured by caliper and micro-CT in each group as well as 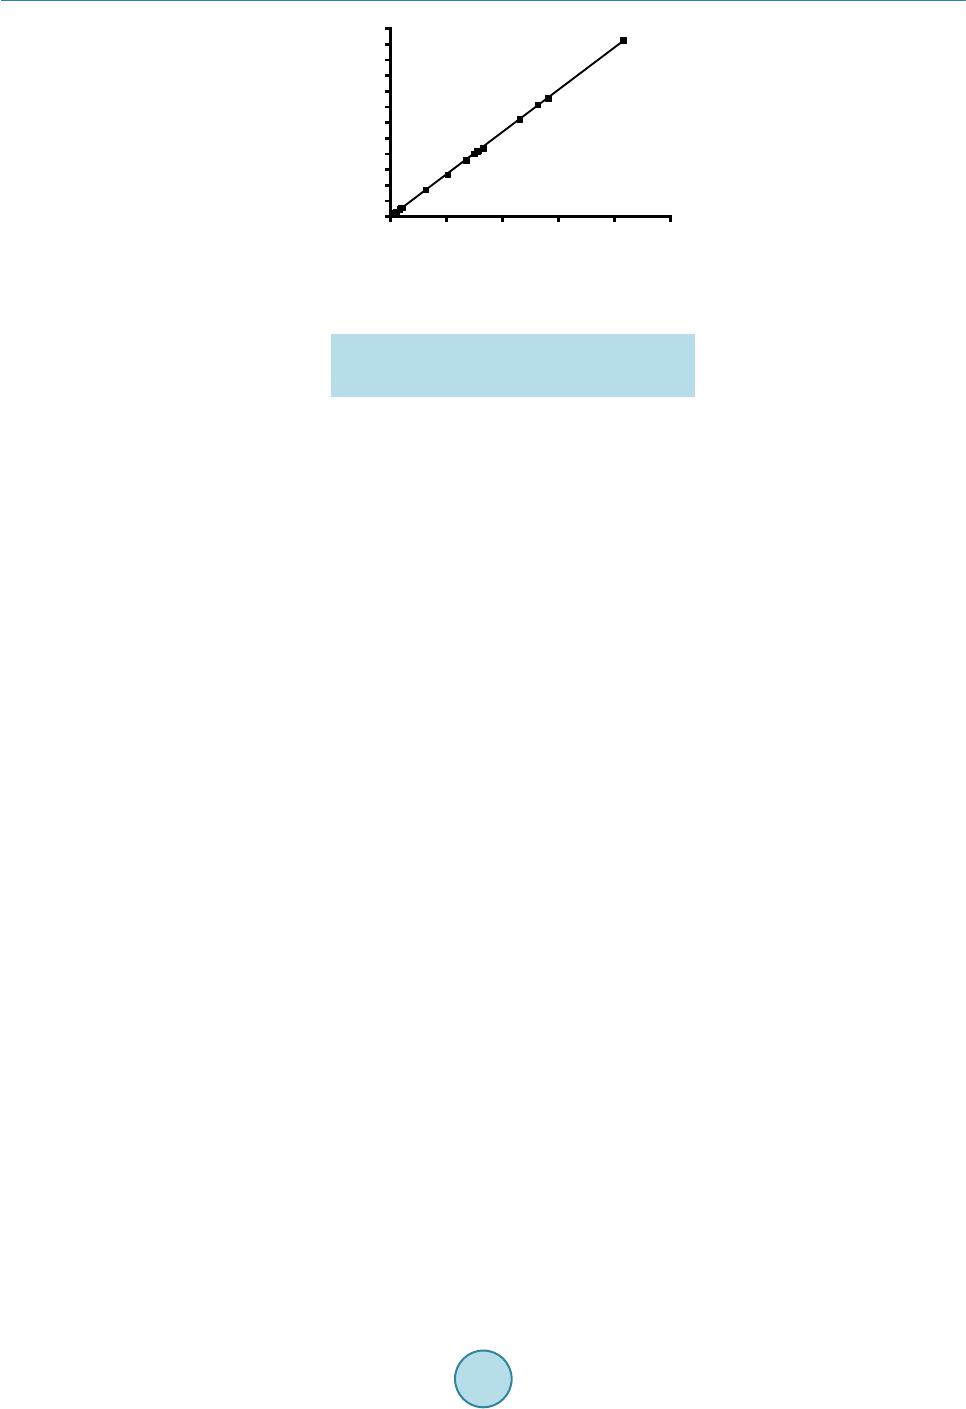 Y.C.Leeetal. 124 0.000.25 0.500.751.00 1.25 0.0 0.1 0.2 0.3 0.4 0.5 0.6 0.7 0.8 0.9 1.0 1.1 1.2 M(g)= 1.0790xV image (cm 3 )+0. 0007 (g/cm 3 )=1.0790 In - air micro-CT Image Volume (cm 3 ) Mass (g) Figure 4. Mean density (1.079 g/cm3) of excised tumors (n = 19) obtained from mass and in-air micro-CT image volume. the % deviations from reference tumor volumes. In vivo caliper measured volumes had the highest mean devia- tions except for group 3. Ex vivo caliper measured volumes were much more accurate as expected.MRI had the lowest mean deviations among the three imaging modalities except for group 2. The smallest tumor volume group (group 1) had the highest deviations in all measured modalities. Tumor volume measured by in vivo and ex vivo caliper, MRI, US and micro-CT all correlated (R2 ≥ 0.9274; p < 0.0001) with reference tumor volume (Figure 5 and Table 2). As a result of linear regression plots, caliperin v ivo versus reference tumor volume had the best fit of line Y = (1.056 ± 0.072) × + 42.96 ± 29.25 (R2 = 0.9274; p < 0.0001) (Figure 5(a) and Table 2). Similarly, the best lines for MRI, US and micro-CT and caliperex vivo are ta- bulated in Table 2. Of all the modalities, MRI measured volume was the most correlated with the reference tu- mor volume (R2 = 0.9939) and in vivo calipermeasured volume the least correlated (R2 = 0.9274) (Table 2). The two (in vivo and ex vivo) caliper measurements were significantly different (p < 0.05) in a paired t-test. Each calipermeasured tumor volume was compared with the reference tumor volume as shown in Figure 5(a) and Figure 5(e), and in vivo and ex vivo calipermeasured tumor volumes were both overestimated (by about 6% from the slopes of regression lines). Figure 6 depicts Bland-Altman plots of volumes measured by caliperin vivo , MRI, US, micro-CT, and caliperex vi vo versus reference tumor volume. The mean volume difference between caliperinvivo and reference tumor volume (bias) was 59.32 mm3 (95% CI on difference: 54.76 - 99.09 mm3; LoA: −114.00 - 232.70 mm3) (Table 3). Therefore, caliperin vivo had significant bias when compared with reference tumor volume. Similarly, the mean volume differences for MRI, US, micro-CT and caliperex vivo are shown in Table 3. Significant bias of caliperin vivo, micro-CT and caliperex vivo measurements and non-significant bias of MRI and US measurements compared with the reference tumor volume were observed (Table 3). 4.Discussion 4.1.MultimodalityImagingofInVivoSolidTumorsforImage‐BasedVolume The 7T MRI unit used in the present study provided high spatial resolution (0.20 mm × 0.28 mm × 0.31 mm), high signal-to-noise ratio (SNR) and good soft tissue contrast as shown in Figure 3(a) and allowed for the ob- vious definition of tumor borders among the three imaging modalities. Field of view and matrix size determine spatial resolution while other factors such as slice thickness, field of view (FOV), size of the image matrix, number of acquisitions, scan parameters (TE, TR and flip angle) and magnetic field strength determine the SNR. These factors were optimized for better visualization of the tumors in T2-weighted images and high magnetic strength (7T) improved the SNR. Similarly, the 35 MHz frequency US transducer used in this study provided high resolution and relatively good soft tissue contrast which facilitated visualization of tumor boundaries (Figure 3(b)). However, FOV decreases with frequency and high frequency limits the size of the tumor that can be scanned (Table 1). In most cases, CT contrast agent is required to better visualize tumor borders in CT im- ages. Even with the high resolution of the micro-CT (0.16 mm × 0.16 mm × 0.16 mm) used in this study, it was 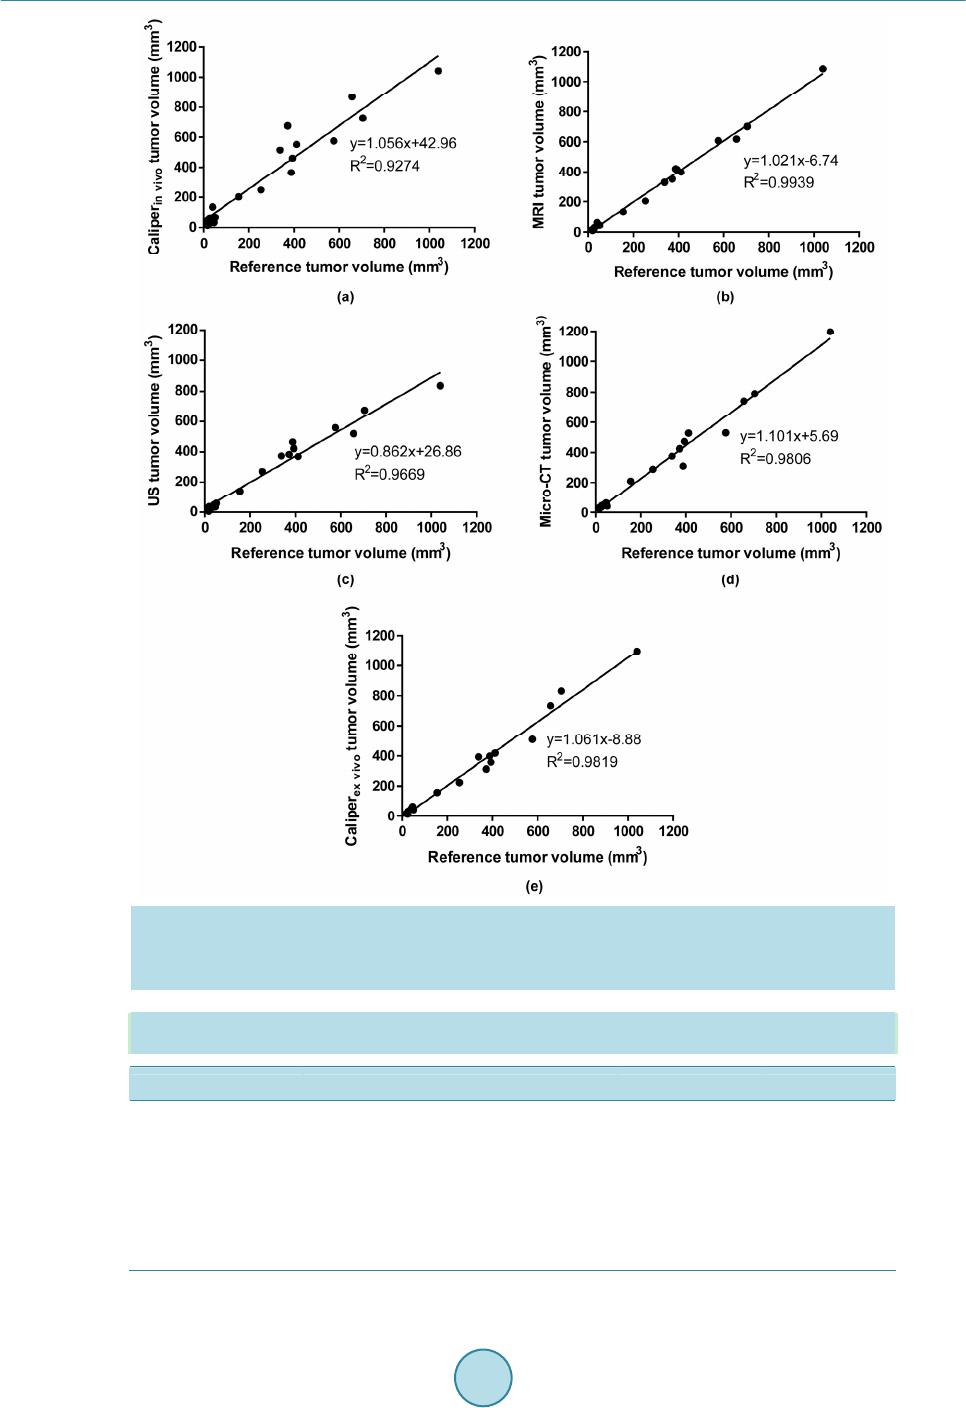 Y.C.Leeetal. 125 Figure 5. Linear regression plots for tumor volume determined by (a) caliperin vivo, (b) MRI, (c) US, (d) micro-CT, and (e) caliperex vivo against reference tumor volume. Caliperin vivo and Caliperex vivo denotes ca- liper measurements of in vivo and ex vivo tumors, respectively. Reference tumor volume was determined using in-air micro-CT imaging. Table 2. Linear regression plot results for tumor volume determined by four methods (caliper, MRI, US and micro-CT). A slope is significantly non-zero when p < 0.05. Modality Best fit R2 P value Caliperin vivo Y = (1.056 ± 0.072)X + 42.96 ± 29.25 0.9274 <0.0001 MRI Y = (1.021 ± 0.019)X − 6.74 ± 7.92 0.9939 <0.0001 US Y = (0.862 ± 0.039)X + 26.86 ± 15.78 0.9669 <0.0001 micro-CT Y = (1.101 ± 0.038)X + 5.69 ± 15.50 0.9806 <0.0001 Caliperex vivo Y = (1.061 ± 0.035)X − 8.88 ± 14.27 0.9819 <0.0001 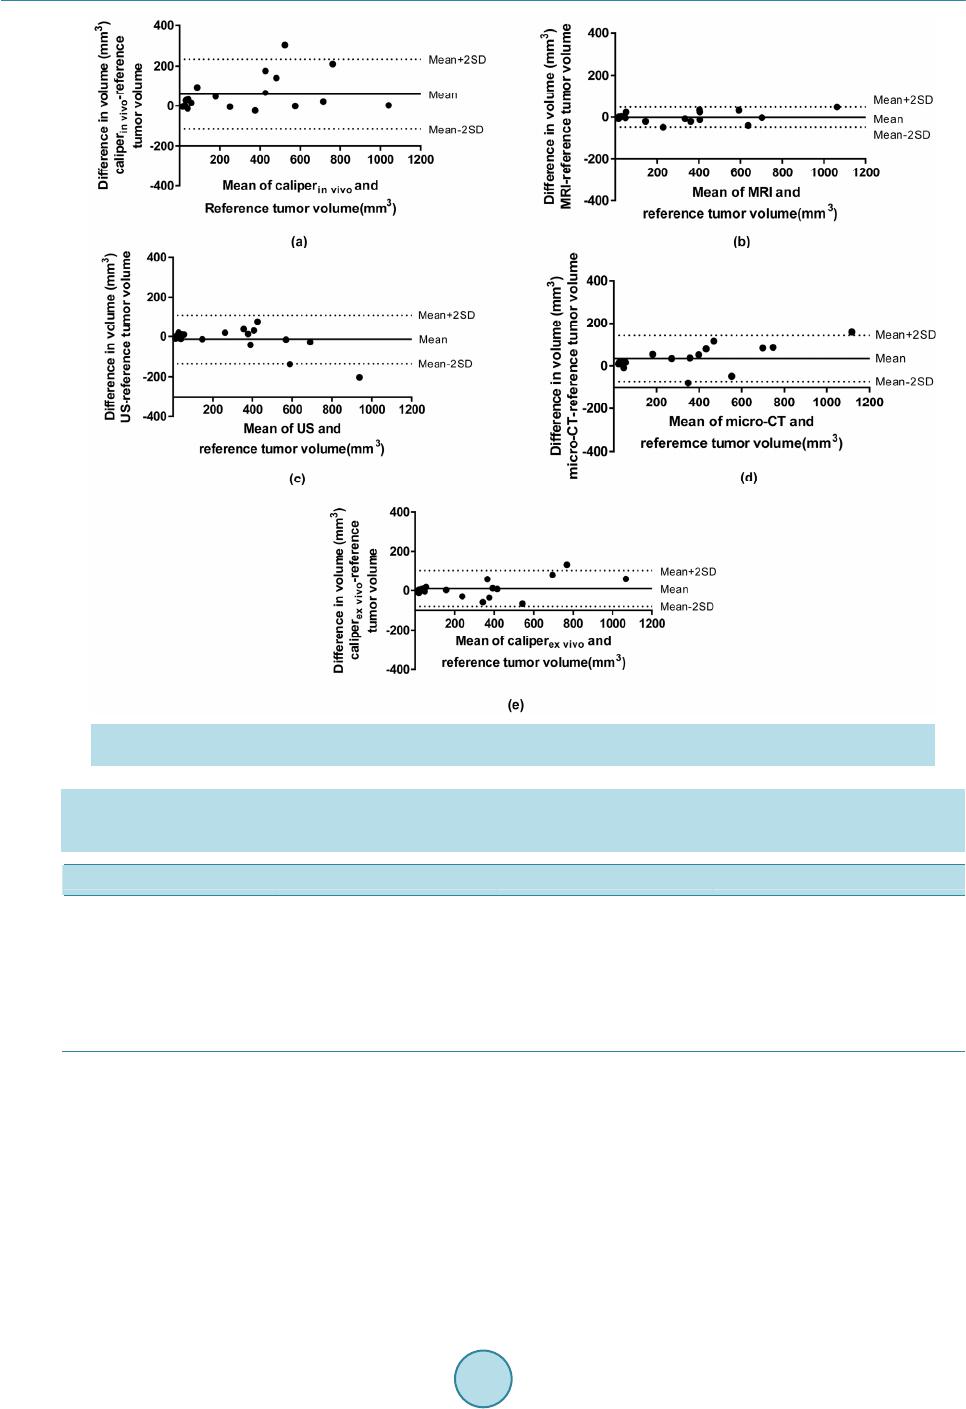 Y.C.Leeetal. 126 Figure 6. Bland-Altman plots of (a) caliperin vivo, (b) MRI, (c) US, (d) micro-CT and (e) caliperex vivo for tumor vol- ume measurements. The mean indicates the bias and mean ± 2SD indicate the limits of agreement (LoA). Table 3. Bland-Altman plot results for tumor volume determined by four methods (caliper, MRI, US and micro-CT). Bias is the average of tumor volume difference from reference tumor volume. If 0 is within 95% confidence interval (CI), bias is not significant. LoA means 95% limits of agreement. Modality Bias (mm3) 95% CI (mm3) LoA (mm3) Caliperin vivo 59.32 54.76 - 99.09 −114.00 - 232.70 MRI −0.72 −1.98 - 10.20 −48.36 - 46.91 US −13.26 −16.45 - 14.61 −134.70 - 108.20 micro-CT 35.11 32.30 - 59.58 −71.55 - 141.80 Caliperex vivo 8.95 6.27 - 29.65 −81.28 - 99.18 still difficult to differentiate tumors from surrounding soft tissues in the non-contrast enhanced images (Figure 3(c)). 4.2.In‐AirMicro‐CTImageVolumeasAlternativeGoldStandard In this study, the density (1.079 g/cm3) of SCC4 tumor was obtained from accurate measurements of mass and in-air micro-CT image volume (Figure 4). If we had simply assumed that the density was 1.00 g/cm3 as re- ported in several studies [7] [10], the tumor volumes would have been underestimated by about 8%. To our knowledge, the accuracy of in-air micro-CT image volume had not previously been validated for tumor studies  Y.C.Leeetal. 127 and it has not been used before as a reference/true tumor volume. Fullerton et al. in the same research group ini- tially proved that in-air micro-CT image volume is fairly accurate (~0.6%) [14] and we adopted the method. For this study, we assumed that no dehydration of excised tumors occurred during the time (less than 10 min) be- tween tumor excision and completion of the micro-CT scans. However, in future studies excised tumors should be weighed immediately after excision and after completion of the micro-CT scans to determine if this assump- tion is acceptable. One limitation of widespread adoption of the in-air micro-CT method for tumor volume measurement is the availability, additional cost of micro-CT scanners and appropriate software for voxel count- ing compared with the caliper method. 4.3.ComparisonofCaliper‐,MR,USandCTImage‐BasedVolumewithReferenceTumor Volume There are several ways to measure tumor volume in animal studies as discussed earlier. Often diameters in two or three dimensions are linearly measured and volume is calculated using an appropriate tumor volume equation [5]. Nowadays volume measuring software is commonly available and volume can be readily calculated by dif- ferent techniques [4] [6] [7]. In this study, we assumed an ellipsoidal tumor shape which is known to best repre- sent the actual tumor [27] and the linear method allowed us to keep consistency among the four different mo- dalities (three imaging modalities and a caliper) because a volumetric technique cannot be applied to the caliper method. The results shown in this study provides pharmaceutical laboratory users with an idea about the com- parative accuracy of imaging methods available in achieving study design goals for new cancer therapy proto- cols. Hence, it is anticipated that use of the methods demonstrated here will assist animal imaging laboratories in providing more consistent results for costly drug studies and thereby reduce the number of animals needed to achieve their goals. Caliper measurements of in vivo tumors have been known for inaccuracy and unreliability [7] [12]. In the present study, caliper measurements of in vivo tumors overestimated the tumor size (Table 1 and Table 2), which was a similar finding as reported by Shoma et al. [13]. Average % deviations from the reference tumor volume ranged from 7.32% to 151.78% (Table 1). Jensen et al. also showed that an external caliper overesti- mated subcutaneous tumor volume (slope of linear regression line: 1.24, R2 = 0.75) compared with reference tumor volume which was the tumor mass multiplied by tumor density of 1.00 g/cm3. Their results match our in vivo caliper measurements which show overestimation and systematic bias (Table 2 and Table 3). Percent de- viations in Table 1 include both random and systematic errors. The majority of random errors are human errors and experienced observers can reduce the magnitude of errors to a certain extent. Systematic errors could be due to several reasons mentioned in the Introduction such as interference from hair, skin, fat and edema. If subtrac- tion of known skin thickness (range of 500 - 1500 µm) is applied [28], errors would be reduced. Although the equation reproduces the actual tumor volume the best, the volume equation used in this study also caused sys- tematic errors because tumor shape was assumed to be ellipsoidal; however, most tumors especially those with large dimensions are an irregular shape [27]. The average deviations in caliper measurements of ex vivo tumor volumes were less for each group (20.50%, 2.67 %, −4.45 %, −0.29 % and 7.29% in order) compared with in vivo tumor caliper measurements (Table 1). Nonetheless, ex vivo tumor size was still overestimated in three groups (groups 1, 2 and 5) (Figure 5(e) and Ta- ble 1, Table 2) and bias (the mean of tumor volume difference from reference tumor volume) was significant in Bland-Altman plots (Table 3). These results confirm that caliper measurements are not accurate regardless of skin and/or hair and in spite of the observer measuring the longest lengths of ex vivo tumors in all three dimen- sions. It also supports Ayer et al.’s study that the tumor volume formula does not exactly represent actual tumor shape [10]. The t-test results display no repeatability between in vivo and ex vivo tumor volume measurements. Nonetheless, the caliper technique is still commonly used because it can rapidly estimate tumor volume or tumor growth rate [27]. Of the in vivo modalities tested, MRI measured tumor volume most closely corresponded to the reference tu- mor volume (slope = 1.021; R2 = 0.9939; p < 0.001) based on the linear regression analysis. Average volumes of three groups (groups 2, 3 and 5) were underestimated compared with reference tumor volume (Table 1). The Bland-Altman plot also showed non-significant bias (Table 3). In this study, the soft tissue contrast provided by the 7T MRI allowed an observer to differentiate tumors better than in other imaging modalities. This could re- duce errors of volume measurements. The errors come from random and systematic errors as well. Like caliper  Y.C.Leeetal. 128 measurements, random errors are related to human-involved errors. Firstly, although the MRI provided very thin slice thickness (0.31 mm), the observer could miss the border of the tumor located between two slices and the tumor size would be underestimated. Using a thicker slice thickness would not improve delineating the tumor border. Secondly, rats were positioned parallel to the bed in the MRI bore but the longest dimension of the tu- mors was not necessarily parallel to the axis of the image. This positioning could also have caused the underes- timation of tumor size. Volume measurements by volumetric technique could resolve this issue. Thirdly, even with high spatial resolution (0.20 mm × 0.28 mm × 0.31 mm), defining the exact tumor boundary around the surrounding soft tissues is sometimes challenging and still subject to errors. Kawano et al. reported that small tumors less than 1.5 mm in diameter were difficult to be measured even in a 9.4T MRI [29]. If available, a MRI with stronger magnetic field would provide higher resolution to measure small tumors despite the increased spa- tial distortion [29]. MRI systematic errors result from similar reasons as for caliper measurements. First, the vo- lume equation could create errors to a certain degree. In the same fashion, better volumetric techniques could improve the accuracy of volume measurements. Second, different imaging parameters or imaging sequences could affect imaging quality and consequently, tumor measurement accuracy. Martiniova et al. demonstrated that volume measurements by a 3T MRI with the resolution of 0.156 mm × 0.156 mm × 0.5 mm was within about 8% compared with pathology specimens [22]. However, they didn’t describe how the volumes were measured [22]. Our study showed better results (2.1%) (Table 2). Kawano et al. demonstrated MRI correlated well with caliper measurements in mice models (r = 0.944) [29]. In their study, MR measurement of tumor vo- lumes was made using Image J software and caliper measurements at necropsy were made using the same for- mula as used in this study. Abou-Elkacem et al. showed that ex vivo tumor volumes by caliper significantly cor- related with in vivo tumor volumes by a 3T MRI in mice models (R2 = 0.96, p < 0.05) [30]. In their study, the tumor volumes were calculated using the formula π/6 × length × width2 for caliper and π/6 × length × width × depth for MRI assuming ellipsoidal shape. Similarly, our study showed that the correlation coefficients (r) in the regression lines of MRI versus caliper measurements were 0.9027 and 0.9725for caliperin vivo, and caliperex vivo respectively. As known, MRI provides excellent soft tissue contrast and non-ionizing imaging. Nonetheless, MRI has high infrastructure costs and thus, it is not available in every institution. Also MRI requires preparation and lengthy scanning time which lead to motion artifacts in the images [8]. Our US study described that tumor volumes in groups 1 and 3 were overestimated while those in the other groups were underestimated and the slope (0.862) of the linear regression plot showed underestimation (R2 = 0.9669, p < 0.0001) (Table 1 and Table 2). Still, bias was not significant in Bland-Altman plot (Table 3). The sources of errors can be divided into random errors and systematic errors as follows. In this study, a 2D plane with a maximum diameter (width) was identified during scanning and the maximum perpendicular diameters (width and depth) were measured in the plane based on WHO criteria. The same method was used for length. However, it was difficult to ensure that the longest diameters were identified during scanning as described by Graham et al. [21]. Also the diameter perpendicular to the maximum diameter in one dimension was not neces- sarily the longest in the other dimension in the plane. The longest diameter in each dimension (width, length and depth) should be measured separately to reduce high random errors. Acquiring the 3D data set and calculating tumor volume offline afterwards would allow for enough time and control and therefore, result in more accurate volume measurements. A random error was also caused by the inaccurate definition of tumor margins in the US images. Although the 35 MHz frequency transducer offered high resolution (axial resolution: 0.11 mm; lateral resolution: 0.05 mm), it was still challenging to define the boundaries of the tumor as seen in Figure 3(b) due to reduced echogenicity at the edges, and this estimation of the tumor boundaries could cause errors. The highest deviations were observed in the smallest tumor group. Another random error was the underestimation of the tu- mor diameters for some tumors in the largest tumor group (group 5) that were out of the field of view due to the limited field of view provided by the high frequency US. Negative % errors in most tumors in group 5 were at- tributed to this reason. For large tumors outside of the field of view, a lower frequency transducer should be used or the tumor size should be limited to fit the field of view. No assumption of defined tumor shape could cause systematic errors. Other volume methods or techniques to better define tumor shape need to be performed to see if errors would be reduced. Ayers et al. reported that US measured volumes exhibit significantly more accuracy, precision and reproducibility than manual standard caliper measurements in subcutaneous tumors of nude mice models [10]. In their study, true tumor volume was calculated from mass assuming density was 1.00 g/cm3. Then tumor volumes were calculated from caliper measurements using the formula 1/2 × a × b2 where a and b are the two longest perpendicular dimensions in the a-b plane of each tumor. US image-based volume was  Y.C.Leeetal. 129 determined by segmenting in-plane tumor and multiplying it by inter-slice spacing. Faustino-Rocha et al. pre- sented a significant correlation between US and caliper volume measurements in rat models using the formula 1/2 × width2 × length for caliper measurements and (4/3π) × (length/2)2 × (depth/2) for US [31]. In the present study, average US tumor volumes were closer to the reference tumor volume than average in vivo tumor vol- umes measured by a caliper (Table 1). US and caliper volume measurements correlated fairly well and correla- tion coefficients (r) in the regression lines of US versus caliper measurements were 0.8998 and 0.9374 for cali- perin vivo and caliperex vivo respectively. As displayed in Figure 3(b) and described in other studies, a high fre- quency US provides relatively good soft tissue contrast which facilitates volume measurements with accuracy and precision although slightly reduced echogenicity at the tumor edges was observed. Hastie et al. described that low levels of intra-observer variabilities (≈10% to 18%) were observed in high frequency US [32]. CT images have inherently poor soft tissue contrast and thus, it can be quite challenging to define tumor boundaries with this modality. As a result, tumor volume can be overestimated or underestimated. Contrast- enhanced micro-CT may improve the sensitivity in detecting tumors and is effective especially for small tumors [33] [34]. In the present study, without contrast agent, micro-CT tumor volumes were overestimated (Figure 5(d) and Table 1, Table 2) and had significant bias in a Bland-Altman plot although the linear regression plot showed a fairly strong correlation (R2 = 0.9806) with the reference tumor volume. Major errors were due to poor soft tissue contrast even though tumors were located subcutaneously. Also the assumption of an ellipsoidal tu- mor shape in calculating tumor volumes caused a systematic error. The acquisition parameters for the micro-CT scanner used in this study were similar to those used predominately by cancer researchers to co-register an ana- tomical CT image to either a PET or SPECT image. Although the resolution (160 μm) was not as high as could be achieved by some commercial dedicated micro-CT scanners for small animal studies, the parameters used were typical for our laboratory and a good compromise between resolution, throughput, acquisition time and ra- diation dose, which all must be considered when designing small animal imaging studies. Jensen et al.’s study contradicted our results: the slope of regression line for micro-CT was 1.01 and there was no significant bias [7]. Their study demonstrated that micro-CT was more accurate than caliper using a reference tumor volume of mass multiplied by density 1.00 g/cm3 [7]. For caliper measurements, the ellipsoidal formula was 1/2 × length × width2 and for micro-CT, tumor volume was generated by summation of voxels [7]. Ishimori et al. also showed similar results to Jensen et al.’s: micro-CT was better than caliper for tumor volume measurement [12]. The same formula (1/2 × length × width2) for caliper tumor volume determination and the segmentation of in-plane tumor multiplied by inter-slice spacing for micro-CT were used [12]. In the present study, like in US imaging, average micro-CT volumes were closer to the reference tumor volume than average in vivo caliper volumes (Table 1). Abou-Elkacem et al. showed a good correlation (R2 = 0.90; p < 0.05) between MRI volume and mi- cro-CT volume for large tumors although non-contrast micro-CT was less sensitive than MRI [30]. In compari- son, our study showed correlation coefficient (R2) of 0.9670 between these two modalities. Prajapati et al. com- pared ex vivo micro-CT based virtual histology volume with in vivo MRI-based volume and demonstrated that there was a strong correlation between the two datasets (R = 0.998) [16]. A primary advantage of CT scans is they provide a rapid assessment of tumor burden although there is a concern that a high accumulation of radia- tion dose from repeated CT scans might interfere with tumor growth [30]. Boone et al. reported the mean dose to a mouse per scan from a micro-CT scanner and the dose might not be negligible (>0.2 Gy per scan) depend- ing on scan parameters and animal size [35]. However, Foster and Ford concluded that the radiation dose from longitudinal micro-CT imaging does not cause inhibition of tumor growth [17]. In this study, tumors in each group were excised immediately after in vivo micro-CT scans followed by ex vivo caliper measurements and in-air micro-CT scans and thus, radiation dose interference with tumor growth, if any, was not a concern. 4.4.FutureDirectionsandRecommendations Future studies will need to be performed as follows. First, better 3D volume image analysis techniques will need to be implemented for more accurate tumor volume measurements in MR, US and CT images. Methods used in this study provided a rapid and simple way for an observer who doesn’t have access to software or tools for 3D volume measurement. Graham et al. showed that in US, there were large differences in measured tumor volumes between formula based and 3D segmented methods [21]. The mean percent difference for B16F1 liver metasta- ses was −8.8% ± 23.5% (range, −90.1% to 53.2%). For a formula based method, an ellipsoidal shape was as- sumed and the formula V = (π/6) × width × length × depth was used. Cheung et al. showed that a 3D method in  Y.C.Leeetal. 130 US was more accurate and reliable than a formula based method for volume determination of regular and ir- regular shaped phantoms [36]. There was a weaker correlation between 2D image-based volume (the same method as our study) and 3D segmented volume (cross-sectional area multiplied by slice thickness) than corre- lation (a correlation coefficient of 0.9813 (p < 0.0001) for tumors greater than 1 mm3) between 3D image-based volume (volume calculated from maximum three diameters measured in 3D reconstructed images) and 3D seg- mented volume [31]. Even intra-observer and inter-observer variabilities were lower for the 3D segmentation method. However, slice thickness may introduce minor errors in volume estimation [36]. Second, intra-observer and inter-observer measurements in each modality need to be made as performed in other studies to estimate both accuracy and precision. Also a volume measurement comparison between trained and untrained personnel could be made. Lastly, validation procedures for accurate volume measurement need to be developed. Currently available US FDA approved imaging biomarkers are RECIST and WHO criteria. However, as mentioned in the Introduction, volume and density criteria are under development and these new methods could be the next sur- rogate for anti-tumor drug testing. Lee et al. developed quality assurance (QA) procedures for RECIST and WHO criteria [2] [3]. Once volume and density criteria are fully developed, QA procedures for volume criteria will also need to be established. In this study, rodent tumor volumes measured by four different modalities (caliper, MRI, US and micro-CT) and the deviations to the reference tumor volume that unexperienced or untrained personnel could achieve were presented. Unlike most studies depicting tumor growth curves in rodent models, the focus of this study was on the volumes of tumors grouped according to determined time-points after tumor inoculation. The results could be a good reference for tumor volume measurement and its errors in multiple modalities. Each modality has its own pros and cons and therefore, it is reasonable to conclude that accuracy, cost, time and other factors have to be considered when users select an appropriate modality [30]. Before performing tumor volume measurements preclinically or even clinically, it is recommended that an observer perform validation testing in the modality that he or she chooses with the same imaging protocols and measurement methods using a standardized phantom as shown in Lee et al. for QA purposes [2] [3]. 5.Conclusion This study showed the possibility of using in-air micro-CT image volume as a reference tumor volume in rodent studies. As expected, caliper tumor volume measurements were unreliable. Of the preclinical imaging modalities tested, tumor volumes measured by MRI most closely corresponded to the reference tumor volume since the 7T MRI provided excellent soft tissue contrast, high spatial resolution and high SNR. Acknowledgements The authors would like to thank Cristina A. Santoyo in the Department of Radiology at UTHSCSA and Jesse Ursey in the Research Imaging Institute for their help during animal experiments. The authors are also grateful to the Research Imaging Institute for permission to use the 7T MR scanner. References [1] Euhus, D.M., Hudd, C., LaRegina, M.C. and Johnson, F.E. (1986) Tumor Measurement in the Nude Mouse. Journal of Surgical Oncology, 31, 229-234. http://dx.doi.org/10.1002/jso.2930310402 [2] Lee, Y.C., Goins, B.A. and Fullerton, G.D. (2010) QA Procedures for Multimodality Preclinical Tumor Drug Response Testing. Medical Physics, 37, 4806-4816. http://dx.doi.org/10.1118/1.3464491 [3] Lee, Y.C., Fullerton, G.D., Baiu, C., Lescrenier, M.G. and Goins, B.A. (2011) Preclinical Multimodality Phantom De- sign for Quality Assurance of Tumor Size Measurement. BMC Medical Physics, 11, 1. http://dx.doi.org/10.1186/1756-6649-11-1 [4] Sohaib, S.A., Turner, B., Hanson, J.A., Farquharson, M., Oliver, R.T.D. and Reznek, R.H. (2000) CT Assessment of Tumor Response to Treatment: Comparison of Linear, Cross-Sectional and Volumetric Measures of Tumor Size. Brit- ish Journal of Radiology, 73, 1178-1184. http://dx.doi.org/10.1259/bjr.73.875.11144795 [5] Tomayko, M.M. and Reynolds, C.P. (1989) Determination of Subcutaneous Tumor Size in Athymic (Nude) Mice. Cancer Chemotherapy and Pharmacology, 24, 148-154. http://dx.doi.org/10.1007/BF00300234 [6] Prasad, S.R., Jhaveri, K.S., Saini, S., Hahn, P.F., Halpern, E.F. and Sumner, J.E. (2002) CT Tumor Measurement for Therapeutic Response Assessment: Comparison of Unidimensional, Bidimensional, and Volumetric Techniques-Initial  Y.C.Leeetal. 131 Observations. Radiology, 225, 416-419. http://dx.doi.org/10.1148/radiol.2252011604 [7] Jensen, M.M., Joergensen, J.T., Binderup, T. and Kjaer, A. (2008) Tumor Volume in Subcutaneous Mouse Xenografts Measured by microCT Is More Accurate and Reproducible than Determined by 18F-FDG-microPET or External Cali- per. BMC Medical Imaging, 8, 16. http://dx.doi.org/10.1186/1471-2342-8-16 [8] Folio, L., Derderian, V., Steinberg, S.M., Turkbey, E. and Apolo, A.B. (2014) Assessing Tumor Response Using CT Density-Volume Trajectory in Metastatic Bladder Cancer. Proceedings of ASCO Annual Meeting, Journal of Clinical Oncology, 32, Article ID: 4539. [9] Girit, I.C., Jure-Kunke, M. and McIntyre, K.W. (2008) A Structured Light-Based System for Scanning Subcutaneous Tumors in Laboratory Animals. Comparative Medicine, 58, 264-270. [10] Ayers, G.D., McKinley, E.T., Zhao, P., Fritz, J.M., Metry, R.E., Deal, B.C., Adlerz, K.M., Coffey, R.J. and Manning, H.C. (2010) Volume of Preclinical Xenograft Tumors Is More Accurately Assessed by Ultrasound Imaging than Man- ual Caliper Measurements. Journal of Ultrasound Medicine, 29, 891-901. [11] Fornage, B.D., Toubas, O. and Morel, M. (1987) Clinical, Mammographic, and Sonographic Determination of Preop- erative Breast Cancer Size. Cancer, 60, 765-771. http://dx.doi.org/10.1002/1097-0142(19870815)60:4<765::AID-CNCR2820600410>3.0.CO;2-5 [12] Ishimori, T., Tatsumi, M. and Wahl, R. (2005) Tumor Response Assessment Is More Robust with Sequential CT Scan- ning than External Caliper Measurements. Academic Radiology, 12, 776-781. http://dx.doi.org/10.1016/j.acra.2005.03.062 [13] Shoma, A., Moutamed, A., Ameen, M. and Abdelwahab, A. (2006) Ultrasound for Accurate Measurement of Invasive Breast Cancer Tumor Size. Breast Journal, 12, 252-256. http://dx.doi.org/10.1111/j.1075-122X.2006.00249.x [14] Fullerton, G.D., Amurao, M., Rahal, A. and Cameron, I.L. (2011) Micro-CT Dilatometry Measures of Molecular Col- lagen Hydration Using Bovine Extensor Tendon. Medical Physics, 38, 363-376. http://dx.doi.org/10.1118/1.3514123 [15] Clark, D.P. and Badea, C.T. (2014) Micro-CT of Rodents: State-of-the-Art and Future Perspectives. Physica Medica, 30, 619-634. http://dx.doi.org/10.1016/j.ejmp.2014.05.011 [16] Prajapati, S.I., Kilcoyne, A., Samano A.K., Green, D.P., McCarthy, S.D., Blackman, B.A., Brady, M.M., Zarzabal, L.A., Tatiparthy, A.K., Sledz, T.J., Duong, T., Ohshima-Hosoyama, S., Giles, F.J., Michalek, J.E., Rubin, B.P. and Keller, C. (2011) MicroCT-Based Virtual Histology Evaluation of Preclinical Medulloblastoma. Molecular Imaging and Biology, 13, 493-499. http://dx.doi.org/10.1007/s11307-010-0372-3 [17] Foster, W.K. and Ford, N.L. (2011) Investigating the Effect of Longitudinal Micro-CT Imaging on Tumour Growth in Mice. Physics in Medicine and Biology, 56, 315-326. http://dx.doi.org/10.1088/0031-9155/56/2/002 [18] Graham, K.C., Ford, N.L., MacKenzie L.T., Postenka, C.O., Groom, A.C., MacDonald, I.C., Holdsworth, D.W., Drangova, M. and Chambers, A.F. (2008) Noninvasive Quantification of Tumor Volume in Preclinical Liver Metasta- sis Models Using Contrast-Enhanced X-Ray Computed Tomography. In v e s t i g a t i v e Radiology, 43, 92-99. http://dx.doi.org/10.1097/RLI.0b013e31815603d7 [19] Boonstra, H., Oosterhuis, J.W., Oosterhuis, A.M. and Fleuren, G.J. (1983) Cervical Tissue Shrinkage by Formaldehyde Fixation, Paraffin Wax Embedding, Section Cutting and Mounting. Virchows Archiv A, 402, 195-201. http://dx.doi.org/10.1007/BF00695061 [20] Carthew, P., Maronpot, R.R., Foley, J.F., Edwards, R.E. and Nolan, B.M. (1996) Method for Determining Whether the Number of Hepatocytes in Rat Liver Is Increased after Treatment with the Peroxisome Proliferator Gemfibrozil. Jour- nal of Applied Toxicology, 17, 47-51. http://dx.doi.org/10.1002/(SICI)1099-1263(199701)17:1<47::AID-JAT389>3.0.CO;2-4 [21] Graham, K.C., Wirtzfeld, L.A., MacKenzie, L.T., Postenka, C.O., Groom, A.C., MacDonald, I.C., Fenster, A., Lace- field, J.C. and Chambers, A.F. (2015) Three-Dimensional High-Frequency Ultrasound for Longitudinal Evaluation of Liver Metastases in Preclinical Models. Cancer R es earch , 65, 5231-5237. http://dx.doi.org/10.1158/0008-5472.CAN-05-0440 [22] Martiniova, L., Kotys, M.S., Thomasson, D., Schimel, D., Lai, E.W., Bernardo, M., Merino, M.J., Powers, J.F., Ru- zicka, J., Kvetnansky, R., Choyke, P.L. and Pacak, K. (2009) Non-Invasive Monitoring of a Murine Model of Metas- tatic Pheochromocytoma: A Comparison of Contrast Enhanced MicroCT and Non-Enhanced MRI. Journal of Mag- netic Resonance Imaging, 29, 685-691. http://dx.doi.org/10.1002/jmri.21654 [23] Bretschi, M., Franzle, A., Merz, M., Hillengass, J., Semmler, W., Bendl, R. and Bauerle, T. (2014) Assessing Treat- ment Response of Osteolytic Lesions by Manual Volumetry, Automatic Segmentiation, and RECIST in Experimental Bone Metastases. Academic Radiology, 21, 1177-1184. http://dx.doi.org/10.1016/j.acra.2014.04.011 [24] Hajitou, A., Lev, D.C., Hannay, J.A., Korchin, B., Staquicini, F.I., Soqhomonyan, S., Alauddin, M.M., Benjamin, R.S., Pollock, R.E., Gelovani, J.G., Pasqualini, R. and Arap, W. (2008) A Preclinical Model for Predicting Drug Response in Soft-Tissue Sarcoma with Targeted AAVP Molecular Imaging. Proceedings of the National Academic Sciences of the  Y.C.Leeetal. 132 United States of America, 105, 4471-4476. http://dx.doi.org/10.1073/pnas.0712184105 [25] Bao, A., Phillips, W.T., Goins, B., McGuff, H.S., Zheng, X., Woolley, F.R., Natarajan, M., Santoyo, C., Miller, F.R. and Otto, R.A. (2006) Setup and Characterization of a Human Head and Neck Squamous Cell Carcinoma Xenograft Model in Nude Rats. Otolaryngology Head and Neck Surgery, 135, 853-857. http://dx.doi.org/10.1016/j.otohns.2006.06.1257 [26] Bland, J.M. and Altman, D.G. (1986) Statistical Methods for Assessing Agreement between Two Methods of Clinical Measurement. Lancet, 327, 307-310. http://dx.doi.org/10.1016/S0140-6736(86)90837-8 [27] Kersemans, V., Cornelissen, B., Allen, P.D., Beech, J.S. and Smart, S.C. (2013) Subcutaneous Tumor Volume Meas- urement in the Awake, Manually Restrained Mouse Using MRI. Journal of Magnetic Resonance Imaging, 37, 1499- 1504. http://dx.doi.org/10.1002/jmri.23829 [28] Sharma, R. (2009) Microimaging of Hairless Rat Skin by Magnetic Resonance at 900 MHz. Magnetic Resonance Im- aging, 27, 240-255. http://dx.doi.org/10.1016/j.mri.2008.06.013 [29] Kawano, K., Hattori, Y., Iwakura, H., Akanizu, T. and Maitani. Y. (2012) Adrenal Tumor Volume in a Genetically Engineered Mouse Model of Neuroblastoma Determined by Magnetic Resonance Imaging. Experimental and Thera- peutic Medicine, 4, 61-64. http://dx.doi.org/10.3892/etm.2012.564 [30] Abou-Elkacem, L., Gremse, F., Barth, S., Hoffman, R.M., Kiessling, F. and Lederle, W. (2011) Comparison of µCT, MRI and Optical Reflectance Imaging for Accessing the Growth of GFP/RFP-Expressing Tumors. Anticancer Re- search, 31, 2907-2913. [31] Faustino-Rocha, A., Oliveira, P.A., Pinho-Oliveira, J., Teixeira-Guedes, C., Soares-Maia, R., da Costa, R.G., Colaco, B., Pires, M.J., Colaco, J., Ferreira, R. and Ginja, M. (2013) Estimation of Rat Mammary Tumor Volume Using Cali- per and Ultrasonography Measurements. Laboratory Animal, 42, 217-224. http://dx.doi.org/10.1038/laban.254 [32] Hastie, L.A., Graham, K.C., Groom, A.C., MacDonald, I.C., Chambers, A.F., Fenster, A. and Lacefield, J.C. (2004) Variability of Three-Dimensional High-Frequency Ultrasound Measurements of Small Tumor Volumes. Proceedings of IEEE International Ultrasonic Symposium, Vol. 3, Montréal, 23-27 August 2004, 2185-2188. http://dx.doi.org/10.1109/ultsym.2004.1418272 [33] Weber, S.W., Peterson, K.A., Durkee, B., Qi, C., Longino, M., Warner, M., Lee, F.T. and Weichert, J.P. (2004) Imag- ing of Murine Liver Tumor Using MicroCT with a Hepatocyto-Selective Contrast Agent: Accuracy Is Dependent on Adequate Contrast Enhancement. Journal of Surgical Research, 119, 41-45. http://dx.doi.org/10.1016/S0022-4804(03)00357-3 [34] Ohta, S., Lai, E.W., Morris, J.C., Bakan, D.A., Klaunberg, B., Cleary, S., Powers, J.F., Tischler, A.S., Abu-Asab, M., Schimel, S. and Pacak, K. (2006) MicroCT for High-Resolution Imaging of Ectopic Pheochromocytoma Tumors in the Liver of Nude Mice. International Journal of Cancer, 119, 2236-2241. http://dx.doi.org/10.1002/ijc.22127 [35] Boone, J.M., Velazquez, O. and Cherry, S.R. (2004) Small-Animal X-Ray Dose from Micro-CT. Molecular Imaging, 3, 149-158. http://dx.doi.org/10.1162/1535350042380326 [36] Cheung, A.M., Brown, A.S., Hastie, L.A., Cucevic, V., Roy, M., Lacefield, J.C., Fenster, A. and Foster, F.S. (2005) Three-Dimensional Ultrasound Biomicroscopy for Xenograft Growth Analysis. Ultrasound in Medicine and Biology, 31, 856-870. http://dx.doi.org/10.1016/j.ultrasmedbio.2005.03.003
|