Paper Menu >>
Journal Menu >>
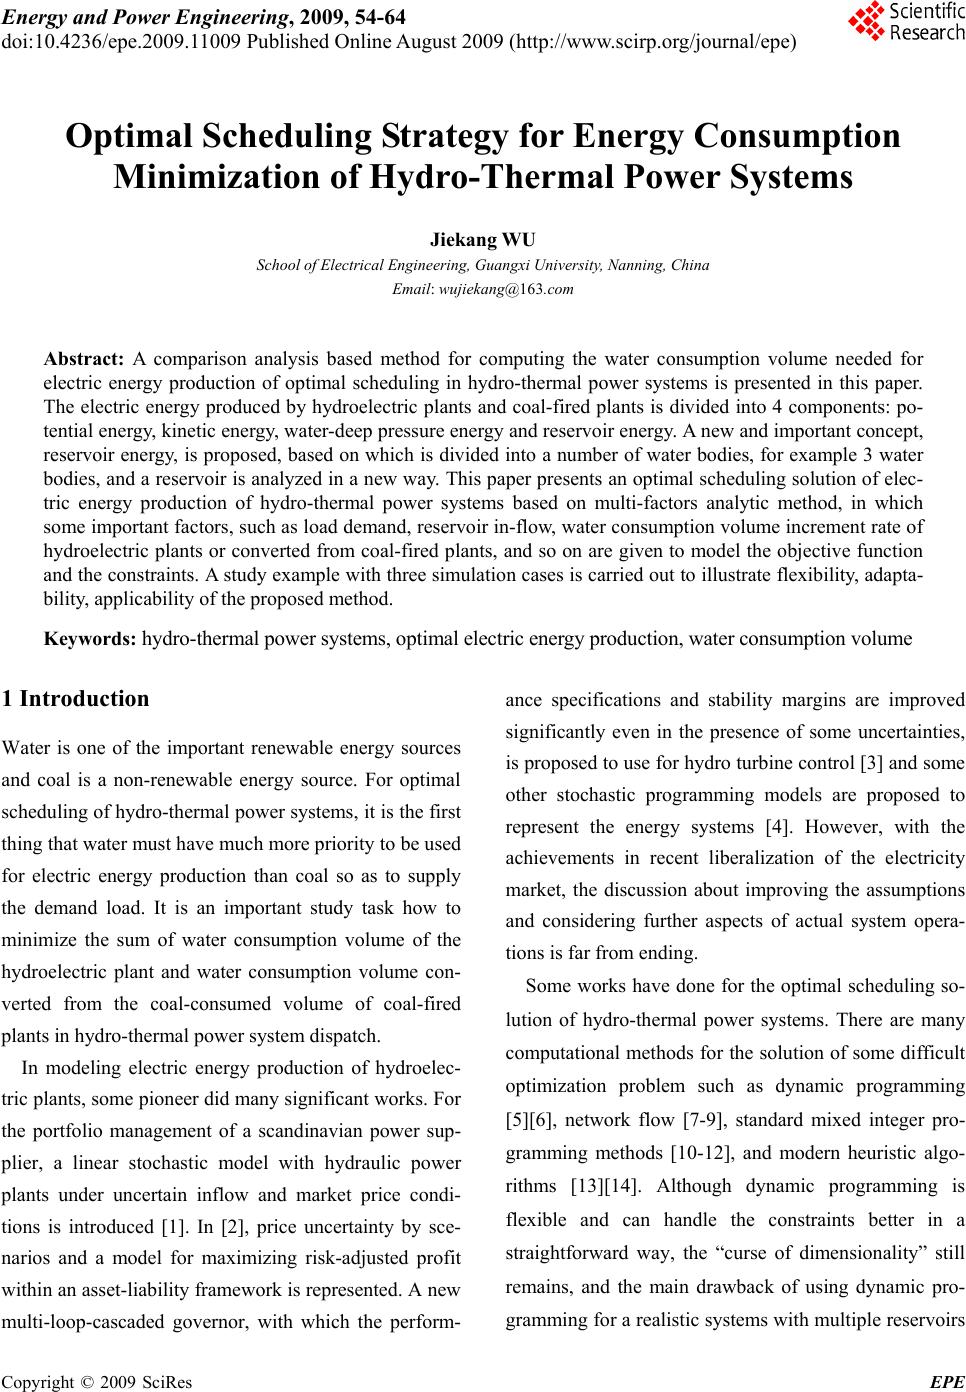 Energy and Power Engineering, 2009, 54-64 doi:10.4236/epe.2009.11009 Published Online August 2009 (http://www.scirp.org/journal/epe) Copyright © 2009 SciRes EPE Optimal Scheduling Strategy for Energy Consumption Minimization of Hydro-Thermal Power Systems Jiekang WU School of Electrical Engineering, Guangxi University, Nanning, China Email: wujiekang@163.com Abstract: A comparison analysis based method for computing the water consumption volume needed for electric energy production of optimal scheduling in hydro-thermal power systems is presented in this paper. The electric energy produced by hydroelectric plants and coal-fired plants is divided into 4 components: po- tential energy, kinetic energy, water-deep pressure energy and reservoir energy. A new and important concept, reservoir energy, is proposed, based on which is divided into a number of water bodies, for example 3 water bodies, and a reservoir is analyzed in a new way. This paper presents an optimal scheduling solution of elec- tric energy production of hydro-thermal power systems based on multi-factors analytic method, in which some important factors, such as load demand, reservoir in-flow, water consumption volume increment rate of hydroelectric plants or converted from coal-fired plants, and so on are given to model the objective function and the constraints. A study example with three simulation cases is carried out to illustrate flexibility, adapta- bility, applicability of the proposed method. Keywords: hydro-thermal power systems, optimal electric energy production, water consumption volume 1 Introduction Water is one of the important renewable energy sources and coal is a non-renewable energy source. For optimal scheduling of hydro-thermal power systems, it is the first thing that water must have much more priority to be used for electric energy production than coal so as to supply the demand load. It is an important study task how to minimize the sum of water consumption volume of the hydroelectric plant and water consumption volume con- verted from the coal-consumed volume of coal-fired plants in hydro-thermal power system dispatch. In modeling electric energy production of hydroelec- tric plants, some pioneer did many significant works. For the portfolio management of a scandinavian power sup- plier, a linear stochastic model with hydraulic power plants under uncertain inflow and market price condi- tions is introduced [1]. In [2], price uncertainty by sce- narios and a model for maximizing risk-adjusted profit within an asset-liability framework is represented. A new multi-loop-cascaded governor, with which the perform- ance specifications and stability margins are improved significantly even in the presence of some uncertainties, is proposed to use for hydro turbine control [3] and some other stochastic programming models are proposed to represent the energy systems [4]. However, with the achievements in recent liberalization of the electricity market, the discussion about improving the assumptions and considering further aspects of actual system opera- tions is far from ending. Some works have done for the optimal scheduling so- lution of hydro-thermal power systems. There are many computational methods for the solution of some difficult optimization problem such as dynamic programming [5][6], network flow [7-9], standard mixed integer pro- gramming methods [10-12], and modern heuristic algo- rithms [13][14]. Although dynamic programming is flexible and can handle the constraints better in a straightforward way, the “curse of dimensionality” still remains, and the main drawback of using dynamic pro- gramming for a realistic systems with multiple reservoirs 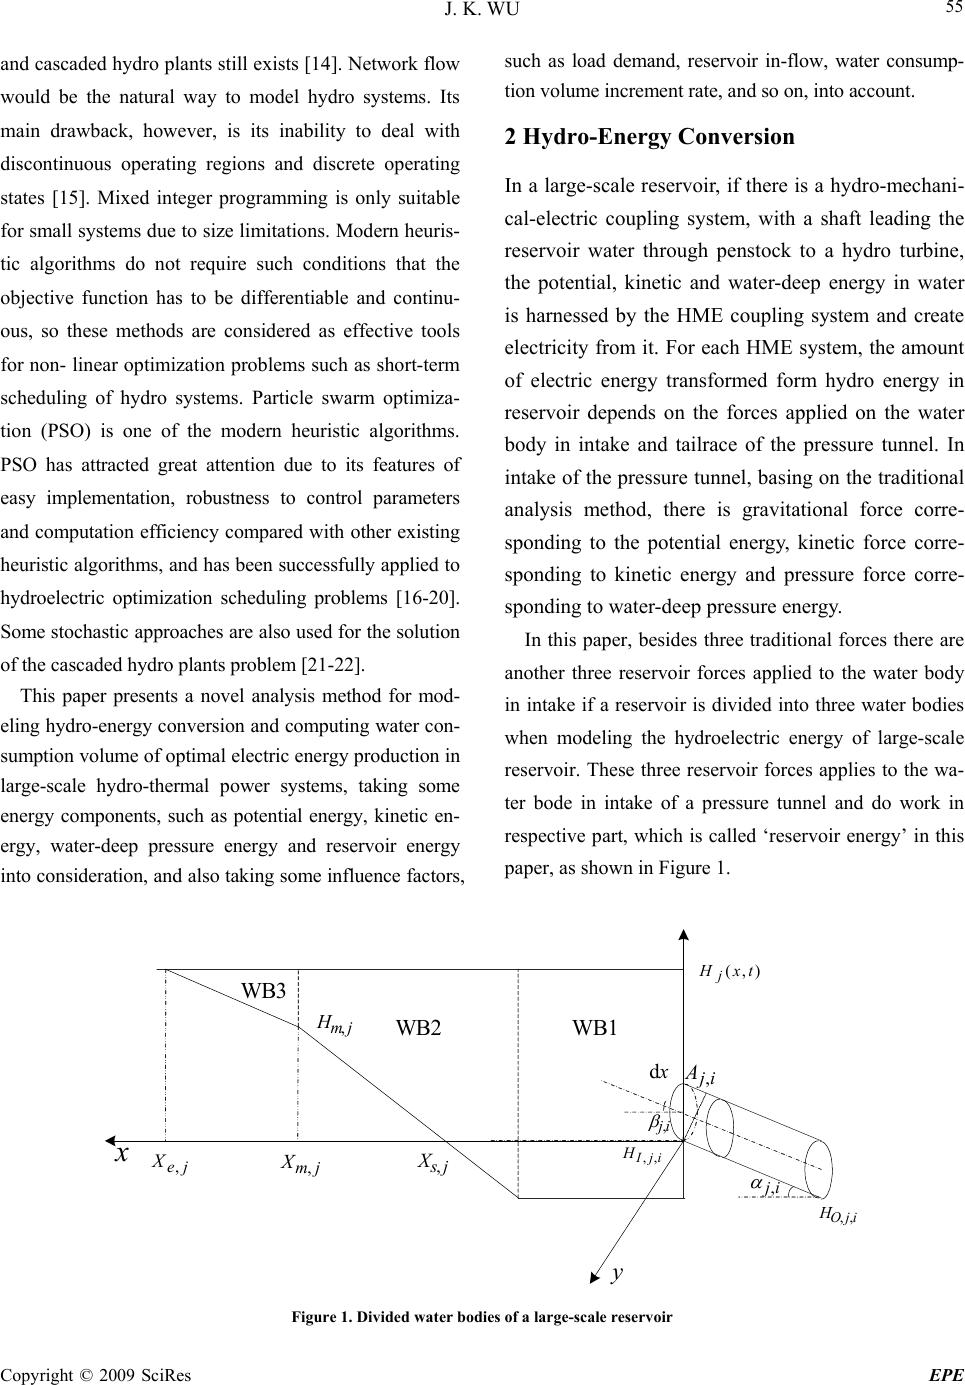 J. K. WU Copyright © 2009 SciRes EPE 55 and cascaded hydro plants still exists [14]. Network flow would be the natural way to model hydro systems. Its main drawback, however, is its inability to deal with discontinuous operating regions and discrete operating states [15]. Mixed integer programming is only suitable for small systems due to size limitations. Modern heuris- tic algorithms do not require such conditions that the objective function has to be differentiable and continu- ous, so these methods are considered as effective tools for non- linear optimization problems such as short-term scheduling of hydro systems. Particle swarm optimiza- tion (PSO) is one of the modern heuristic algorithms. PSO has attracted great attention due to its features of easy implementation, robustness to control parameters and computation efficiency compared with other existing heuristic algorithms, and has been successfully applied to hydroelectric optimization scheduling problems [16-20]. Some stochastic approaches are also used for the solution of the cascaded hydro plants problem [21-22]. This paper presents a novel analysis method for mod- eling hydro-energy conversion and computing water con- sumption volume of optimal electric energy production in large-scale hydro-thermal power systems, taking some energy components, such as potential energy, kinetic en- ergy, water-deep pressure energy and reservoir energy into consideration, and also taking some influence factors, such as load demand, reservoir in-flow, water consump- tion volume increment rate, and so on, into account. 2 Hydro-Energy Conversion In a large-scale reservoir, if there is a hydro-mechani- cal-electric coupling system, with a shaft leading the reservoir water through penstock to a hydro turbine, the potential, kinetic and water-deep energy in water is harnessed by the HME coupling system and create electricity from it. For each HME system, the amount of electric energy transformed form hydro energy in reservoir depends on the forces applied on the water body in intake and tailrace of the pressure tunnel. In intake of the pressure tunnel, basing on the traditional analysis method, there is gravitational force corre- sponding to the potential energy, kinetic force corre- sponding to kinetic energy and pressure force corre- sponding to water-deep pressure energy. In this paper, besides three traditional forces there are another three reservoir forces applied to the water body in intake if a reservoir is divided into three water bodies when modeling the hydroelectric energy of large-scale reservoir. These three reservoir forces applies to the wa- ter bode in intake of a pressure tunnel and do work in respective part, which is called ‘reservoir energy’ in this paper, as shown in Figure 1. ),( txH j ij, ijO H,, xdij A, ijI H,, ij, x y js X, jm X, je X, jm H,WB1WB2 WB3 Figure 1. Divided water bodies of a large-scale reservoir 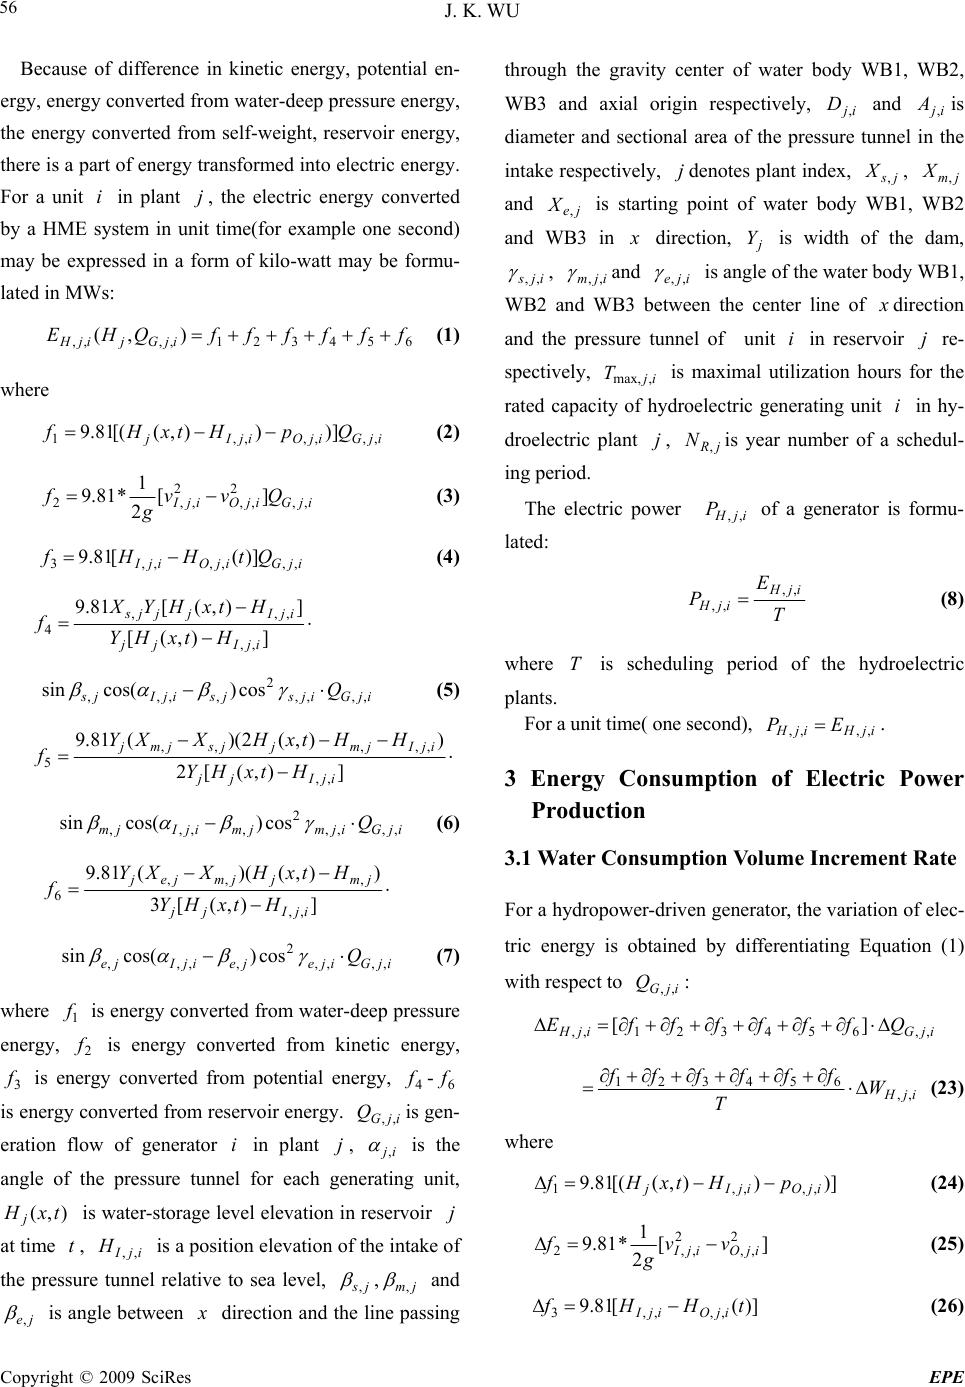 J. K. WU Copyright © 2009 SciRes EPE 56 Because of difference in kinetic energy, potential en- ergy, energy converted from water-deep pressure energy, the energy converted from self-weight, reservoir energy, there is a part of energy transformed into electric energy. For a unit in plant , the electric energy converted by a HME system in unit time(for example one second) may be expressed in a form of kilo-watt may be formu- lated in MWs: ij 654321,,,, ),( ffffffQHE ijGjijH (1) where ijGijOijIj QpHtxHf ,,,,,,1 ]))),([(81.9 (2) ijGijOijI Qvv g f,, 2 ,, 2 ,,2 ][ 2 1 *81.9 (3) ijGijOijI QtHHf ,,,,,,3 )]([81.9 (4) ]),([ ]),([81.9 ,, ,,, 4 ijIjj ijIjjjs HtxHY HtxHYX f ijGijsjsijIjs Q,,,, 2 ,,,, cos)cos(sin (5) ]),([2 )),(2)((81.9 ,, ,,,,, 5 ijIjj ijIjmjjsjmj HtxHY HHtxHXXY f ijGijmjmijIjmQ,,,, 2 ,,,, cos)cos(sin (6) ]),([3 )),()((81.9 ,, ,,, 6 ijIjj jmjjmjej HtxHY HtxHXXY f ijGijejeijIjeQ,,,, 2 ,,,, cos)cos(sin (7) where is energy converted from water-deep pressure energy, is energy converted from kinetic energy, is energy converted from potential energy, - is energy converted from reservoir energy. is gen- eration flow of generator in plant , 1 f f2 3 f4 f i 6 f jG Q,, ij, i j is the angle of the pressure tunnel for each generating unit, is water-storage level elevation in reservoir at time )t,(xH jj t , is a position elevation of the intake of the pressure tunnel relative to sea level, ijI H,, js, ,jm, and je, is angle between x direction and the line passing through the gravity center of water body WB1, WB2, WB3 and axial origin respectively, and is diameter and sectional area of the pressure tunnel in the intake respectively, denotes plant index, , and is starting point of water body WB1, WB2 and WB3 in ij D,ij A, m X, jjs X,j je X, x direction, is width of the dam, j Y i,js, , ij,m, and ije ,, is angle of the water body WB1, WB2 and WB3 between the center line of x direction and the pressure tunnel of unit in reservoir re- spectively, is maximal utilization hours for the rated capacity of hydroelectric generating unit i in hy- droelectric plant j, N year number of a schedul- ing period. ij ij,max, T jR,i H P, s The electric power of a generator is formu- lated: i,j T E Pij,,H ijH ,, (8) where T is scheduling period of the hydroelectric plants. For a unit time( one second), . i, Q jH E, f6] ijH ,, f P f4 3 Energy Consumption of Electric Power Production 3.1 Water Consumption Volume Increment Rate For a hydropower-driven generator, the variation of elec- tric energy is obtained by differentiating Equation (1) with respect to : ij, f2 G, Q f1ijG ,,ijH E,, f3 5 [ ijH W T f6 ]) i f5 ,O p f4 ) ,ij ff 2 (x f 81. ,, 3 I H 1 [( ),t j H 9 1 f (23) where ,,j (24) ] ,,ij )]t [i ,ij 2 1 *g , HI 81. [81 9 2 f .9 3 f 2 O 2 ,, jI v H v ,, ijO (25) ( (26) 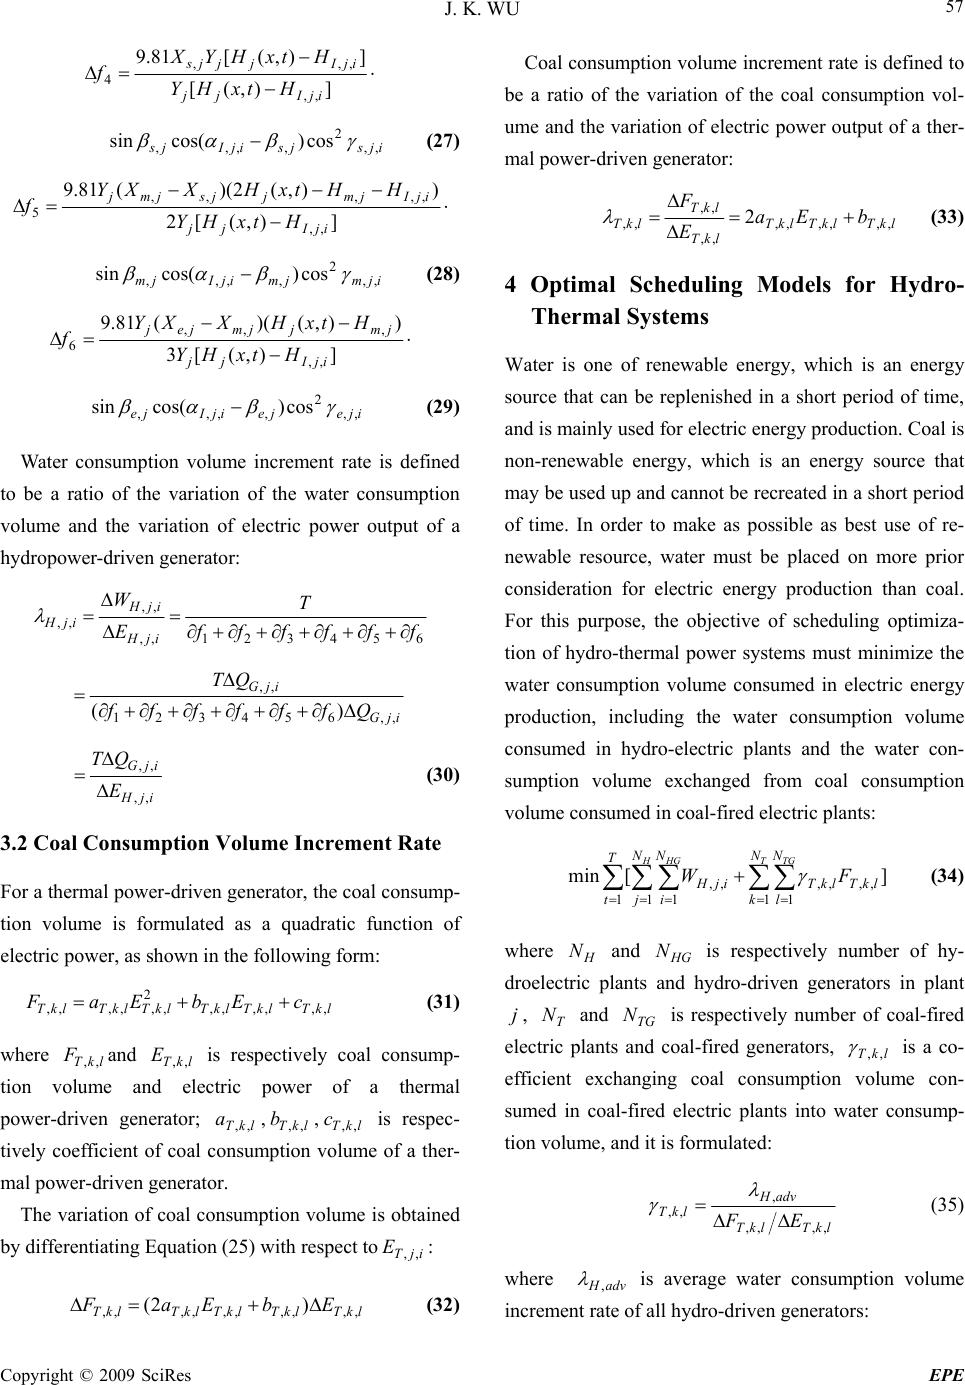 J. K. WU Copyright © 2009 SciRes EPE 57 ]),([ ]),([81.9 ,, ,,, 4 ijIjj ijIjjjs HtxHY HtxHYX f ijsjsijIjs ,, 2 ,,,, cos)cos(sin (27) ]),([2 )),(2)((81.9 ,, ,,,,, 5 ijIjj ijIjmjjsjmj HtxHY HHtxHXXY f ijmjmijIjm ,, 2 ,,,, cos)cos(sin (28) ]),([3 )),()((81.9 ,, ,,, 6 ijIjj jmjjmjej HtxHY HtxHXXY f ijejeijIje ,, 2 ,,,, cos)cos(sin (29) Water consumption volume increment rate is defined to be a ratio of the variation of the water consumption volume and the variation of electric power output of a hydropower-driven generator: 654321,, ,, ,, ffffff T E W ijH ijH ijH ijG ijG Qffffff QT ,,654321 ,, )( ijH ijG E QT ,, ,, (30) 3.2 Coal Consumption Volume Increment Rate For a thermal power-driven generator, the coal consump- tion volume is formulated as a quadratic function of electric power, as shown in the following form: lkTlkTlkTlkTlkTlkT cEbEaF ,,,,,, 2 ,,,,,, (31) where and is respectively coal consump- tion volume and electric power of a thermal power-driven generator; ,, is respec- tively coefficient of coal consumption volume of a ther- mal power-driven generator. lkT F,, lkT E,, lkT a,, lkT b,, lkT c,, The variation of coal consumption volume is obtained by differentiating Equation (25) with respect to: ijT E,, lkTlkTlkTlkTlkT EbEaF ,,,,,,,,,, )2( (32) Coal consumption volume increment rate is defined to be a ratio of the variation of the coal consumption vol- ume and the variation of electric power output of a ther- mal power-driven generator: lkTlkTlkT lkT lkT lkT bEa E F ,,,,,, ,, ,, ,, 2 (33) 4 Optimal Scheduling Models for Hydro- Thermal Systems Water is one of renewable energy, which is an energy source that can be replenished in a short period of time, and is mainly used for electric energy production. Coal is non-renewable energy, which is an energy source that may be used up and cannot be recreated in a short period of time. In order to make as possible as best use of re- newable resource, water must be placed on more prior consideration for electric energy production than coal. For this purpose, the objective of scheduling optimiza- tion of hydro-thermal power systems must minimize the water consumption volume consumed in electric energy production, including the water consumption volume consumed in hydro-electric plants and the water con- sumption volume exchanged from coal consumption volume consumed in coal-fired electric plants: ][min 11 ,,,, 111 ,, TTG HHG N k N l lkTlkT T t N j N i ijH FW (34) where and is respectively number of hy- droelectric plants and hydro-driven generators in plant , and is respectively number of coal-fired electric plants and coal-fired generators, H N T HG N TG jN N lkT ,, is a co- efficient exchanging coal consumption volume con- sumed in coal-fired electric plants into water consump- tion volume, and it is formulated: lkTlkT advH lkT EF ,,,, , ,, (35) where advH, is average water consumption volume increment rate of all hydro-driven generators: 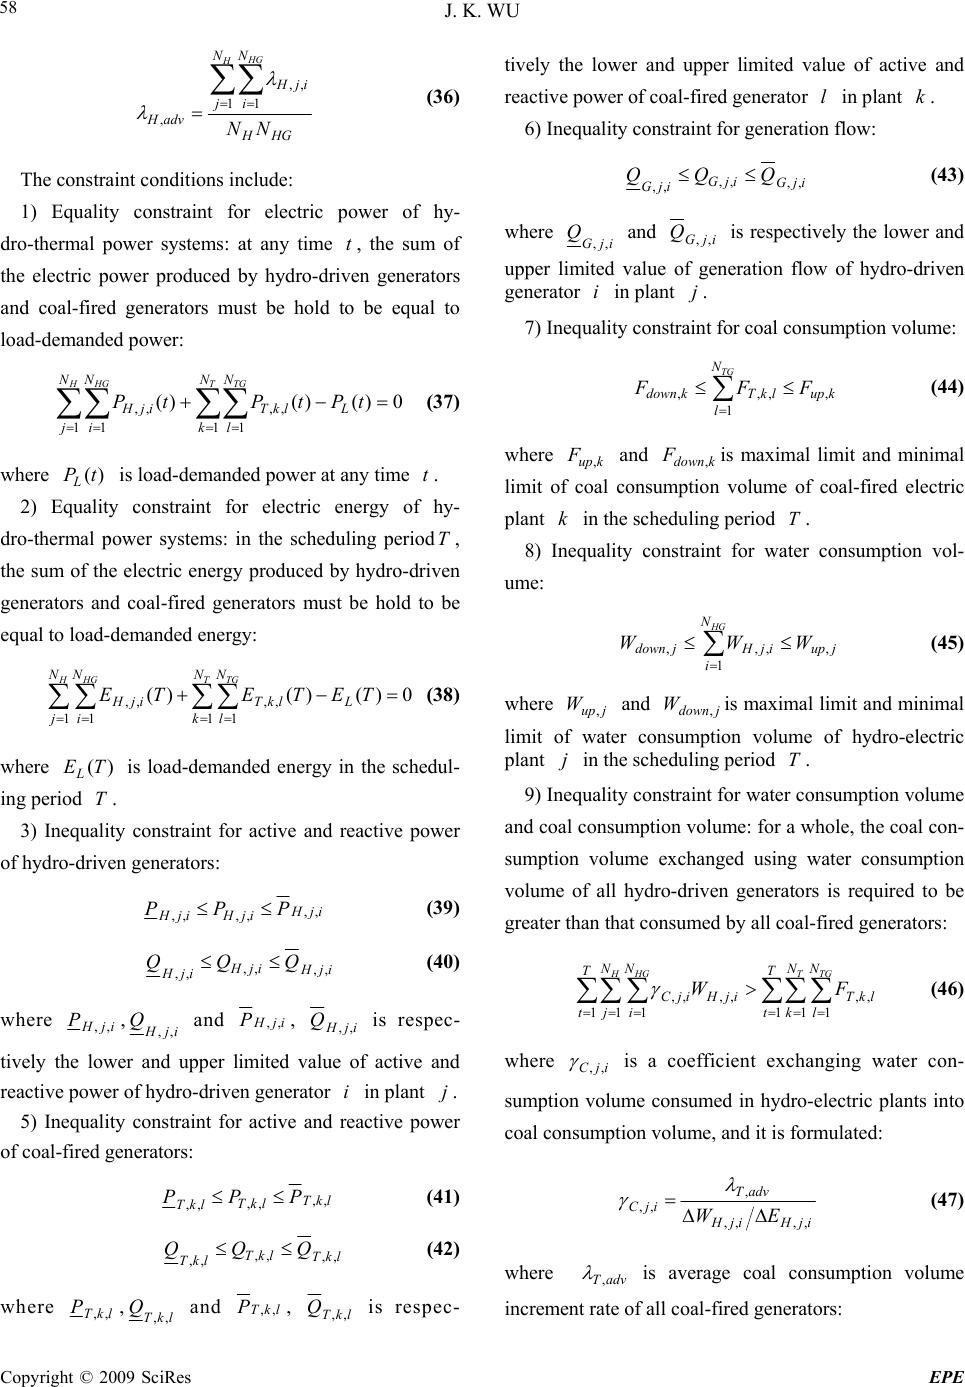 J. K. WU Copyright © 2009 SciRes EPE 58 HGH N j N i ijH advH NN HHG 11 ,, , (36) The constraint conditions include: 1) Equality constraint for electric power of hy- dro-thermal power systems: at any time t , the sum of the electric power produced by hydro-driven generators and coal-fired generators must be hold to be equal to load-demanded power: 0)()()( 11 ,, 11 ,, tPtPtP L N k N l lkT N j N i ijH TTG HHG (37) where is load-demanded power at any time )(tPL t . 2) Equality constraint for electric energy of hy- dro-thermal power systems: in the scheduling period T , the sum of the electric energy produced by hydro-driven generators and coal-fired generators must be hold to be equal to load-demanded energy: 0)()()( 11 ,, 11 ,, TETETE L N k N l lkT N j N i ijH TTG HHG (38) where is load-demanded energy in the schedul- ing period )(TE L T . 3) Inequality constraint for active and reactive power of hydro-driven generators: ijH ijH ijH PPP ,, ,, ,, (39) ijH ijH ijH QQQ ,, ,, ,, (40) where ijH P,, ,ijH Q,, and ijH P,, , ijH Q,, is respec- tively the lower and upper limited value of active and reactive power of hydro-driven generator in plant . ij 5) Inequality constraint for active and reactive power of coal-fired generators: lkT lkT lkT PPP ,, ,, ,, (41) lkT lkT lkT QQQ,, ,, ,, (42) is respec- e low and imitealue otively therupper ld vf active and where lkT P,,,lkT Q,, reactive power of coal-fired generator l in plant k. 6) Inequality constraint for generation flow: ijG ijG ijG QQQ ,, ,, ,, (43) where and ijG Q,, ijG Q,, is respectively imited value of ge r in where and is maximal limit and minimal ption vol- um (45) where and is maximal limit and minimal the lower and upper lneration flow of hydro-driven generato plant 7) Inequality constraint for coal consumption volume: ij. kup l lkTkdown FFF , 1 ,,, NTG (44) kup F,kdown F, mptionlimit of coal consu volume of coal-fired electric plant k in the scheduling period T. 8) Inequality constraint for water consum e: jup N i ijHjdown WWW HG , 1 ,,, jup W, f wat j in th jdown W, sumpti duling limit oer conon volume of hydro-electric plant e scheperiod T . 9) Inequality constraint for wateronsumption volume c an (46) where d coal consumption volume: for a whole, the coal con- sumption volume exchanged using water consumption volume of all hydro-driven generators is required to be greater than that consumed by all coal-fired generators: TNN TNNTTG HHG t kl lkT t j i ijHijC FW 111 ,, 111 ,,,, ijC,, is a coefficient exchanging water con- n volsumptioume consumed in hydro-electric plants into coal consumption volume, and it is formulated: ijHijH advT ijC EW ,,,, , ,, (47) where advT , is average coal consumption volume rate oincrementf all coal-fired generators: and lkT P,, , lkT Q,, 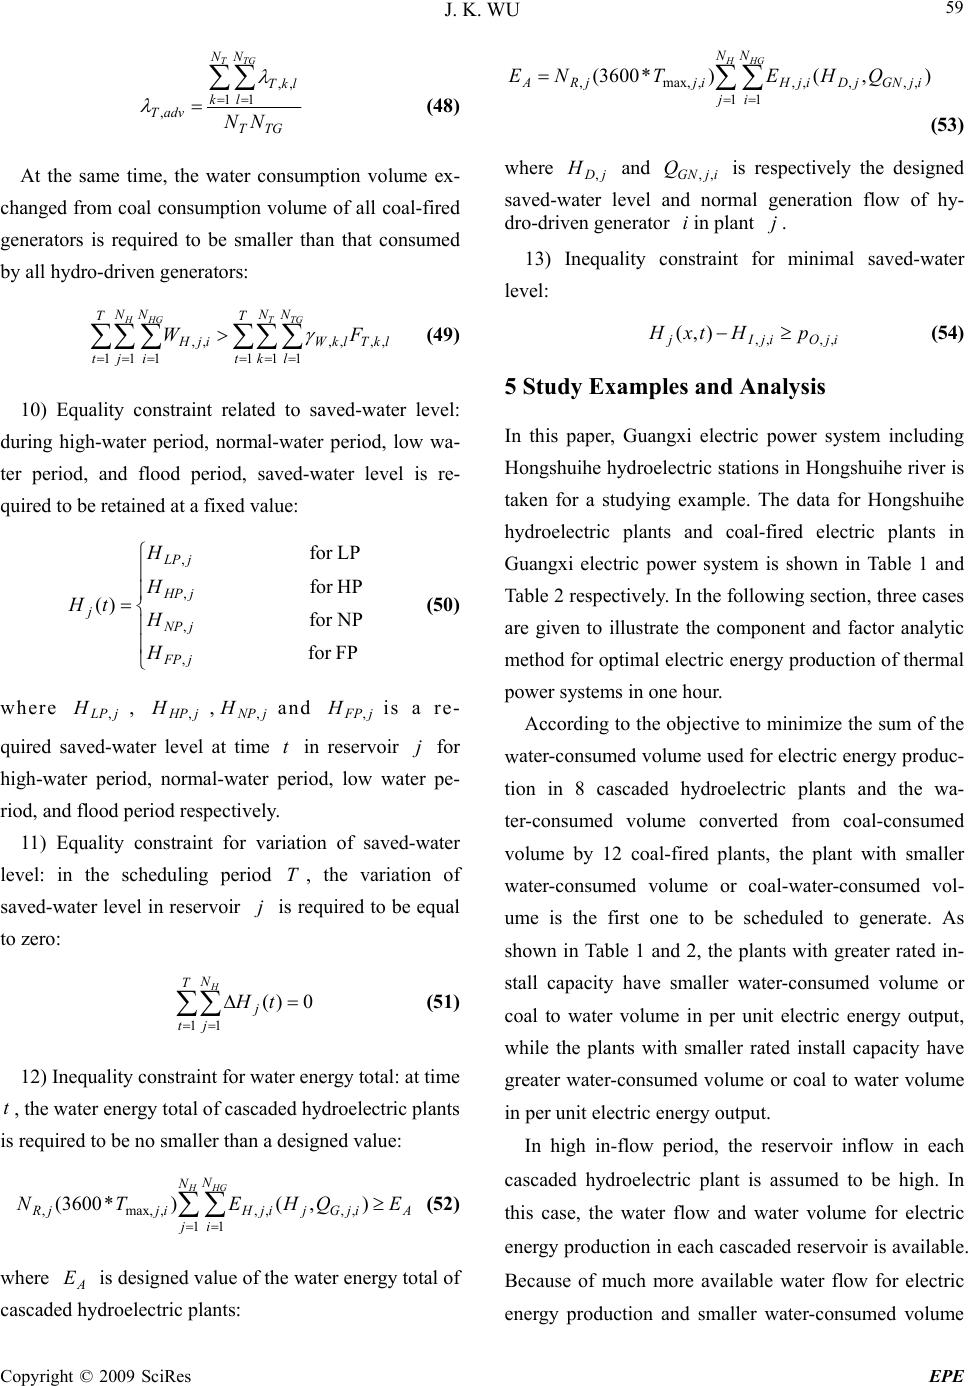 J. K. WU Copyright © 2009 SciRes EPE 59 TGT NN lkT TTG ,, k l advT NN 11 , (48) At the same time, the water consumption volume ex- ch (49) 10) Equality constraint related to saved-water level: du (50) where , and is a re- aved-wr levelt time anged from coal consumption volume of all coal-fired generators is required to be smaller than that consumed by all hydro-driven generators: TTNN HHG t N k N l lkTlkW tji ijH TTG FW 111 ,,,, 111 ,, ring high-water period, normal-water period, low wa- ter period, and flood period, saved-water level is re- quired to be retained at a fixed value: fo H FPfor NPfor HPfor LPr )( , , , , jFP jNP jHP jLP j H H H tH jLP H,jHP H,,jNP H,jFP H, quired sate a t in ir j for reservo tion of saved-water le high-water period, normal-water period, low water pe- riod, and flood period respectively. 11) Equality constraint for varia vel: in the scheduling period T , the variation of saved-water level in reservoir j is required to be equal to zero: 0)( 11 T t N j j H tH (51) 12) Inequality constraint for water energy total: at time t , the water energy total of cascaded hydroelectric plants required to be no smaller than a designed value: NN HHG is (52) where is designed value of the water energy total of d h (53) where and is respectively the des nr inimal saved-water le A j i ijGjijHijjR EQHETN 11 ,,,,,max,, ),()*3600( A E cascadeydroelectric plants: HHG NN TNE)*3600( j i ijGNjDijHijjRAQHE 11 ,,,,,,max,, ),( jD H, er ijGN Q,, nd no igned saved-watlevel armal generation flow of hy- dro-driven generator iin plant j. 13) Inequality costraint fom vel: ijOijIjpHtxH ,,,, ),( (54) 5 Study Examples and Analysis stem including minimize the sum of the w ervoir inflow in each ca In this paper, Guangxi electric power sy Hongshuihe hydroelectric stations in Hongshuihe river is taken for a studying example. The data for Hongshuihe hydroelectric plants and coal-fired electric plants in Guangxi electric power system is shown in Table 1 and Table 2 respectively. In the following section, three cases are given to illustrate the component and factor analytic method for optimal electric energy production of thermal power systems in one hour. According to the objective to ater-consumed volume used for electric energy produc- tion in 8 cascaded hydroelectric plants and the wa- ter-consumed volume converted from coal-consumed volume by 12 coal-fired plants, the plant with smaller water-consumed volume or coal-water-consumed vol- ume is the first one to be scheduled to generate. As shown in Table 1 and 2, the plants with greater rated in- stall capacity have smaller water-consumed volume or coal to water volume in per unit electric energy output, while the plants with smaller rated install capacity have greater water-consumed volume or coal to water volume in per unit electric energy output. In high in-flow period, the res scaded hydroelectric plant is assumed to be high. In this case, the water flow and water volume for electric energy production in each cascaded reservoir is available. Because of much more available water flow for electric energy production and smaller water-consumed volume 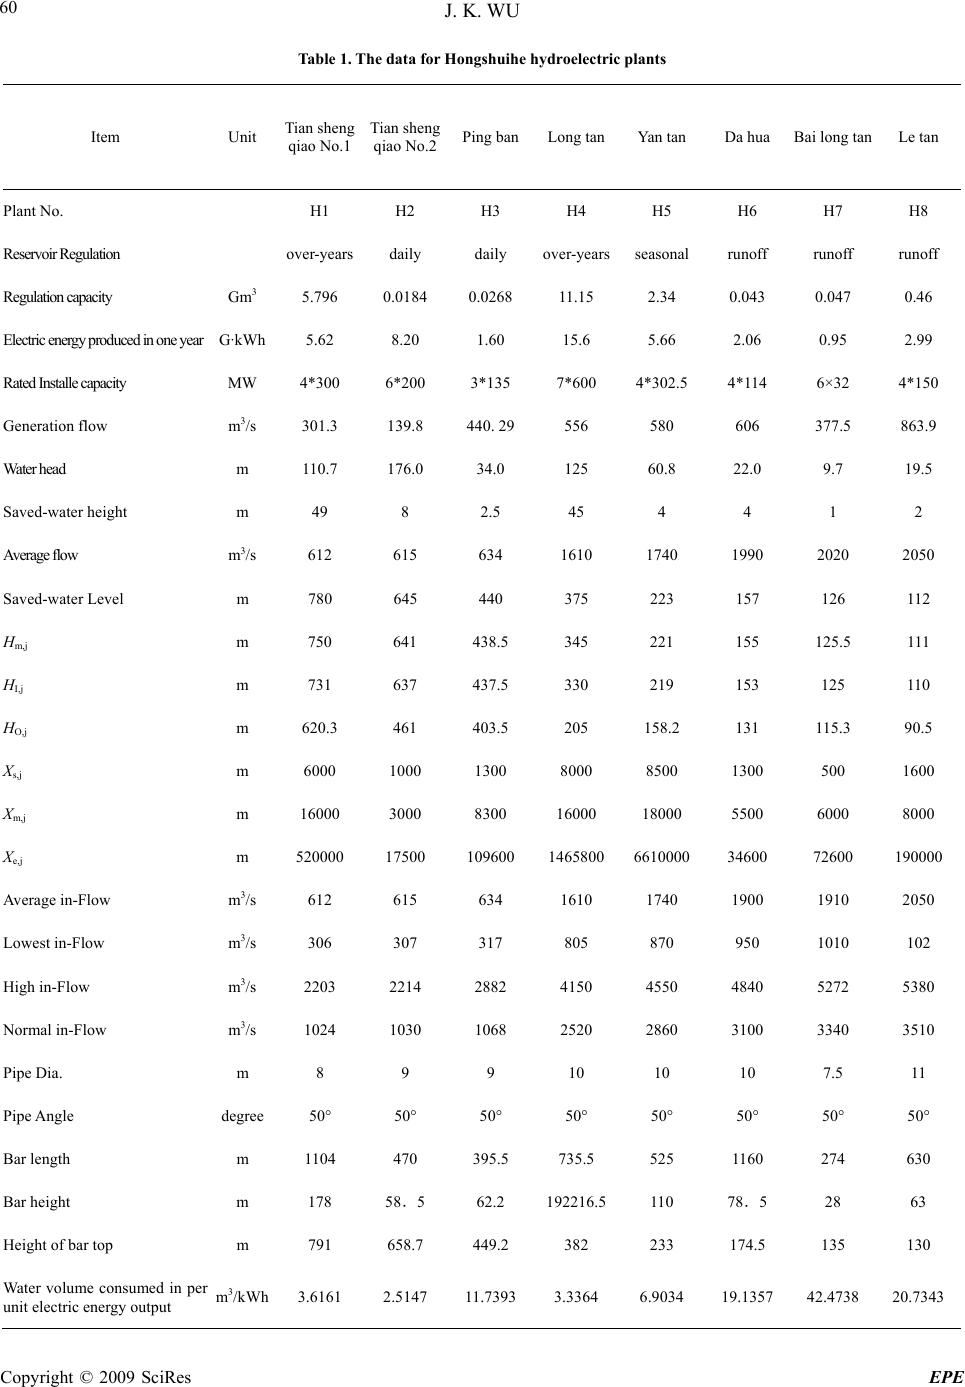 J. K. WU Copyright © 2009 SciRes EPE 60 gshu he hydroelectric plants Item Unit Tian sheng Tian sheng Ping banLong tanYan tan Da hua Bai long tanLe tan Table 1. The data for Honi qiao No.1 qiao No.2 Plant No. H1 H2 H3 H4 H5 H6 H7 H8 Reservoir Regulation overars daily daily overarsseasonalrunof runof runof G3 5.0.0. uced in one year G·kW 4*306*203*137*604*305 4*1 6×32 4*15 440. m612 615 1610 1740 1990 2020 2050 Level m,j 438. 125. I,j O,j 620. 1 s,j 1000 8000 8500 1300 m,j 1600160018006000 e,j 52001465 661034601900 m 2203 2214 2882 4150 4550 4840 5380 degr50° 50° 50° 50° 50° 1395. 735.1 58 578 top 449.135 130 med in per unit electric energy output m3/kWh 3.6161 2.5147 11.7393 3.3364 6.9034 19.1357 42.4738 20.7343 -ye-yefff Regulation capacity m796 0184 0268 11.15 2.34 0.043 0.047 0.46 Electric energy prodh 5.62 8.20 1.60 15.6 5.66 2.06 0.95 2.99 Rated Installe capacity MW 0 0 5 0 2.140 Generation flow m3/s 301.3 139.8 29 556 580 606 377.5 863.9 Water head m 110.7 176.0 34.0 125 60.8 22.0 9.7 19.5 Saved-water height m 49 8 2.5 45 4 4 1 2 Average flow 3/s 634 Saved-water m 780 645 440 375 223 157 126 112 H m 750 641 5 345 221 155 5 111 H m 731 637 437.5 330 219 153 125 110 H m 3 461 403.5 205 158.2 131 15.3 90.5 X m 6000 1300 500 1600 Xm 0 3000 8300 0 0 5500 8000 X m 00 17500 109600 8000000 72600 00 Average in-Flow3/s 612 615 634 1610 1740 1900 1910 2050 Lowest in-Flow m3/s 306 307 317 805 870 950 1010 102 High in-Flow m3/s 5272 Normal in-Flow m3/s 1024 1030 1068 2520 2860 3100 3340 3510 Pipe Dia. m 8 9 9 10 10 10 7.5 11 Pipe Angle ee 50° 50° 50° Bar length m 104 470 5 5 525 160 274 630 Bar height m 178 .5 62.2 192216.110 .5 28 63 Height of barm 791 658.7 2 382 233 174.5 Water volume consu 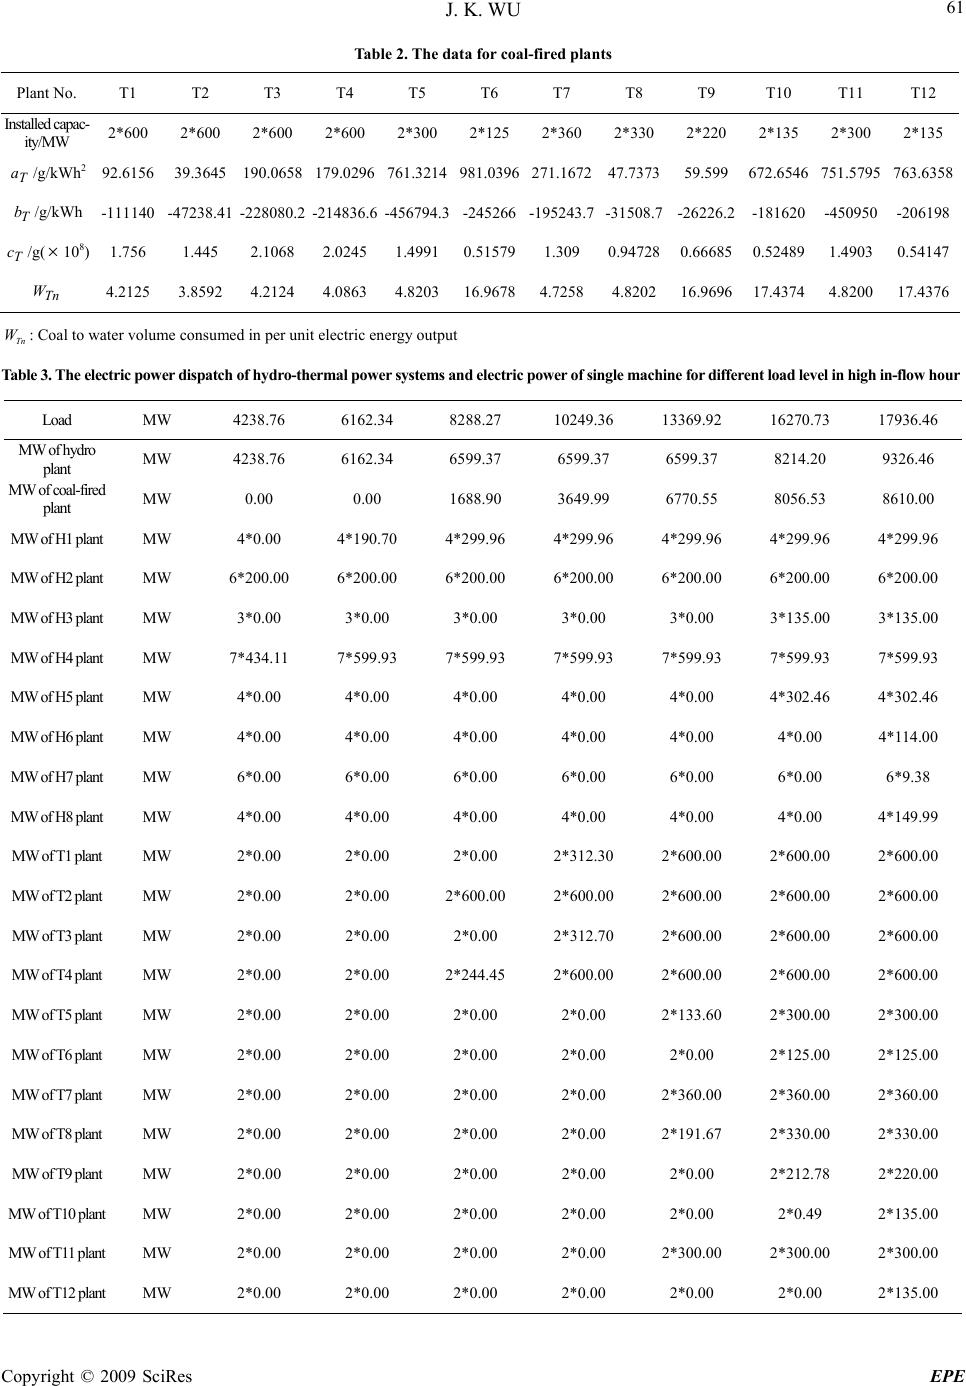 J. K. WU Copyright © 2009 SciRes EPE 61 Table 2. The data for coal-fired plants T2 T3 T4 T5 T6 T7 T8 T9 T10 T11 T12 Plant No. T1 Installed capac-2*600 2*600 2*600 2*600 2*300 2*125 2*360 2*330 2*220 2*135 2*300 2*135 ity/MW T a/g/kWh T/g/kW 292.6156 39.3645 190.0658 179.0296 761.3214 981.0396 271.167247.737359.599672.6546 751.5795 763.6358 h -111140 -47238.41 -228080.2 -214836.6 -456794.3-245266-195243.7-31508.7-26226.2 -181620 -450950-206198 /g( 1.756 1.445 2.1068 2.0245 1.49910.515791.309 0.947280.66685 0.52489 1.49030.54147 b T c108) Tn W 4.2125 3.8592 4.2124 4.0863 4.820316.96784.7258 4.820216.9696 17.4374 4.820017.4376 Tn W: Coal to water volume consumed in per unit electric energy output Table 3. The electric power dispatch of hydro-thermal power systems and electric power of single machine for different load level in high in-flow hour Load MW 4238.76 6162.34 8288.27 10249.36 13369.92 16270.73 17936.46 MW of hydro MW 4238.76 6162.34 6599.37 6599.37 6599.37 8214.20 9326.46 plant MW o MW 0.00 0.00 1688.90 3649.99 6770.55 8056.53 8610.00 MW 4*0.00 4*190.70 4*299.96 4*299.96 4*299.96 4*299.96 4*299.96 MWlant MW 6*200.00 6*200.00 6*200.00 6*200.00 6*200.00 6*200.00 6*200.00 MW of H5 plant MW 4*0.00 4*0.00 4*0.00 4*0.00 4*0.00 4*302.46 4*302.46 MW of H6 plant MW 4*0.00 4*0.00 4*0.00 4*0.00 4*0.00 4*0.00 4*114.00 MW of H7 plant MW 6*0.00 6*0.00 6*0.00 6*0.00 6*0.00 6*0.00 6*9.38 MW of H8 plant MW 4*0.00 4*0.00 4*0.00 4*0.00 4*0.00 4*0.00 4*149.99 MW of T1 plant MW 2*0.00 2*0.00 2*0.00 2*312.30 2*600.00 2*600.00 2*600.00 2*60 2*60 MW of T4 plant MW 2*0.00 2*0.00 2*244.45 2*600.00 2*600.00 2*600.00 2*600.00 MW of T5 plant MW 2*0.00 2*0.00 2*0.00 2*0.00 2*133.60 2*300.00 2*300.00 MW of T6 plant MW 2*0.00 2*0.00 2*0.00 2*0.00 2*0.00 2*125.00 2*125.00 MW of T7 plant MW 2*0.00 2*0.00 2*0.00 2*0.00 2*360.00 2*360.00 2*360.00 MW of T8 plant MW 2*0.00 2*0.00 2*0.00 2*0.00 2*191.67 2*330.00 2*330.00 MW of T10 plant MW 2*0.00 2*0.00 2*0.00 2*0.00 2*0.00 2*0.49 2*135.00 MW of T11 plant MW 2*0.00 2*0.00 2*0.00 2*0.00 2*300.00 2*300.00 2*300.00 MW of T12 plant MW 2*0.002*0.00 2*0.00 2*0.002*0.00 2*0.002*135.00 f coal-fired plant of H1 pMWlant of H2 p MW of H3 plant MW 3*0.00 3*0.00 3*0.00 3*0.00 3*0.00 3*135.00 3*135.00 MW of H4 plant MW 7*434.11 7*599.93 7*599.93 7*599.93 7*599.93 7*599.93 7*599.93 MW of T2 plant MW 2*0.00 2*0.00 0.00 2*600.00 0.00 2*600.00 2*600.00 MW of T3 plant MW 2*0.00 2*0.00 2*0.00 2*312.70 2*600.00 2*600.00 2*600.00 MW of T9 plant MW 2*0.00 2*0.00 2*0.00 2*0.00 2*0.00 2*212.78 2*220.00  J. K. WU Copyright © 2009 SciRes EPE 62 Tc energy productioo-thermr systems and energy comp hydro plantferent in high in-flowr d M6162.31092 0.73 17 able 4. The electrin of hydral poweonent ofs for dif load level hou LoaW4 249.36 13369.1627 936.46 Electric energy produced in T kWh6162340.00 10249360.00 13369920.00 16270730.00 17936460.00 T E/percege 6162340.0.00659939 659936 821448 932600 16770480562 86100 Share of in ntage Share of in ntage 2176 Share of in 6 7 nta kWh00/10366.45/64. 366.45/49.200.36/50. 460.00/52. G E/percentage kWh0.00/0.00 3649993.55/35.6553.55/50.6529.64/49.5000.00/48.0 1 fG E/perce kWh176170.75/2.8588 185478.51/2.8106185478.51/2.8106240112.90/2.9231 365469.36/3.9186 2 fG E/perce kWh3.80/0.3532 24708.59/0.3744 24708.59/0.3744 45305.26/0.5515 82046.25/0.8797 Share of in /percentage 3 fG EkWh5265952.61/85.453 5609409.21/84.999 5609409.21/84.9997141210.74/86.937 8078269.18/86.616 46 /perage f+ G 5 f+ cent f EkWh98452.84/11.334279770.13/11.8158 779770.13/11.8158787571.45/9.5879 800675.21/8.5850 in py output, the hydroelectric plants have muchperiori r el energy production than coal-fired plants when the load is ifferent load level in high in-flow ho With increase in load, the percentage shared by hy- increase ic plants take 100% and coal-fired plants takes 0. er unit electric energ more suty to be scheduled foectric droelectric plants s, while the percentage smaller. For example, when the load is 4238.76MW, the hydroelectric plant H2 is first in full power output, and plant H4 is for the remainder of the load; when the load is 6162.34MW, H2 and H4 is first in full power output, and H1 is for the remainder of the load, as shown in Ta- ble 3. With increases in the load, the coal-fired plants with smaller coal-water consumption volume are also gradually put into schedule for electric energy produc- tion till the load arrives at the sum of the rated install capacity of all hydroelectric and coal-fired plants, as shown in Table 3. Table 4 shows the electric energy production of hy- dro-thermal power systems and energy component of hydro plants for d ur. When the load is small, higher percentage of electric energy production is shared by hydroelectric plants than coal-fired plants, while lower percentage is shared by hydroelectric plants than coal-fired plants, as shown in Table 4. With increase in load, the percent- age shared by hydroelectric plants increases, while the percentage shared by coal-fired plants decreases, as shown in Figure 2 and Figure 3. It is also seen that for a load of about 7000MW of load, hydroelectric plants take 100% and coal-fired plants takes 0. shared by coal-fired plants decreases, as shown in Figure 2 and Figure 3. It is also seen that for small than about 7000MW of load, hydroelectr 00.5 11.5 2 x 10 4 40 50 60 70 80 90 100 Load/MW. share of HE/% igure 2. Sharing percentage of electric energy produced by hydro plants (HE: Electric energy produced by hydro plants) F 00.5 11.5 2 60 x 10 4 0 10 20 30 40 50 Load/MW . Figure 3. Sharing percentage of electric energy pr share of TE/% oduced by coal-fired plants(TE: Electric energy produced by hydro plants) 00.5 11.5 2 x 10 4 1.5 4 2 2.5 3 3.5 Load/M W. share of DE/% Figure 4. Sharing percentage of electric energy converted from water-deep pressure energy (DE: Electric energy converted from water-deep pressure energy)  J. K. WU Copyright © 2009 SciRes EPE 63 00.5 11.5 2 x 10 4 0 0.2 0.4 0.6 0.8 1 Load/M W. share of KE/% Figure 5. Sharing percentage of electric energy coerted from nv kinetic energy (KE: Electric energy converted from kinetic energy) 00.5 11.5 2 x 10 4 80 85 90 95 100 Load/MW. share of PE/% Figure 6. Sharing percentage of electric energy coom nverted fr potential energy (PE: Electric energy converted from potential energy) 00.5 11.5 2 x 10 4 0 2 4 6 8 10 12 Load/M W. share of RE/% Figure 7. Sharing percentage of electric energy converted from reservoir energy (RE: Electric energy converted from reservoir energy) 00.5 11.5 2 x 10 4 0 2 4 6 8 Load/MW. share of WB1E/% Figure 8. Sharing percentage of electric energy converted from reservoir energy in WB1 (WB1E: Electric energy converted from reservoir energy in WB1) 00.5 11.5 2 x 10 4 0 0.5 1 1.5 2 2.5 Load/MW. share of WB2E/% Figure 9. Sharing percentage of electric energy converted from reservoir energy in W 00.5 11.5 2 x 10 4 0 1 2 3 4 Load/MW. share of WB3E/% Figure 10. Sharing percentage of electric energy converted from then decreases, as shown in Figure 7. It is also seen th body WB1, WB2 and WB3 included in the total electric energy produced by hydroelectric plants all increases, but retains constant from 7000MW to 14000MW, as shown in Figure 8-Figure 10. 1) Optimal scheduling for electric energy production of eservoir, and so on. The plant with low w ydroelectric and coal-fired on some factors, such as the demand load, the coming flow of reservoir, and so on. In high reservoir energy in WB3 at these percentage retains constant from 7000MW to 14000MW. With increase in load, the percentage of electric en- ergy converted from reservoir energy of reservoir water 6 Conclusions hydro-thermal power systems depends on such factors as load demand, the water-consumed volume increment rate, the in-flow of r ater-consumed volume increment rate is first scheduled for electric energy production, and the plant with the highest water-consumed volume increment rate is finally scheduled for production. 2) In different flow hour, the sharing percentage of the electric energy produced by h plants is dependent in-flow hour, the percentage shared by hydroelectric plants may be high for small load demand and is low for great load, while the percentage shared by coal-fired plants may be low for small load demand and is high for great load. In low in-flow hour, the percentage shared by hydroelectric plants may be low for any load demand, while the percentage shared by coal-fired plants may be high for any load demand. With increase in load, water-deep pressure energy and kinetic energy increases, as shown in Figure 4 and Figure 5, and potential energy decreases, as shown in Figure 6, while reservoir energy increases first, and Acknowledgements The author greatly acknowledges the financial support of  J. K. WU Copyright © 2009 SciRes EPE 64 vation Plan in Graduate Ed llace S. W. and Fleten S. E., “Stochastic programming m nergy,” The series Handbooks in Operations Research and Management Science, Vol. 10, pp. 637-677, 2003. ., and Li C. A., “Scheduling hydro power othermal coordination ow [10] Conejo A. J., Arroyo J. M., Contreras J., et al., “Self-scheduling of a hydro producer in a pool-based electricity market,” IEEE , et al., “Ex- ixed integer programming ap- Fast evolu- haris J. B., et al., “A ., Ni E., and Li R., “An optimization-based algorithm for aotic particle 2007. rres G., and Zambroni de Souza A. warm opti- rothermal schedul- pinning reserve through network flows,” the National High Technology Research and Develop- ment Program of China (863 Program) (2007AA04Z 197), National Natural Science Foundation of China (50767001), Nature Science Foundation of Guangxi (0640028), Program for 100 Young and Middle-aged Disciplinary Leaders in Guangxi Higher Education In- stitutions (RC20060808002), Science and Technology Project of Guangxi Education Administration (200808 MS150) and Guangxi Innou-t cation. REFERENCES [1] Fleten S. E., Wallace S. W., and Ziemba W. T., “Portfolio man- agement in a deregulated hydropower based electricity market,” In Proceedings of the 3rd International Conference on Hydro- power Development, pp. 197-204, 1997. [2] Fleten S. E., Wallace S. W., and Ziemba W. T., “Hedging elec- tricity portfolios via stochastic programming,” IMA volumes on Mathematics and Its Applications, Vol. 128, pp. 71-93, 2002. [3] Ilyas Eker, “The design of robust multi-loop-cascaded hydro governors,” Engineering Computer, Vol. 20, No. 2, pp. 45-53, 2004. [4] Wa in e odels [17] Yu B. H., Yuan X. H., and Wang J. W., “Short-term hy- dro-thermal scheduling using particle swarm optimization method,” Energy Conversion and Management, Vol. 48, No. 7, pp. 1902-1908, [5] Guan X., Svoboda A [18] systems with restricted operating zones and discharge ramping constraints,” IEEE Transactions on Power System, Vol.14, No.1, pp. 126-131, 1999. [6] Yang J. S., and Chen N, “Short term hydr C., using multipass dynamic programming,” IEEE Transactions on Power System, Vol. 4, No. 3, pp. 1050-1056, 1989. [7] Li C., Jap P., and Streiffert D, “Implementation of network fl programming to the hydrothermal coordination in an energy management system,” IEEE Transactions on Power System, Vol. 8, No. 3, pp. 1045-1053, 1993. [8] Rosenthal R. E., “A nonlinear network flow algorithm for maximization of benefits in a hydroelectric power system,” Op- eration Research, Vol. 29, No. 4, pp. 763-786, 1981. [9] Chang G. W., Aganagic M., Waight J. G., et al., “Experiences with mixed integer linear programming based approaches on short-term hydro scheduling,” IEEE Transactions on Power Sys- tems, Vol. 16, No. 4, pp. 743-749, 2001. Transactions on Power System, Vol. 17, No. 4, pp. 1265-1272, 2002. [11] Chang G., Mohamed Aganagic W, Waight James G periences with mixed integer linear programming based ap- proaches on short-term hydro scheduling,” IEEE Transactions on Power System, Vol. 16, No. 4, pp. 743-749, 2001. [12] Nilsson O. and Sjelvgren D., “M plied to short-term planning of a hydro-thermal system,” IEEE Transactions on Power System, Vol. 11, No. 1, pp. 281-286, 1996. [13] Sinha N., Chakrabarti R., and Chattopadhyay P. K., “ ionary programming techniques for short-term hydrothermal scheduling,” Electric Power Systems Research, Vol. 66, pp. 97-103, 2003. [14] Zoumas C. E., Bakirtzis A. G., Theoc genetic algorithm solution approach to the hydrothermal coordi- nation problem,” IEEE Transactions on Power System, Vol. 19, No. 2, pp. 1356-1364, 2004. [15] Guan X scheduling hydrothermal power systems with cascaded reser- voirs and discrete hydro constraints,” IEEE Transactions on Power System, Vol. 12, No. 4, pp. 1775-1780, 1997. [16] Jiang C. W. and Etorre B., “A self-adaptive ch swarm algorithm for short term hydroelectric system scheduling in deregulated environment,” Energy Conversion and Manage- ment, Vol. 46, No. 17, pp. 2689-2696, 2005. Umayal S. P. and Kamaraj N., “Stochastic multi objective short term hydrothermal scheduling using particle swarm opti- mization,” In Indicon Annual IEEE, pp. 497-501, 2005. [19] Esmin A. A. A., Lambert-To “A hybrid particle swarm optimization applied to loss power minimization,” IEEE Transactions on Power System, Vol. 20, No. 2, pp. 855-859, 2005. [20] Abido M. A., “Optimal power flow using particle s mization,” Electrical Power Energy System, Vol. 24, pp. 563-571, 2002. [21] Zambelli M., Siqueira T. G., Cicogna M., et al., “Deterministic versus stochastic models for long term hyd ing,” In Proceedings of IEEE Power Engineering Society Gen- eral Meeting, 2006. [22] Heredia F. J., Nabonal N. L., “Optimum short-term hydrother- mal scheduling with s IEEE Transactions on Power System, Vol. 10, No. 3, pp. 1642-1651, 1995. |