 Journal of Environmental Protection, 2011, 2, 502-510 doi:10.4236/jep.2011.25058 Published Online July 2011 (http://www.scirp.org/journal/jep) Copyright © 2011 SciRes. JEP A Soil Quality Index to Evaluate the Vermicompost Amendments Effects on Soil Properites Romina Romaniuk*, Lidia Giuffré, Rosario Romero Edafología, Facultad de Agronomía, Universidad de Buenos Aires, Buenos Aires, Argentina. Email: romaniuk@agro.uba.ar Received April 12th, 2011; revised May 16th, 2011; accepted June 18th, 2011. ABSTRACT The aims of this work were 1) to evaluate the changes in soil properties with the application of different amounts of vermicompost (10 and 20 Mg·ha–1), and 2) to construct a soil quality ind ex that allows the evalua tion of changes in the most sensitive soil parameters. The study was carried out in a cattle field of General Alvear, Bueno s Aires, Argentina. Vermicompost application showed a positive effect on most of the chemical and biological soil properties evaluated, especially with the higher dose (20 Mg·ha–1). There were slight but significant increases in electrical conductivity and soil pH with the higher dose of vermicompost. Physical soil properties were not affected by the vermicompost amend- ment. The SQI showed a significant increase of soil quality with the vermicompost dose of 20 Mg·ha–1, especially by enhancing the biochemical an d bi ol o gi cal properti e s. Keywords: Organic Amendments, Soil Physical Properties, Soil Biochemical Properties, Soil Bio logical Properties, Soil Quality Indicators 1. Introduction and Methods Soil is one of the most valuable natural resources and maintains its health is a moral responsibility. However, the urgency to produce more food and fuels is causing an irreparable damage on soil. Excessive mineral fertiliza- tion and irrational cultural practices contribute to reduce fertility and the organic matter contents. These circum- stances have led many researchers to search new and better management strategies. Soil application of organic waste, represents a management strategy that can reduce the losses of soil organic matter [1]. The use of organic amendments improves soil structure an d fertility, increas- ing microbial populations, activity and diversity [2-4]. The vermicompost is an “organic fertilizer” produced by interactions between earthworms and soil microorga- nisms, resulting in a material with a high degree of ma- turity, high porosity, aeration, drainage, water storage capacity and microbial activity [5 ]. The use of this amen- dment promotes biological activity enhancing the produ- ctive capacity of soils directly related to increases of nutrients availability and indirectly through improve- ments in physical properties [6]. There are several studies about changes produced by the application of vermicompost on physical, chemical and biological soil properties. Mahesewarappa et al. [7] found increases in N content, total organic carbon, and pH values in soil amended with vermicompost. According to Pascual et al. [8] the contents of humus and microbial biomass carbon in soils fertilized with vermicompost were increased compared with those receiving inorganic fertilizers only. Albiach et al. [2] reported increases in soil microbial activity with the addition of organic ferti- lizers. A study by Marinari et al. [9] showed that the in- corporation of vermicompost to soil under maize signi- ficantly improved physical and biological soil properties. Arancon et al. [10] reported increases of humic acids contents after vermicompost application in soils, related with the largest amount of microorganisms associated with the earthworms activity. Tejada et al. [11] found that vermicompost application had a positive effect on the soil physical, chemical and biological properties, in- creasing plant c ov er and de cr e a si n g the soil losses. Although there are numerous research about the changes in soil properties after organic amendments, there are not informations about which are the main parameters (in- dicators) to be monitored over time to assess the effects 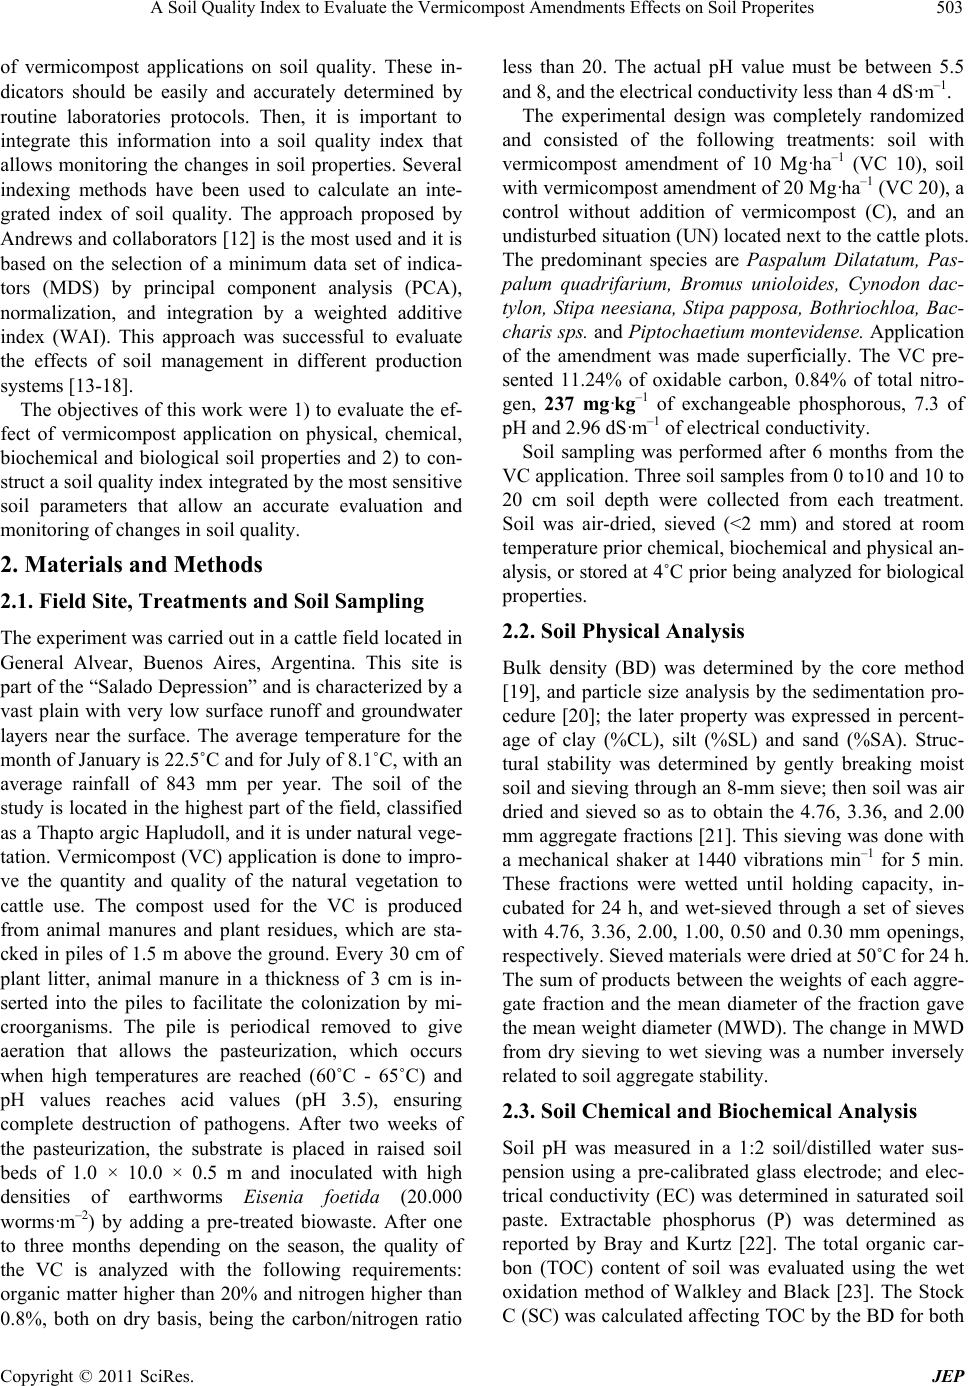 A Soil Quality Index to Evaluate the Vermicompost Amendments Effects on Soil Properites503 of vermicompost applications on soil quality. These in- dicators should be easily and accurately determined by routine laboratories protocols. Then, it is important to integrate this information into a soil quality index that allows monitoring the changes in soil properties. Several indexing methods have been used to calculate an inte- grated index of soil quality. The approach proposed by Andrews and collaborators [12] is th e most used and it is based on the selection of a minimum data set of indica- tors (MDS) by principal component analysis (PCA), normalization, and integration by a weighted additive index (WAI). This approach was successful to evaluate the effects of soil management in different production systems [13-18]. The objectives of this work were 1) to evaluate the ef- fect of vermicompost application on physical, chemical, biochemical and biological soil properties and 2) to con- struct a soil quality in dex in teg rated by th e most sensitive soil parameters that allow an accurate evaluation and monitoring of changes in so il quality. 2. Materials and Methods 2.1. Field Site, Treatments and Soil Sampling The experiment was carried out in a cattle field located in General Alvear, Buenos Aires, Argentina. This site is part of the “ Salado Depre ssion” and is ch aracterize d by a vast plain with very low surface runoff and groundwater layers near the surface. The average temperature for the month of January is 22.5˚C and for July of 8.1˚C, with an average rainfall of 843 mm per year. The soil of the study is located in the highest part of the field, classified as a Thapto argic Hap ludoll, and it is under natural vege- tation. Vermicompost (VC) application is done to impro- ve the quantity and quality of the natural vegetation to cattle use. The compost used for the VC is produced from animal manures and plant residues, which are sta- cked in piles of 1 .5 m above the ground. Every 3 0 cm of plant litter, animal manure in a thickness of 3 cm is in- serted into the piles to facilitate the colonization by mi- croorganisms. The pile is periodical removed to give aeration that allows the pasteurization, which occurs when high temperatures are reached (60˚C - 65˚C) and pH values reaches acid values (pH 3.5), ensuring complete destruction of pathogens. After two weeks of the pasteurization, the substrate is placed in raised soil beds of 1.0 × 10.0 × 0.5 m and inoculated with high densities of earthworms Eisenia foetida (20.000 worms·m–2) by adding a pre-treated biowaste. After one to three months depending on the season, the quality of the VC is analyzed with the following requirements: organic matter higher than 20% and nitrogen higher than 0.8%, both on dry basis, being the carbon/nitrogen ratio less than 20. The actual pH value must be between 5.5 and 8, and the electrical conductivity less than 4 dS·m–1. The experimental design was completely randomized and consisted of the following treatments: soil with vermicompost amendment of 10 Mg·ha–1 (VC 10), soil with vermicompost amendment of 20 Mg·ha–1 (VC 20), a control without addition of vermicompost (C), and an undisturbed situation (UN) located next to the cattle plots. The predominant species are Paspalum Dilatatum, Pas- palum quadrifarium, Bromus unioloides, Cynodon dac- tylon, Stipa neesiana, Stipa papposa, Bothriochloa, Bac- charis sps. and Piptochaetium montevidense. Application of the amendment was made superficially. The VC pre- sented 11.24% of oxidable carbon, 0.84% of total nitro- gen, 237 mg·kg–1 of exchangeable phosphorous, 7.3 of pH and 2.96 d S·m–1 of electrical conductivity. Soil sampling was performed after 6 months from the VC application. Three soil samples from 0 to10 and 10 to 20 cm soil depth were collected from each treatment. Soil was air-dried, sieved (<2 mm) and stored at room temperature prior chemical, biochemical and physical an- alysis, or stored at 4˚C prior being analyzed for biological properties. 2.2. Soil Physical Analysis Bulk density (BD) was determined by the core method [19], and particle size analysis by the sedimentation pro- cedure [20]; the later property was expressed in percent- age of clay (%CL), silt (%SL) and sand (%SA). Struc- tural stability was determined by gently breaking moist soil and sieving throu gh an 8-mm sieve; then soil was air dried and sieved so as to obtain the 4.76, 3.36, and 2.00 mm aggregate fractions [21]. This sieving was done with a mechanical shaker at 1440 vibrations min–1 for 5 min. These fractions were wetted until holding capacity, in- cubated for 24 h, and wet-sieved through a set of sieves with 4.76, 3.36, 2.00, 1.00, 0.50 and 0.30 mm openings, respectively. Sieved materials were dried at 50˚C fo r 24 h. The sum of products between the weights of each aggre- gate fraction and the mean diameter of the fraction gave the mean weight diameter (MWD). The change in MWD from dry sieving to wet sieving was a number inversely related to soil aggregate stab ility. 2.3. Soil Chemical and Biochemical Analysis Soil pH was measured in a 1:2 soil/distilled water sus- pension using a pre-calibrated glass electrode; and elec- trical conductivity (EC) was determined in saturated soil paste. Extractable phosphorus (P) was determined as reported by Bray and Kurtz [22]. The total organic car- bon (TOC) content of soil was evaluated using the wet oxidation method of Walkley and Black [23]. The Stock C (SC) was calculated affecting TOC by the BD for both Copyright © 2011 SciRes. JEP 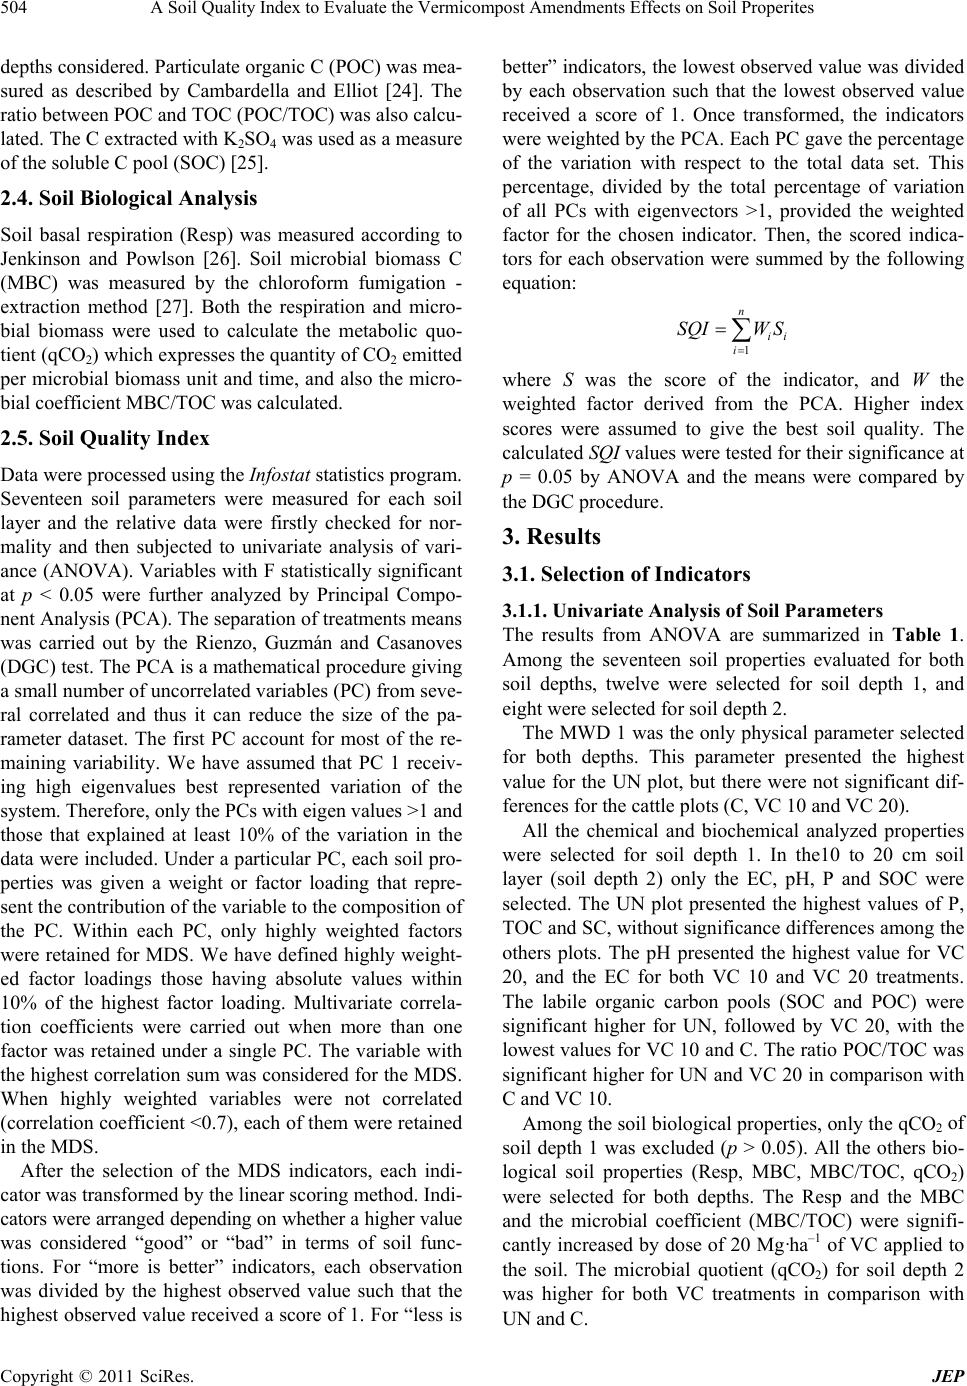 A Soil Quality Index to Evaluate the Vermicompost Amendments Effects on Soil Properites 504 depths considered. Particulate organic C (POC) was mea- sured as described by Cambardella and Elliot [24]. The ratio between POC and TOC (POC/TOC) was also calcu- lated. The C extracted with K2SO4 was u sed as a meas u re of the soluble C pool (SOC) [25]. 2.4. Soil Biological Analysis Soil basal respiration (Resp) was measured according to Jenkinson and Powlson [26]. Soil microbial biomass C (MBC) was measured by the chloroform fumigation - extraction method [27]. Both the respiration and micro- bial biomass were used to calculate the metabolic quo- tient (qCO2) which expresses the quantity o f CO2 emitted per microbial biomass unit and time, and also the micro- bial coefficient MBC/TOC was calculated. 2.5. Soil Quality Index Data were processed using the Infostat statistics program. Seventeen soil parameters were measured for each soil layer and the relative data were firstly checked for nor- mality and then subjected to univariate analysis of vari- ance (ANOVA). Variables w ith F statistically significan t at p < 0.05 were further analyzed by Principal Compo- nent Analysis (PCA). The separation of treatments means was carried out by the Rienzo, Guzmán and Casanoves (DGC) test. The PCA is a mathematical procedure giving a small number of uncorrelated variables (PC) from seve- ral correlated and thus it can reduce the size of the pa- rameter dataset. The first PC account for most of the re- maining variability. We have assumed that PC 1 receiv- ing high eigenvalues best represented variation of the system. Therefore, only the PCs with eigen values >1 and those that explained at least 10% of the variation in the data were included. Under a particular PC, each soil pro- perties was given a weight or factor loading that repre- sent the contribution of the variable to the composition of the PC. Within each PC, only highly weighted factors were retained for MDS. We have defined highly weight- ed factor loadings those having absolute values within 10% of the highest factor loading. Multivariate correla- tion coefficients were carried out when more than one factor was retained under a single PC. The variable with the highest correlation sum was considered for the MDS. When highly weighted variables were not correlated (correlation coefficient <0.7), each of them were retained in the MDS. After the selection of the MDS indicators, each indi- cator was transformed by the linear scoring method. Indi- cators were arranged depending on whether a higher value was considered “good” or “bad” in terms of soil func- tions. For “more is better” indicators, each observation was divided by the highest observed value such that the highest observed value received a score of 1. For “less is better” indicators, the lowest observed value was divided by each observation such that the lowest observed value received a score of 1. Once transformed, the indicators were weighted by the PCA. Each PC gave the percentage of the variation with respect to the total data set. This percentage, divided by the total percentage of variation of all PCs with eigenvectors >1, provided the weighted factor for the chosen indicator. Then, the scored indica- tors for each observation were summed by the following equation: 1 n ii i SQIW S where S was the score of the indicator, and W the weighted factor derived from the PCA. Higher index scores were assumed to give the best soil quality. The calculated SQI values were tested for their significance at p = 0.05 by ANOVA and the means were compared by the DGC procedure. 3. Results 3.1. Selection of Indicators 3.1.1. Univariate Analysis of Soil Parameters The results from ANOVA are summarized in Table 1. Among the seventeen soil properties evaluated for both soil depths, twelve were selected for soil depth 1, and eight were selected for soil depth 2. The MWD 1 was the only physical parameter selected for both depths. This parameter presented the highest value for the UN plot, but there were not significant dif- ferences for the cattle plots (C, VC 10 and VC 20). All the chemical and biochemical analyzed properties were selected for soil depth 1. In the10 to 20 cm soil layer (soil depth 2) only the EC, pH, P and SOC were selected. The UN plot presented the highest values of P, TOC and SC, without significance differences among the others plots. The pH presented the highest value for VC 20, and the EC for both VC 10 and VC 20 treatments. The labile organic carbon pools (SOC and POC) were significant higher for UN, followed by VC 20, with the lowest values for VC 10 and C. The ratio POC/TOC was significant higher for UN and VC 20 in comparison with C and VC 10. Among the soil biological properties, only the qCO2 of soil depth 1 was excluded (p > 0.05). All the others bio- logical soil properties (Resp, MBC, MBC/TOC, qCO2) were selected for both depths. The Resp and the MBC and the microbial coefficient (MBC/TOC) were signifi- cantly increased by dose of 20 Mg·ha–1 of VC applied to the soil. The microbial quotient (qCO2) for soil depth 2 was higher for both VC treatments in comparison with UN and C. C opyright © 2011 SciRes. JEP 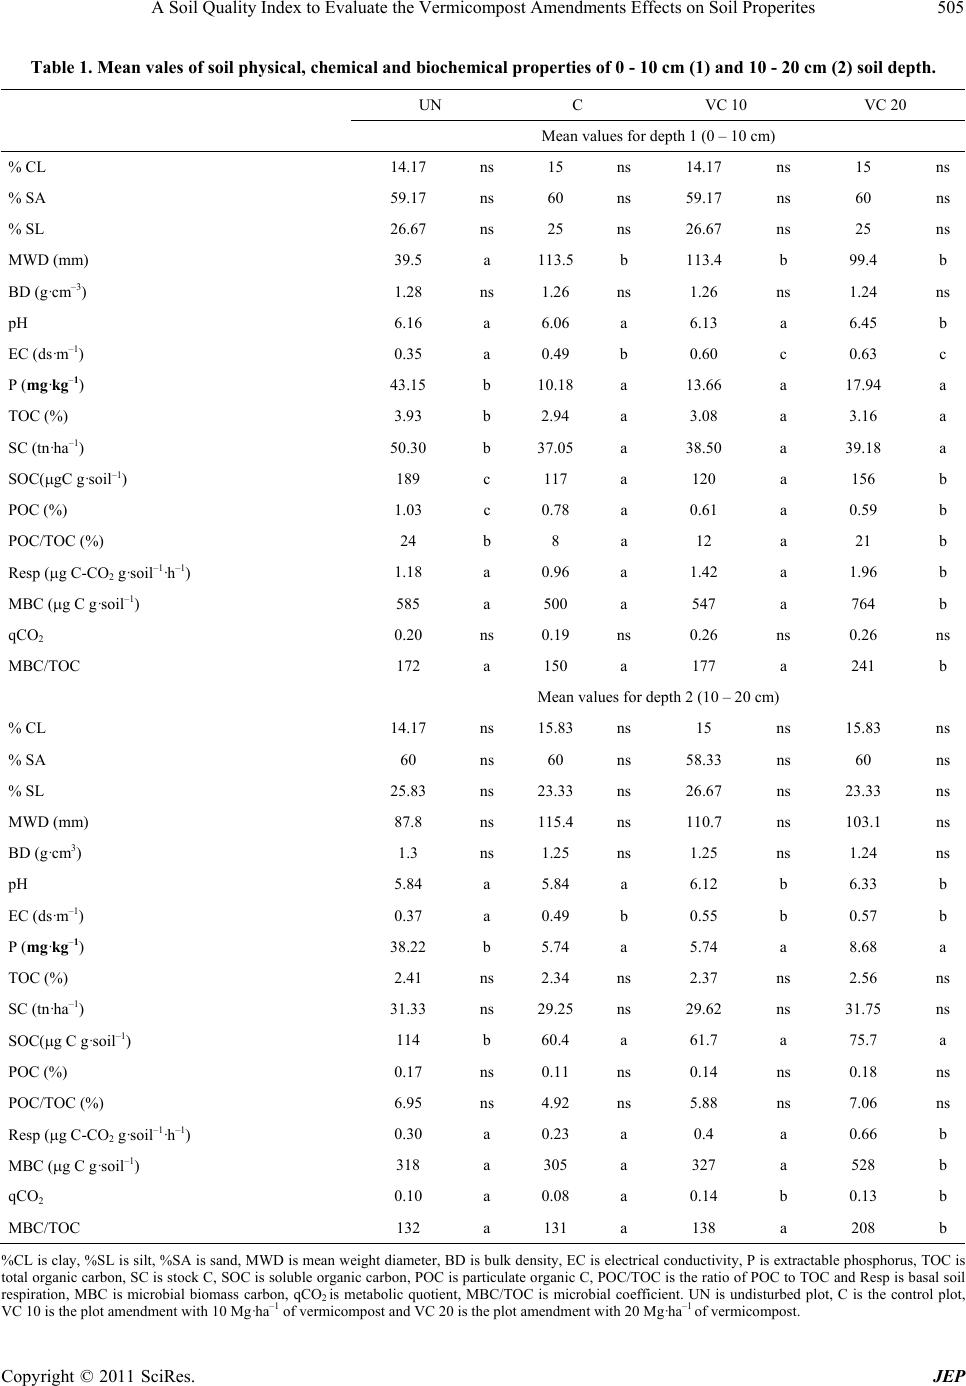 A Soil Quality Index to Evaluate the Vermicompost Amendments Effects on Soil Properites Copyright © 2011 SciRes. JEP 505 Table 1. Mean vales of soil physical, chemical and biochemical properties of 0 - 10 cm (1) and 10 - 20 cm (2) soil depth. UN C VC 10 VC 20 Mean values for depth 1 (0 – 10 c m) % CL 14.17 ns15 ns14.17 ns 15 ns % SA 59.17 ns60 ns59.17 ns 60 ns % SL 26.67 ns25 ns26.67 ns 25 ns MWD (mm) 39.5 a 113.5 b 113.4 b 99.4 b BD (g·cm–3) 1.28 ns1.26 ns1.26 ns 1.24 ns pH 6.16 a 6.06 a 6.13 a 6.45 b EC (ds·m–1) 0.35 a 0.49 b 0.60 c 0.63 c P (mg·kg–1) 43.15 b 10.18 a 13.66 a 17.94 a TOC (%) 3.93 b 2.94 a 3.08 a 3.16 a SC (tn·ha–1) 50.30 b 37.05 a 38.50 a 39.18 a SOC(gC g·soil–1) 189 c 117 a 120 a 156 b POC (%) 1.03 c 0.78 a 0.61 a 0.59 b POC/TOC (%) 24 b 8 a 12 a 21 b Resp (g C-CO2 g·soil–1·h–1) 1.18 a 0.96 a 1.42 a 1.96 b MBC (g C g·soil–1) 585 a 500 a 547 a 764 b qCO2 0.20 ns0.19 ns0.26 ns 0.26 ns MBC/TOC 172 a 150 a 177 a 241 b Mean values for depth 2 ( 10 – 2 0 c m) % CL 14.17 ns15.83 ns15 ns 15.83 ns % SA 60 ns60 ns58.33 ns 60 ns % SL 25.83 ns23.33 ns26.67 ns 23.33 ns MWD (mm) 87.8 ns115.4 ns110.7 ns 103.1 ns BD (g·cm3) 1.3 ns1.25 ns1.25 ns 1.24 ns pH 5.84 a 5.84 a 6.12 b 6.33 b EC (ds·m–1) 0.37 a 0.49 b 0.55 b 0.57 b P (mg·kg–1) 38.22 b 5.74 a 5.74 a 8.68 a TOC (%) 2.41 ns2.34 ns2.37 ns 2.56 ns SC (tn·ha–1) 31.33 ns29.25 ns29.62 ns 31.75 ns SOC(g C g·soil–1) 114 b 60.4 a 61.7 a 75.7 a POC (%) 0.17 ns0.11 ns0.14 ns 0.18 ns POC/TOC (%) 6.95 ns4.92 ns5.88 ns 7.06 ns Resp (g C-CO2 g·soil–1·h–1) 0.30 a 0.23 a 0.4 a 0.66 b MBC (g C g·soil–1) 318 a 305 a 327 a 528 b qCO2 0.10 a 0.08 a 0.14 b 0.13 b MBC/TOC 132 a 131 a 138 a 208 b %CL is clay, %SL is silt, %SA is sand, MWD is mean weight diameter, BD is bulk density, EC is electrical conductivity, P is extractable pho sphorus, TOC is total organic carbon, SC is stock C, SOC is soluble organic carbon, POC is particulate organic C, POC/TOC is the ratio of POC to TOC and Resp is basal soil respiration, MBC is microbial biomass carbon, qCO2 is metabolic quotient, MBC/TOC is microbial coefficient. UN is undisturbed plot, C is the control plot, VC 10 is the plot amendment with 10 Mg· ha–1 of vermicompo s t and VC 20 is t he plot amendment with 20 Mg·ha–1 of verm i compost.  A Soil Quality Index to Evaluate the Vermicompost Amendments Effects on Soil Properites 506 Table 2. Results of principal components analysis. 3.1.2. Multi v a r i ate An al ysi s of the Selected Soil Parameters Tables 2 and 3 show results of PCA analysis and corre- lation between soil properties, respectively. Both PC 1 an d PC 2 were selected. Accord in g to PC 1 , MWD 1, EC 1, P 1, SC 1 and P 2 were considered for the correlation analysis. The highest sum of correlation coef- ficient (cc) was shown by P1 with final selection of P 1, MWD1 and EC 1 (cc < 0.7). According to PC 2, MBC 1, pH 1 and POC/TOC 1 were selected with MBC 1 gettin g the highest sum of correlations coefficients. The correla- tion between MBC 1 and POC/TOC 1 was < 0.7 (p < 0.1), and both were selected to represent CP2. 3.2. Transformation and Integration of Indicators To carry out linear scores of selected properties, values of each observation of P1, POC/TOC and MBC were divided by the highest observed value; and values of MWD and EC 1 were divided by the lowest observed value. The transformation allows scoring observation as “higher is better” up to a threshold value whereas the latter transformation allows scoring “lower is better” above the threshold. Selected properties for a given PC have the same weight into the index. This gave a weighted factor of 0.545 for selected properties of PC 1 (MWD 1, P 1 and EC 1) and 0.415 for selected properties of PC 2 (MBC 1 and POC/ COT 1). Soil quality index was: 0.545 111 0.415 11 SQIP MWD EC BCCOP COT 3.3. Application of the Soil Quality Index Figure 1 shows the values of soil quality in dex. The SQI differentiated the undisturbed situation (UN) from those under grazing (T, VC 10 and VC 20). The UN presented the highest value of the SQI. The applications of 20 Mg·ha–1 of vermicompost (VC 20 treatment) sig- nifically increase the final value of the SQI, in compari- son with the control (C) and the treatment with vermi- compost amendment of 10 Mg·ha–1 (VC 10). The SQI values were similar for C and VC 10. Differences be- tween the undisturbed situation (UN) and the cattle plots (C, VC 10 and VC 20) were mainly represented by MWD 1 and P1 values. The higher SQI value of the VC 20 treatment in comparison with T was mainly repre- sented by the phosphorus contents (P 1) and by the bio- logical indicators (MBC 1 and COP/COT 1). 4. Discussion The cattle practice reduces the structural stability of soil, and thus could be the reason of the different values of the Principal Component Analysis PC 1 2 Eigenvalues 10.14 7.09 Proportion 0.48 0.34 Weighted factor 0.585 0.415 Factor loadings MWD 1 –0.28 –0.11 BD 1 0.25 0.03 pH 1 –0.11 0.33 EC 1 –0.29 0.06 P 1 0.28 0.15 TOC 1 0.25 0.13 POC 1 0.22 0.27 POC/TOC 1 0.17 0.31 SOC 1 0.22 0.24 SC 1 0.27 0.12 Resp 1 –0.14 0.26 MBC 1 –0.07 0.34 MBC/COT 1 –0.2 0.23 pH 2 –0.2 0.24 EC 2 –0.26 0.03 P 2 0.29 0.11 SOC 2 0.24 0.16 Resp 2 –0.18 0.28 MBC 2 –0.16 0.29 qCO2 2 –0.14 0.15 MBC/COT 2 –0.16 0.27 MWD is mean weight diameter, BD is bulk density, EC is electrical conduc- tivity, P is extractable phosphorus, TOC is total organic carbon, SC is stock C, SOC is soluble organic carbon, POC is particulate organic C, POC/TOC is the ratio of POC to TOC and Resp is basal soil respiration, MBC is mi- crobial biomass carbon, qCO2 is metabolic quotient, MBC/TOC is microbial coefficient for 0 - 10 cm (1) and 10 - 20 cm (2) soil depth. MWD between the undisturbed plot and the plots under grazing. The soil physical parameters evaluated (% CL, % SL, % SA, BD, MWD) were not affected by the both doses of VC applied, probably because the time elapsed since the beginning of the experiment until the sampling was not enough to affect significantly these soil proper- ties. However, the MWD and the BD, decrease in soils amendment with the highest dose of VC (20 Mg·ha–1). Organic soil amendments could help to con- serve and/or enhance the structure, because organic matter is considered an active agent that promotes aggre- gation through physical and chemical mechanisms [28]. Whalen et al. [29] noted a larger amount of aggregates stable in water five months after the in- corporation of VC, concluding that the MWD increased linearly with increasing doses vermicompost applied. The higher values of most of the chemical and bioche- C opyright © 2011 SciRes. JEP  A Soil Quality Index to Evaluate the Vermicompost Amendments Effects on Soil Properites507 Table 3. Correlation between soil properties. MWD 1 BD1 pH 1 EC 1 P 1 TOC 1 POC 1 POC/C 1 SOC 1 SC 1 Resp 1 MBC 1 MBC/ C 1 pH 2 EC 2 P 2 SOC 2 Resp 2 MBC 2 qCO2 2 MBC /C 2 MWD 1 1 BD 1 –0.72 1 pH 1 0.09 –0.23 1 EC 1 0.82 –0.71 0.46 1 P 1 –0.63 0.67 0.05 –0.68 1 TOC 1 –0.74 0.49 0.01 –0.61 0.83 1 POC 1 –0.79 0.57 0.38 –0.5 0.89 0.85 1 POC/ C 1 –0.7 0.51 0.54 –0.36 0.81 0.72 0.97 1 SOC 1 –0.87 0.66 0.25 –0.56 0.85 0.76 0.94 0.91 SC 1 –0.8 0.64 –0.03 –0.69 0.87 0.98 0.87 0.750.811 Resp 1 0.07 –0.44 0.71 0.49 –0.05 –0.13 0.16 0.310.12–0.21 MBC 1 –0.04 0.03 0.88 0.33 0.12 0.1 0.5 0.660.470.10.611 MBC/ C 1 0.36 –0.26 0.77 0.63 –0.35 –0.46 -0.03 0.180.01–0.460.610.831 pH 2 0.44 –0.32 0.79 0.7 –0.3 –0.34 0.03 0.23–0.04–0.360.630.790.881 EC 2 0.73 –0.86 0.33 0.72 –0.63 –0.48 –0.45 –0.33–0.55–0.610.560.230.470.541 P 2 –0.64 0.72 –0.06 –0.83 0.98 0.83 0.84 0.740.820.78–0.180.01–0.46–0.43–0.741 SOC 2 –0.81 0.6 0.12 –0.59 0.87 0.74 0.81 0.750.750.78–0.060.15– 0.28–0.32–0.590.88 1 Resp 2 0.32 –0.41 0.87 0.72 –0.2 –0.16 0.12 0.280.0048 –0.220.680.720.730.860.45–0.31 –0.08 1 MBC 2 0.16 –0.45 0.92 0.54 –0.12 –0.13 0.18 0.330.12–0.210.820.760.760.720.46–0.23 –0.08 0.84 1 qCO2 2 0.37 –0.25 0.45 0.66 –0.2 –0.11 0.02 0.11–0.14–0.150.380.380.390.670.38–0.29 –0.06 0.77 0.34 1 MBC/ C 2 0.18 –0.48 0.89 0.52 –0.14 –0.17 0.12 0.280.07–0.250.780.710.740.710.45–0.24 –0.13 0.84 0.98 0.331 MWD is mean weight diameter, BD is bulk density, EC is electrical conductivity, P is extractable phosphorus, TOC is total organic carbon, SC is stock C, SOC is soluble organic carbon, POC is particulate organic C, POC/TOC is the ratio of POC to TOC and Resp is basal soil respiration, MBC is microbial biomass carbon, qCO2 is metabolic quotient, MBC/TOC is microbial coefficient for 0 - 10 cm (1) and 10-20 cm (2) soil depth. mical parameters (P, TOC, SC, SOC, POC and POC/ TOC) in the UN plot show that the cattle reduced the nutrient and carbon contents of soils, probably because removals by grazing were greater than inputs from litter and cows depositions. The increase in pH could be due to the higher Ph value of the amendment (pH of 7.3) in relation to soil (pH of 6.06). However, this increase is not considered danger- ous to soil quality because the values remained close to neutrality. Soil electrical conductivity was significantly affected (P < 0.05) by both amendments of VC. This result can be interpreted as a warning signal, since there is a clear trend to increases of the electrical conductivity with the applied doses of the VC. Similar results were found by Gonzalez et al. [3]. There was a significant increase in the soil extractable phosphorus with the increase of the VC doses applied. Vermicompost amendments could help to recovering the nutrient contents. The data obtained in our experiment agree with those of numerous studies in which the VC applied increases the concentratio n of soil P [30]. Devlie- gher and Verstraete [31] found a significant increase in the P contents after the VC amendment, reaching th e Copyright © 2011 SciRes. JEP 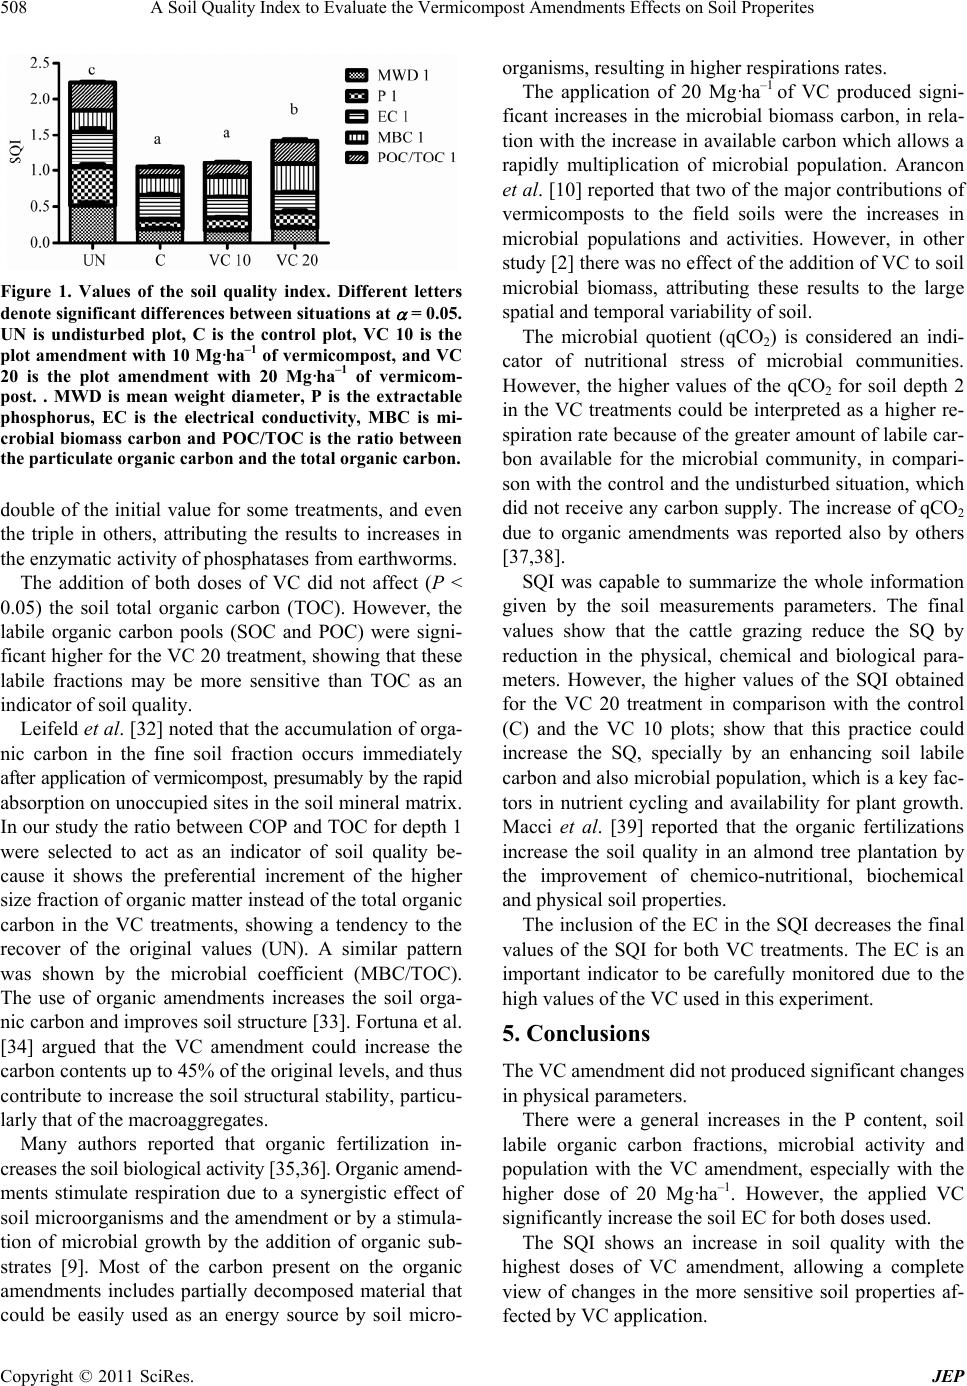 A Soil Quality Index to Evaluate the Vermicompost Amendments Effects on Soil Properites 508 Figure 1. Values of the soil quality index. Different letters denote significant differences between situations at = 0.05. UN is undisturbed plot, C is the control plot, VC 10 is the plot amendment with 10 Mg·ha–1 of vermicompost, and VC 20 is the plot amendment with 20 Mg·ha–1 of vermicom- post. . MWD is mean weight diameter, P is the extractable phosphorus, EC is the electrical conductivity, MBC is mi- crobial biomass carbon and POC/TOC is the ratio between the particulate organic carbon and the total organic carbon. double of the initial value for some treatments, and even the triple in others, attributing the results to increases in the enzymatic activity of phosphatases from earthworms. The addition of both doses of VC did not affect (P < 0.05) the soil total organic carbon (TOC). However, the labile organic carbon pools (SOC and POC) were signi- ficant higher for the VC 20 treatment, showing that these labile fractions may be more sensitive than TOC as an indicator of soil quality. Leifeld et al. [32] noted that the accumulation of orga- nic carbon in the fine soil fraction occurs immediately after application of vermicompost, presumably by the rapid absorption on uno ccupied sites in the soil mine ral matrix. In our study the ratio between COP and TOC for depth 1 were selected to act as an indicator of soil quality be- cause it shows the preferential increment of the higher size fraction of organic matter instead of the total org anic carbon in the VC treatments, showing a tendency to the recover of the original values (UN). A similar pattern was shown by the microbial coefficient (MBC/TOC). The use of organic amendments increases the soil orga- nic carbon and improves soil structure [33]. Fortuna et al. [34] argued that the VC amendment could increase the carbon contents up to 45% of the original levels, and thus contribute to increase the soil structural stability, p articu- larly that of the macroaggregates. Many authors reported that organic fertilization in- creases the soil biological activity [35,36]. Organi c amend- ments stimulate respiration due to a synergistic effect of soil microorganisms and the amendment or by a stimula- tion of microbial growth by the addition of organic sub- strates [9]. Most of the carbon present on the organic amendments includes partially decomposed material that could be easily used as an energy source by soil micro- organisms, resulting in higher respirations rates. The application of 20 Mg·ha–1 of VC produced signi- ficant increases in the microbial biomass carbon, in rela- tion with the increase in available carbon which allows a rapidly multiplication of microbial population. Arancon et al. [10] reported that two of the major contributions of vermicomposts to the field soils were the increases in microbial populations and activities. However, in other study [2] there was no effect of the addition of VC to soil microbial biomass, attributing these results to the large spatial and temporal variability o f soil. The microbial quotient (qCO2) is considered an indi- cator of nutritional stress of microbial communities. However, the higher values of the qCO2 for soil depth 2 in the VC treatments could be interpreted as a higher re- spiration rate because of the greater amount of labile car- bon available for the microbial community, in compari- son with the control and the undisturbed situation, which did not receive any carbon supply. The increase of qCO2 due to organic amendments was reported also by others [37,38]. SQI was capable to summarize the whole information given by the soil measurements parameters. The final values show that the cattle grazing reduce the SQ by reduction in the physical, chemical and biological para- meters. However, the higher values of the SQI obtained for the VC 20 treatment in comparison with the control (C) and the VC 10 plots; show that this practice could increase the SQ, specially by an enhancing soil labile carbon and also microbial population, which is a key fac- tors in nutrient cycling and availability for plant growth. Macci et al. [39] reported that the organic fertilizations increase the soil quality in an almond tree plantation by the improvement of chemico-nutritional, biochemical and physical soil properties. The inclusion of the EC in the SQI decreases the final values of the SQI for both VC treatments. The EC is an important indicator to be carefully monitored due to the high values of the VC used in this experiment. 5. Conclusions The VC amendment did not produced significant changes in physical parameters. There were a general increases in the P content, soil labile organic carbon fractions, microbial activity and population with the VC amendment, especially with the higher dose of 20 Mg·ha–1. However, the applied VC significantly increase the so il EC for both doses used. The SQI shows an increase in soil quality with the highest doses of VC amendment, allowing a complete view of changes in the more sensitive soil properties af- fected by VC application. C opyright © 2011 SciRes. JEP  A Soil Quality Index to Evaluate the Vermicompost Amendments Effects on Soil Properites509 REFERENCES [1] S. Gaind and L. Nain, “Chemical and Biological Proper- ties of Wheat Soil in Response to Paddy Straw Incorpora- tion and Its Biodegradation by Fungal Inocu- lants,” Bio- degradation, Vol. 18, 4, 2006, pp. 495-503. doi:10.1007/s10532-006-9082-6 [2] R. Albiach, R. Canet, F. Pomares and F. Ingelmo, “Mi- crobial Biomass Content and Enzymatic Activities after the Application of Organic Amendments to a Horti- cul- tural Soil,” Bioresource Technology, Vol. 75, No. 1, 2000, pp. 43-48. doi:10.1016/S0960-8524(00)00030-4 [3] M. Gonzalez, E. Gomez, R. Comese, M. Quesada and M. Conti, “Influence of Organic Amendments on Soil Qual- ity Potential Indicators in an Urban Horticultural Sys- tem,” Bioresource Technology, Vol. 101, No. 22, 2010, pp. 8897-8901. doi:10.1016/j.biortech.2010.06.095 [4] J. J. Lee, R. D. Park, Y. W. Kim, J. H. Shim, D. H. Chae, Y. S. Rim, B. K. Sohn, T. H. Kim and K. Y. Kim, “Effect of Food Waste Compost on Microbial Population, Soil Enzyme Activity and Lettuce Growth,” Bioresource Technology, Vol. 93, No. 1, 2004, pp. 21-28. doi:10.1016/j.biortech.2003.10.009 [5] C. C. Edwards and I. Burrows, “The Potential of Earth- worm Composts as Plant Growth Media,” In: C. A. Ed- wards, E. F. Neuhauser, Eds., Earthworms in Environ- mental and Waste Management, SPB Academic Publi- cation, The Netherlands, 1988, pp. 211-220. [6] L. Carpenter-Boggs, A. C. Kennedy and J. P. Reganold, “Organic and Biodynamic Management: Effects on Soil Biology,” Soil Science Society of America Journal, Vol. 64, 2000, pp. 1651-1659. doi:10.2136/sssaj2000.6451651x [7] H. P. Mahesewara ppa, H. V. Nanjappa and M. R. Hegde, “Influence of Organic Manures on Yield of Arrowroot, Soil Physico-Chemical and Biological Properties When Grown as Intercrop in Coconut Garden,” Annals of Agri- cultural Research, Vol. 20, 1999, pp. 318-323. [8] J. A. Pascual, T. Hernandez and C. Garcia, “Lasting Microbiological and Biochemical Effect of the Addition of Municipal Solid Waste to an Arid Soil,” Biology and Fertility of Soils, Vol. 30, 1999, pp. 1-6. doi:10.1007/s003740050579 [9] S. Marinari, G. Masciandaro, B. Ceccanti and S. Grego, “Influence of Organic and Mineral Fertilisers on Soil Biological and Physical Properties,” Bioresource Tech- nology, Vol. 72, No. 1, 2000, pp. 9-17. doi:10.1016/S0960-8524(99)00094-2 [10] N. Q. Arancon, C. A. Edwards and P. Bierman, “Influ- ences of Vermicomposts on Field Strawberries: Part 2. Effects on Soil Microbiological and Chemical Pro- per- ties,” Bioresurce Technology, Vol. 97, No. 6, 2006, pp. 831-840. doi:10.1016/j.biortech.2005.04.016 [11] M. Tejada, A. M. García-Martínez and J. Parrado, “Ef- fects of a Vermicompost Composted with Beet Vina- sse on Soil Properties, Soil Losses and Soil Restoration,” Catena, Vol. 77, No. 3, 2009, pp. 238-247. doi:10.1016/j.catena.2009.01.004 [12] S. S. Andrews, D. L. Karlen and J. P. Mitchell, “A Com- parision of Soil Quality Indexing Methods for Vege- table Production Systems in Northern California,” Agri- culture, Ecosystems & Environment, Vol. 90, No. 1, 2002, pp. 25-45. doi:10.1016/S0167-8809(01)00174-8 [13] F. Bastidia, A. Zsolnay, T. Hernandez and C. García, “Past, Present and Future of Soil Quality Indices: A Bio- logical Perspective,” Geoderma, Vol. 147, No. 40271, 2008, pp. 159-171. doi:10.1016/j.geoderma.2008.08.007 [14] C. A. Cambardella, T. B. Moorman, S. S. Andrews and D. L. Karlen, “Watershed–Scale Assessment of Soil Quality in the Loess Hills of SOUTHWEST IOwa,” Soil & Till- age Research, Vol. 78, No. 2, 2004, pp. 237-247. doi:10.1016/j.still.2004.02.015 [15] J. J. C. Dawson, E. J. Godsiffe, L. P. Thompson, T. K. Ralebitso-Senior, K. S. Killham and G. I. Paton, “Appli- cation of Biological Indicators to Assess Recovery of Hydrocarbon Impacted Soils,” Soil Biology & Biochem- istry, Vol. 39, No. 1, 2007, pp. 164-177. doi:10.1016/j.soilbio.2006.06.020 [16] D. G. Karlen, M. D.Tomer, J. Neppel and C. A. Cam- bardella, “A preliminary Watershed Scale Soil Quality Assessment in North Central Iowa, USA,” Soil and Till- age Research, Vol. 99, 2009, pp. 291-299. doi:10.1016/j.still.2008.03.002 [17] Y. Qi, J. L. Darilek, B. Huang, Y. Zhao, W. Sun and Z. Gu, “Evaluating Soil Quality Indexes in Agricultural Re- gion of Jiangsu Province, China,” Geoderma, Vol. 149, No. 3-4, 2009, pp. 325-334. doi:10.1016/j.geoderma.2008.12.015 [18] K. L. Sharma, G. Kussuma, M. Uttam Kumar, N. G. Pavin, K. Sinvras, G. R. Korwar, V. Hima Bindu, V. Ramesh, R. Kausalya and S. K. Yadav, “Evaluation of Long-Term Soil Management Practices Using Key Indi- cators and Soil Quality Indexes in a Semi-Arid Tro- pical Alfisol,” Australian Journal of Soil Research, Vol. 46, 2008, pp. 368-377. doi:10.1071/SR07184 [19] G. R. Blake, “Bulk density,” In: C. A. Black, Ed., Meth- ods of Soil Analysis, Part I, Physical and Minera- logical Properties, including Statistics of Measurement and Sampling, American Society of Agronomy, Madison, WI, USA, 1965, pp. 374-395. [20] G. J. Bouyoucos, “The Hydrometer as a New Method for the Mechanical Analysis of Soils,” Soil Science, Vol. 23, 1972, pp. 343-352. doi:10.1097/00010694-192705000-00002 [21] L. De Leenheer and M. De Boodt, “Determination of Aggregate Stability by the Change in Mean Weight Di- ameter,” International Symposium on Soil Structure, Gent. Proceeding, Vol. 24, 1958, pp. 290-300. [22] R. H. Bray and L. T. Kurtz, “Determination of Total, Organic and Available Forms of Phosphorus in Soils,” Soil Science, Vol. 59, No. 1, 1945, pp. 39-45. doi:10.1097/00010694-194501000-00006 [23] D. W. Nelson and L. E. Sommers, “Total Carbon, Or- ganic Carbon and Organic Matter,” In: D. L. Sparks, Ed., Methods of Soil Analysis, Part 3, Chemical Methods, Soil Copyright © 2011 SciRes. JEP  A Soil Quality Index to Evaluate the Vermicompost Amendments Effects on Soil Properites Copyright © 2011 SciRes. JEP 510 Science Society of America, Madison, WI, USA, 1996, pp. 961-1010. [24] C. A. Cambardella and E. T. Elliott, “Particulate Soil Organic-Matter across a Grassland Cultivation Sequen- ce,” Soil Science Society of America Journal, Vol. 56, 1992, pp. 777-783. doi:10.2136/sssaj1992.03615995005600030017x [25] R. J. Haynes, “Labile Organic Matter Fractions as a Cen- tral Component of the Quality of Agricultural Soils: An Overview,” Advances in Agronomy, Vol. 85, 2005, pp. 221-268. doi:10.1016/S0065-2113(04)85005-3 [26] D. S. Jenkinson and D. S. Powlson, “The Effects of Bio- cidal Treatments on Metabolism in Soil. V. A Method for Measuring Soil Biomass,” Soil Biology and Bio- chemis- try, Vol. 8, 1976, pp. 209-213. doi:10.1016/0038-0717(76)90005-5 [27] E. D. Vance, P. C. Brookes and D. S. Jenkinson, “An Extraction Method for Measuring Soil Microbial Biomass C,” Soil Biology & Biochemistry, Vol. 19, No. 6, 1987, pp. 703-707. [28] F. Caravaca, G. Masciandaro and B. Ceccanti, “Land Use in Relation to Soil Chemical and Biochemical Properties in a Semiarid. Mediterranean Environment,” Soil and Tillage Research , Vol. 68, 2002, pp. 23-30. doi:10.1016/S0167-1987(02)00080-6 [29] J.K. Whalen, Q. Hu and A. Liu, “Compost Applications Increase Water-Stable Aggregates in Conventional and No-Tillage Systems,” Soil Science Society of America Journal, Vol. 67, 2003, pp. 1842-1847. doi:10.2136/sssaj2003.1842 [30] P. K. Padmavathiamma, L. Y. Li and U. R. Kumari, “An Experimental Study of Vermi-Biowaste Composting for Agricultural Soil Improvement,” Bioresurce technology, Vol. 99, No. 6, 2008, pp. 1672-1681. [31] W. Devliegher and W. Verstraete, “The Effect of Lum- bricus Terrestris on Soil in Relation to Plant Growth: Ef- fects of Nutrient Enrichment Processes and Gut Associ- ated Processes,” Soil Biology & Biochemistry, Vol. 29, 1997, pp. 341-346. doi:10.1016/S0038-0717(96)00096-X [32] J. Leifeld, S. Siebert and R. I. Kögel-Knabner, “Stabiliza- tion of Composted Organic Matter after Application to a Humus-Free Sandy Mining Soil,” Journal of Environ- mental Quality, Vol. 30, 2001, pp. 602-607. doi:10.2134/jeq2001.302602x [33] D. A. Laird, D. A., Martens and W. L. Kingery, “Nature of Clay-Humic Complexes in an Agricultural Soil. I. Chemical, Biochemical, and Spectroscopic Analyses,” Soil Science Society of America Journal, Vol. 65, No. 5, 2001, pp. 1413-1418. doi:10.2136/sssaj2001.6551413x [34] A. Fortuna, R. R. Harwood and E. A. Paul, “The Effects of Compost and Crop Rotation on Carbon Turnover and the Particulate Organic Matter Fraction,” Soil Science, Vol. 168, No. 6, 2003, pp. 434-444. [35] D. G. Fraser, J. W. Doran, W. W. Sahs and G. W. Leosing, “Soil Microbial Population and Activity Under Conventional and Organic Management,” Journal of Environmental Quality, Vol. 17, No. 4, 1988, pp. 585- 590. [36] M. J. Kirckner, A. G. Wollum and L. D. King, “Soil Mi- crobial Populations and Activities in Reduced Che- mical Input Agroecosystem,” Soil Science Society of America Journal, Vol. 57, 5, 1993, pp. 1289-1295. doi:10.2136/sssaj1993.03615995005700050021x [37] L. Leita, M. De Nobili, C. Mondini, G. Muhlbachova, L. Marchiol, G. Bragato and M. Cotin, “Influence of Inor- ganic and Organic Fertilization on Soil Microbial Bio- mass, Metabolic Quotient and Heavy Metal Bio- avail- ability,” Biology and Fertility of Soils, Vol. 28, 1999, pp. 371-376. doi:10.1007/s003740050506 [38] T. Marika, J. Truua and M. Ivask, “Soil micRobiological and Biochemical Properties for Assessing the Effect of Agricultural Management Practices in Estonian Culti- vated Soils,” European Journal of Soil Biology, Vol. 44, No. 2, 2008, pp. 231-237. doi:10.1016/j.ejsobi.2007.12.003 [39] C. Macci, S. Doni, E. Peruzzi, G. Masciandaro, C. Mennone and B. Ceccanti, “Almond Tree and Organic Fertilization for Soil Quality Improvement in Southern It- aly,” Journal of Environmental Management, 2010, pp. 1-8, Article in Press.
|