Paper Menu >>
Journal Menu >>
 Energy and Power Engineering, 2009, 21-27 doi:10.4236/epe.2009.11004 Published Online August 2009 (http://www.scirp.org/journal/epe) Copyright © 2009 SciRes EPE Fault Detection Based on Hierarchical Cluster Analysis in Wide Area Backup Protection System Yagang ZHANG, Jinfang ZHANG, Jing MA, Zengping WANG Key Laboratory of Power System Protection and Dynamic Security Monitoring and Control under Ministry of Education, North China Electric Power University, Baoding, China Email: yagangzhang@gmail.com Abstract: In wide area backup protection of electric power systems, the prerequisite of protection device’s accurate, fast and reliable performance is its corresponding fault type and fault location can be discriminated quickly and defined exactly. In our study, global information will be introduced into the backup protection system. By analyzing and computing real-time PMU measurements, basing on cluster analysis theory, we are using mainly hierarchical cluster analysis to search after the statistical laws of electrical quantities’ marked changes. Then we carry out fast and exact detection of fault components and fault sections, and finally ac- complish fault isolation. The facts show that the fault detection of fault component (fault section) can be per- formed successfully by hierarchical cluster analysis and calculation. The results of hierarchical cluster analy- sis are accurate and reliable, and the dendrograms of hierarchical cluster analysis are in intuition. Keywords: wide area backup protection, phasor measurement unit, PMU, wide area measurement system, WAMS, fault detection, cluster analysis 1 Introduction Electric power system is one of the most complex artifi- cial systems in this world, which safe, steady, economi- cal and reliable operation plays a very important part in guaranteeing socioeconomic development, even in safe- guarding social stability. In early 2008, the infrequent disaster of snow and ice that occurred in the south of China had confirmed it again. The complexity of electric power system is determined by its characteristics about constitution, configuration, operation, organization, etc., which has caused many disastrous accidents, such as the large-scale blackout of America-Canada electric power system on August 14, 2003, the large-scale blackout of Chinese Hainan electricity grid on September 26, 2005. In order to resolve this difficult problem, some methods and technologies that can reflect modern science and technology level have been introduced into this domain, such as computer and communication technology, con- trol technology, superconduct and new materials tech- nology and so on. Obviously, no matter what we adopt new analytical method or technical means, we must have a distinct recognition of electric power system itself and its complexity, and increase continuously analysis, op- eration and control level [1-3]. Relay protection is the first line of guaranteeing large- scale electricity grid’s safety. The faults in electric power system are inevitable. If protection devices can operate rightly, quickly and reliably, the deterioration of system status will be checked effectively, then it will play a de- cisive role to protect electricity grid’s safe operation. Otherwise, it will accelerate system crashes, as a result, large-scale and long-time power blackout will continue. After counting seventeen years accident data in electric power system, North American Electric Reliability Council (NERC) has found: 63% accidents in electric power system are concerned with the incorrect operation of relay protection. The large-scale power blackouts oc- curred in China and other countries of the last thirty years have also indicated: the large-scale power blackout accidents are often raised from the improper cooperation  Y. ZHANG, J. F. ZHANG, J. MA, Z. P. WANG Copyright © 2009 SciRes EPE 22 or chain reaction of protection devices. The large-scale blackout of America-Canada electric power system was just because the removal of four connection lines be- tween Akron and Cleveland in northern Ohio by backup protection for overload, and the accident spread rapidly. The backup protection in current electricity grid is only reflecting the information of protection installation posi- tion, which will be affected by topological connecting relations and operation modes. In order to guarantee its reliability, we can only carry through configuration and setting according to the most rigorous condition. In order to guarantee its selectivity, we have to sacrifice the ra- pidity and sensitivity of backup protection [4][5]. In re- cent years, the appearance of wide area measurement system (WAMS) affords the possibility for introducing system information into backup protection system. WAMS can obtain synchronously electrical measure- ments in the whole power system, and realize power system dynamic process monitoring and control. It can also decrease the update speed of measurements from seconds to tens of millisecond, and create condition to realize power system dynamic process control, which will help us carry through backup protection design based on global optimal angles of electricity grid, and afford the possibility for resolving dynamic security monitoring, control and protection of complex large- scale electricity grid. When electric power system operates from normal state to failure or abnormal operates, its electric quanti- ties (current magnitude, voltage magnitude and their angles, etc.) may change significantly. In our researches, global information will be introduced into the backup protection system. After some accidents, utilizing real-time measurements of phasor measurement unit (PMU) [6-10], basing on multivariate statistical analysis theory [11-13], we are using mainly cluster analysis technology [14-19], and seeking after for statistical laws of electrical quantities’ marked changes. Then we can carry out fast and exact detection of fault components and fault sections, and hereby ascertain protection com- ponents associated with them. Finally we can accomplish fast and exact fault isolation. The cluster analysis theory is one of multivariate sta- tistical analysis theory, which is a synthetical analysis theory. In recent years, as the development of computer application technology and the demand of scientific re- search and production, multivariate statistical analysis theory has been applied successfully to many researches of various fields, such as geology, weather, hydrology, iatrology, industry, agriculture, and economy, etc. It has been an efficient theory that can resolve different kinds of complex problems. Basing on statistical theory, we have carried out large numbers of basic researches in nonlinear dynamical systems [20-22]. In this paper, we are using mainly cluster analysis of multivariate statisti- cal analysis theory to resolve fault detection problem in wide area backup protection of electric power systems. 2 Cluster Analysis Theory Theories of classification come from philosophy, mathe- matics, statistics, psychology, computer science, linguis- tics, biology, medicine, and other areas. Cluster analysis can also be named classification, which is concerned with researching the relationships within a group of ob- jects in order to establish whether or not the data can be summarized validly by a small number of clusters of similar objects. That is, cluster analysis encompasses the methods used to: Identify the clusters in the original data; Determine the number of clusters in the original data; Validate the clusters found in the original data. Cluster analysis has great strength in data analysis and has been applied successfully to the researches of various fields. Suppose there are samples, each sample has indexes (variables), the observation data can be expressed as, n m (1,,, 1,,) ij x injm  Y. ZHANG, J. F. ZHANG, J. MA, Z. P. WANG Copyright © 2009 SciRes EPE 23 In these data, the definition of mean is: 1 1 (1,2,, n jtj t ) x xj m n the definition of standard deviation is: 2 1 1() (1,2,, 1 n jtjj t Sxxj n )m . 2.1 The Distance and Similar Coefficient Between Samples The most commonly used measurement that describes the degree of relationship is distance, is usually denoted the distance between samples ij d ()i X and ()j X , the general demands are: (1). 0, ij d for arbitrary ,ij , and ()( )j X ; 0 ij i dX (2). , ij ji dd for arbitrary ,ij ; (3). , for arbitrary ,,ijk(Triangle inequality). ijik kj ddd The distance definitions in common use include: 1) Minkovski distance 1 1 ()[] ( ,1,2,,) mqq ijit jt t dqx x ij n . 2) Lance distance () 0 ij x 1 1 (), () ( ,1,2,,) mit jt ij tit jt xx dL mxx ij n . This is a measure without dimension, and it is insensi- tive to big singular values. 3) Mahalanobis distance 1 ()()()() ()()() (,1,2,,) iji ji j dMX XSX X ij n . Hereinto, is an inverses matrix of samples’ co- variance matrix. 1 S 4) Oblique space distance In order to overcome the influence of relativity be- tween variables, one can define the distance of oblique space: 1 2 2 11 1 [()() ( ,1,2,,) mm ijikjkiljl kl kl dxxxx m ij n ] r . Hereinto, is the correlation coefficient between kl r k X and l X . 2.2 The Similar Coefficient and Distance Between Variables Suppose can be expressed as the similar coefficient between ij C i X and j X , the general demands are: (1). 0,1 ( iji j CXaXa constant); (2). 1, ij C for arbitrary ,ij; (3). , ij ji CC for arbitrary ,ij. ij C close to one means that i X and j X have near relationship, otherwise, close to zero means that they have distant relationship. The similar coefficients in common use are included angle Cosine and correlation coefficient. ij C 1) Included angle Cosine These observed values ( n12 ,,, ii ni x xx) of i X can be regarded as vectors in -dimensional space, and the angle n ij ’s Cosine ofi X and j X is called simi- lar coefficient of these two variables, namely 1 22 11 (1)[ ] (,1,2,,) n ti tj t ijij nn ti tj tt xx CCos x x ij m . 2) Correlation coefficient The correlation coefficient is just the included angle Cosine after the data have been standardized. is ex- pressed in common use the correlation coefficient of ij r i X and j X , here we define it as , (2) ij C 1 22 11 ()( ) (2) ()( ) ( ,1,2,,) n tii tjj t ij nn ti itjj tt xxxx C xx xx ij m . 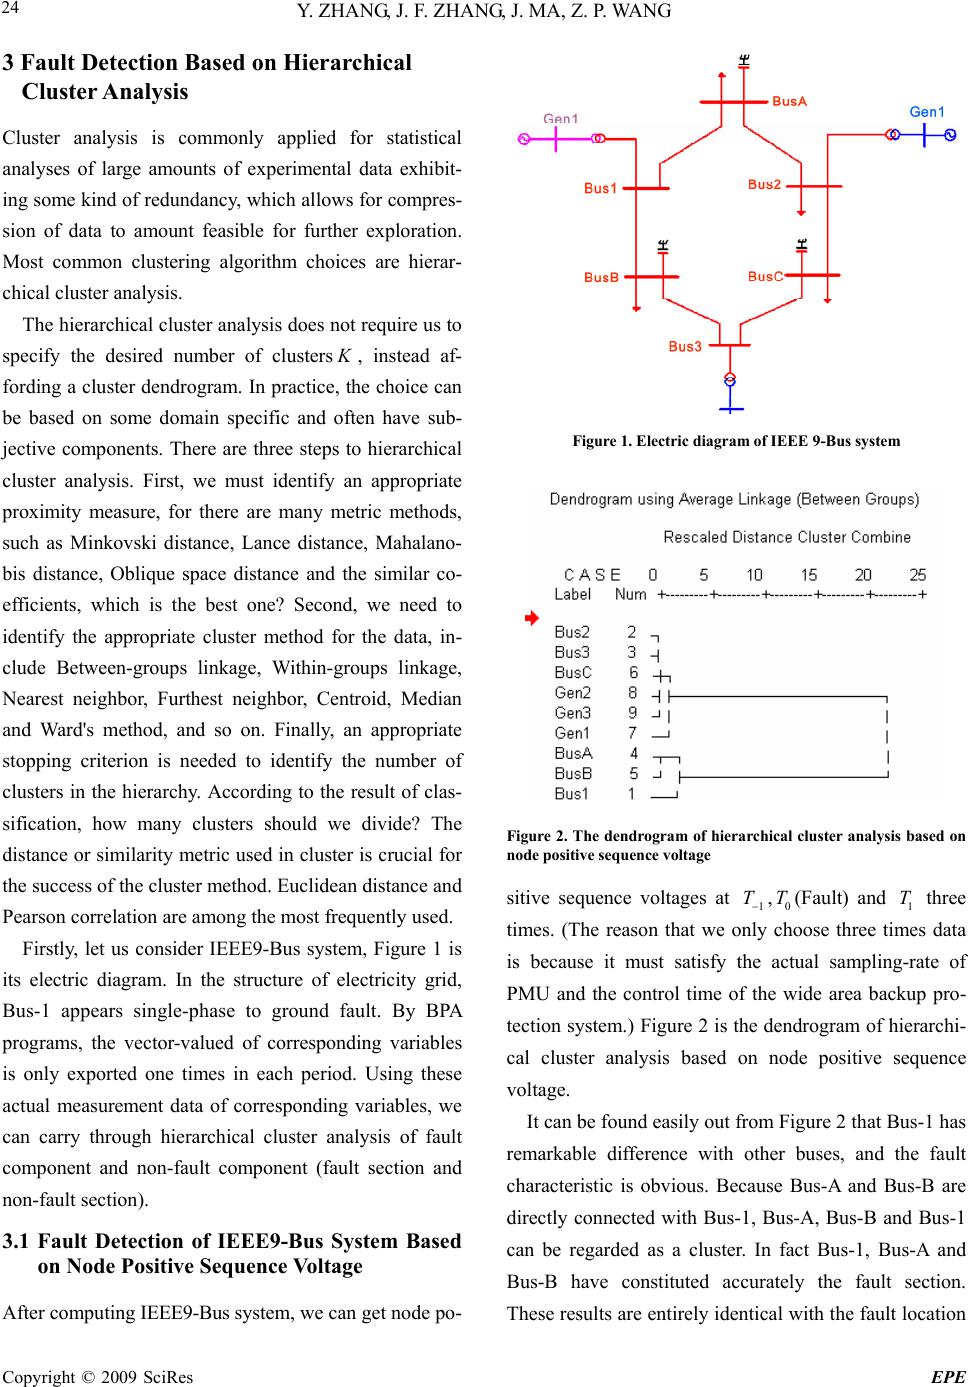 Y. ZHANG, J. F. ZHANG, J. MA, Z. P. WANG Copyright © 2009 SciRes EPE 24 3 Fault Detection Based on Hierarchical Cluster Analysis Cluster analysis is commonly applied for statistical analyses of large amounts of experimental data exhibit- ing some kind of redundancy, which allows for compres- sion of data to amount feasible for further exploration. Most common clustering algorithm choices are hierar- chical cluster analysis. The hierarchical cluster analysis does not require us to specify the desired number of clusters K , instead af- fording a cluster dendrogram. In practice, the choice can be based on some domain specific and often have sub- jective components. There are three steps to hierarchical cluster analysis. First, we must identify an appropriate proximity measure, for there are many metric methods, such as Minkovski distance, Lance distance, Mahalano- bis distance, Oblique space distance and the similar co- efficients, which is the best one? Second, we need to identify the appropriate cluster method for the data, in- clude Between-groups linkage, Within-groups linkage, Nearest neighbor, Furthest neighbor, Centroid, Median and Ward's method, and so on. Finally, an appropriate stopping criterion is needed to identify the number of clusters in the hierarchy. According to the result of clas- sification, how many clusters should we divide? The distance or similarity metric used in cluster is crucial for the success of the cluster method. Euclidean distance and Pearson correlation are among the most frequently used. Firstly, let us consider IEEE9-Bus system, Figure 1 is its electric diagram. In the structure of electricity grid, Bus-1 appears single-phase to ground fault. By BPA programs, the vector-valued of corresponding variables is only exported one times in each period. Using these actual measurement data of corresponding variables, we can carry through hierarchical cluster analysis of fault component and non-fault component (fault section and non-fault section). 3.1 Fault Detection of IEEE9-Bus System Based on Node Positive Sequence Voltage After computing IEEE9-Bus system, we can get node po- Figure 1. Electric diagram of IEEE 9-Bus system Figure 2. The dendrogram of hierarchical cluster analysis based on node positive sequence voltage sitive sequence voltages at ,(Fault) and three times. (The reason that we only choose three times data is because it must satisfy the actual sampling-rate of PMU and the control time of the wide area backup pro- tection system.) Figure 2 is the dendrogram of hierarchi- cal cluster analysis based on node positive sequence voltage. 1 T0 T1 T It can be found easily out from Figure 2 that Bus-1 has remarkable difference with other buses, and the fault characteristic is obvious. Because Bus-A and Bus-B are directly connected with Bus-1, Bus-A, Bus-B and Bus-1 can be regarded as a cluster. In fact Bus-1, Bus-A and Bus-B have constituted accurately the fault section. These results are entirely identical with the fault location 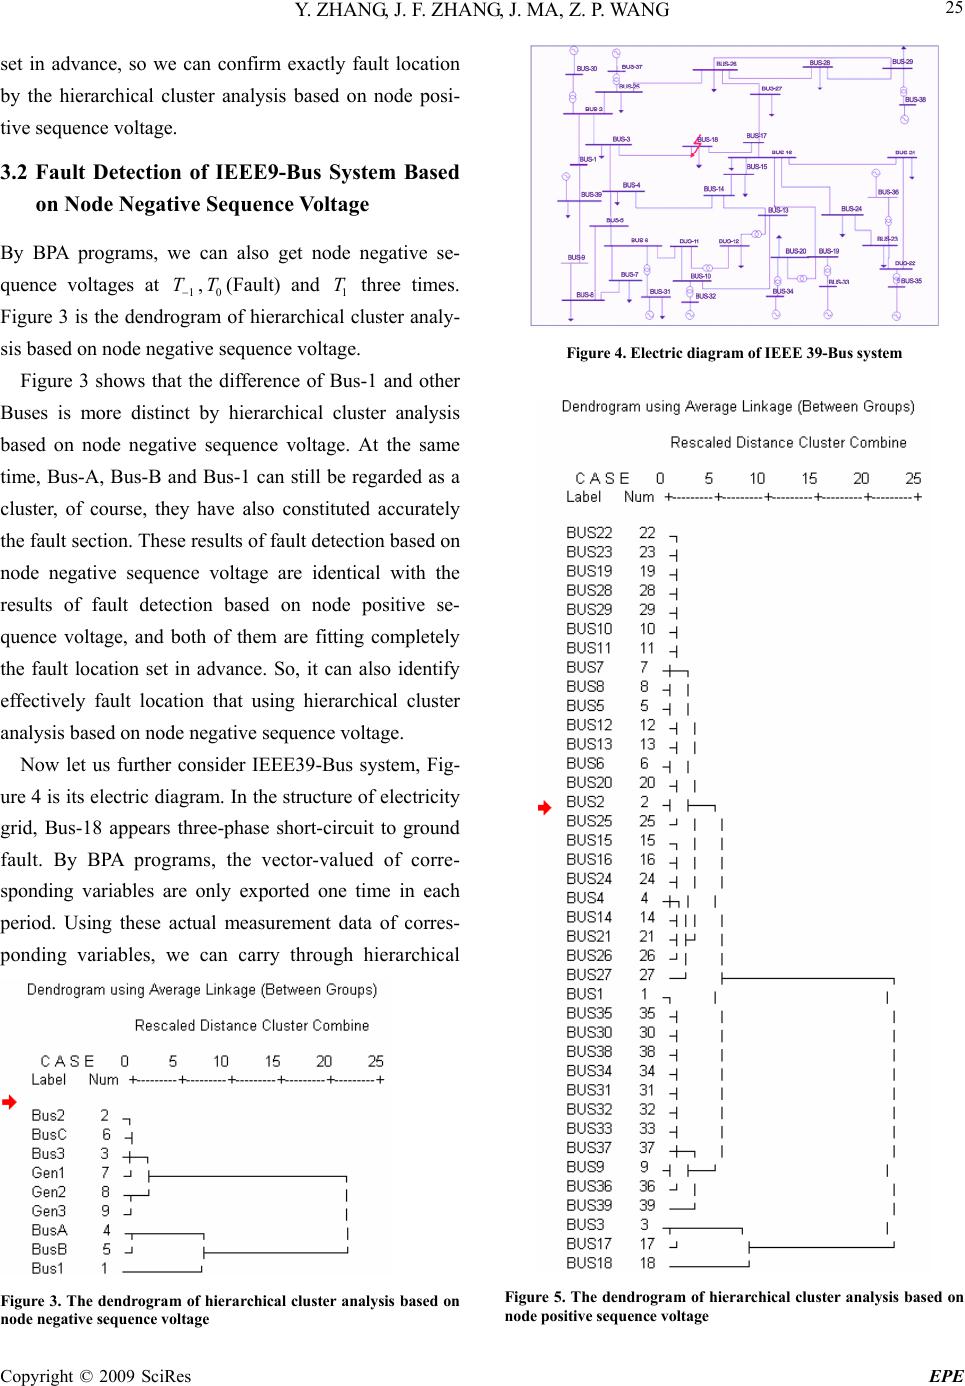 Y. ZHANG, J. F. ZHANG, J. MA, Z. P. WANG Copyright © 2009 SciRes EPE 25 set in advance, so we can confirm exactly fault location by the hierarchical cluster analysis based on node posi- tive sequence voltage. 3.2 Fault Detection of IEEE9-Bus System Based on Node Negative Sequence Voltage By BPA programs, we can also get node negative se- quence voltages at ,(Fault) and three times. Figure 3 is the dendrogram of hierarchical cluster analy- sis based on node negative sequence voltage. 1 T0 T1 T Figure 3 shows that the difference of Bus-1 and other Buses is more distinct by hierarchical cluster analysis based on node negative sequence voltage. At the same time, Bus-A, Bus-B and Bus-1 can still be regarded as a cluster, of course, they have also constituted accurately the fault section. These results of fault detection based on node negative sequence voltage are identical with the results of fault detection based on node positive se- quence voltage, and both of them are fitting completely the fault location set in advance. So, it can also identify effectively fault location that using hierarchical cluster analysis based on node negative sequence voltage. Now let us further consider IEEE39-Bus system, Fig- ure 4 is its electric diagram. In the structure of electricity grid, Bus-18 appears three-phase short-circuit to ground fault. By BPA programs, the vector-valued of corre- sponding variables are only exported one time in each period. Using these actual measurement data of corres- ponding variables, we can carry through hierarchical Figure 3. The dendrogram of hierarchical cluster analysis based on node negative sequence voltage Figure 4. Electric diagram of IEEE 39-Bus system Figure 5. The dendrogram of hierarchical cluster analysis based on node positive sequence voltage 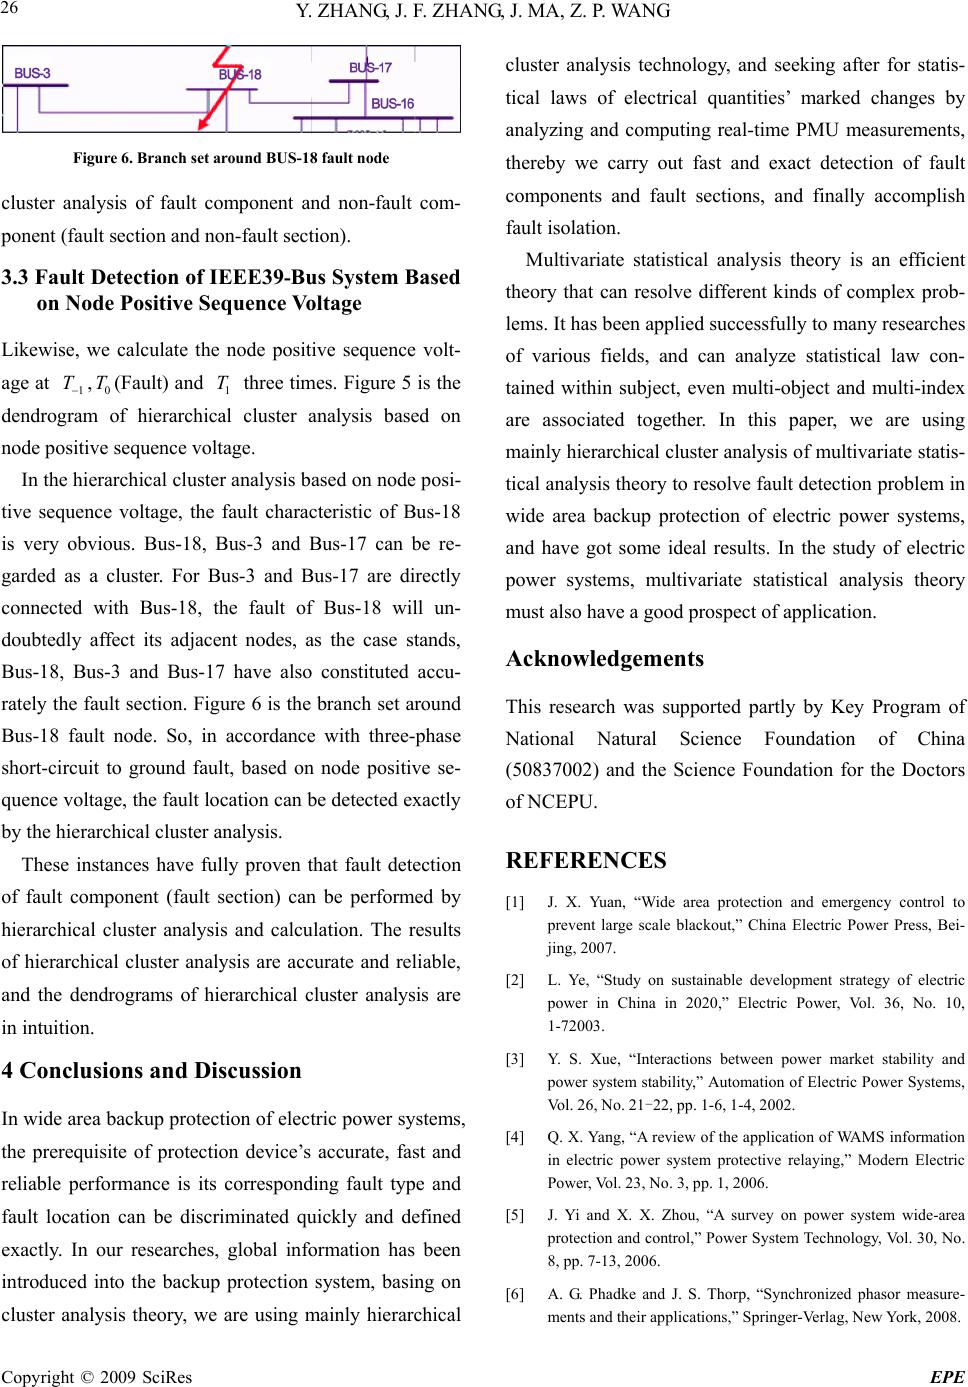 Y. ZHANG, J. F. ZHANG, J. MA, Z. P. WANG Copyright © 2009 SciRes EPE 26 Figure 6. Branch set around BUS-18 fault node cluster analysis of fault component and non-fault com- ponent (fault section and non-fault section). 3.3 Fault Detection of IEEE39-Bus System Based on Node Positive Sequence Voltage Likewise, we calculate the node positive sequence volt- age at ,(Fault) and three times. Figure 5 is the dendrogram of hierarchical cluster analysis based on node positive sequence voltage. 1 T0 T1 T In the hierarchical cluster analysis based on node posi- tive sequence voltage, the fault characteristic of Bus-18 is very obvious. Bus-18, Bus-3 and Bus-17 can be re- garded as a cluster. For Bus-3 and Bus-17 are directly connected with Bus-18, the fault of Bus-18 will un- doubtedly affect its adjacent nodes, as the case stands, Bus-18, Bus-3 and Bus-17 have also constituted accu- rately the fault section. Figure 6 is the branch set around Bus-18 fault node. So, in accordance with three-phase short-circuit to ground fault, based on node positive se- quence voltage, the fault location can be detected exactly by the hierarchical cluster analysis. These instances have fully proven that fault detection of fault component (fault section) can be performed by hierarchical cluster analysis and calculation. The results of hierarchical cluster analysis are accurate and reliable, and the dendrograms of hierarchical cluster analysis are in intuition. 4 Conclusions and Discussion In wide area backup protection of electric power systems, the prerequisite of protection device’s accurate, fast and reliable performance is its corresponding fault type and fault location can be discriminated quickly and defined exactly. In our researches, global information has been introduced into the backup protection system, basing on cluster analysis theory, we are using mainly hierarchical cluster analysis technology, and seeking after for statis- tical laws of electrical quantities’ marked changes by analyzing and computing real-time PMU measurements, thereby we carry out fast and exact detection of fault components and fault sections, and finally accomplish fault isolation. Multivariate statistical analysis theory is an efficient theory that can resolve different kinds of complex prob- lems. It has been applied successfully to many researches of various fields, and can analyze statistical law con- tained within subject, even multi-object and multi-index are associated together. In this paper, we are using mainly hierarchical cluster analysis of multivariate statis- tical analysis theory to resolve fault detection problem in wide area backup protection of electric power systems, and have got some ideal results. In the study of electric power systems, multivariate statistical analysis theory must also have a good prospect of application. Acknowledgements This research was supported partly by Key Program of National Natural Science Foundation of China (50837002) and the Science Foundation for the Doctors of NCEPU. REFERENCES [1] J. X. Yuan, “Wide area protection and emergency control to prevent large scale blackout,” China Electric Power Press, Bei- jing, 2007. [2] L. Ye, “Study on sustainable development strategy of electric power in China in 2020,” Electric Power, Vol. 36, No. 10, 1-72003. [3] Y. S. Xue, “Interactions between power market stability and power system stability,” Automation of Electric Power Systems, Vol. 26, No. 21-22, pp. 1-6, 1-4, 2002. [4] Q. X. Yang, “A review of the application of WAMS information in electric power system protective relaying,” Modern Electric Power, Vol. 23, No. 3, pp. 1, 2006. [5] J. Yi and X. X. Zhou, “A survey on power system wide-area protection and control,” Power System Technology, Vol. 30, No. 8, pp. 7-13, 2006. [6] A. G. Phadke and J. S. Thorp, “Synchronized phasor measure- ments and their applications,” Springer-Verlag, New York, 2008.  Y. ZHANG, J. F. ZHANG, J. MA, Z. P. WANG Copyright © 2009 SciRes EPE 27 [7] T. S. Bi, X. H. Qin, and Q. X. Yang, “A novel hybrid state esti- mator for including synchronized phasor measurements,” Elec- tric Power Systems Research, Vol. 78, No. 8, pp. 1343-1352, 2008. [8] C. Wang, C. X. Dou, X. B. Li, and Q. Q. Jia, “A WAMS/PMU-based fault location technique,” Electric Power Systems Research, Vol. 77, No. 8, pp. 936-945, 2007. [9] C. Rakpenthai, S. Premrudeepreechacharn, S. Uatrongjit, and N. R. Watson, “Measurement placement for power system state es- timation using decomposition technique,” Electric Power Sys- tems Research, Vol. 75, No. 1, pp. 41-49, 2005. [10] J. N. Peng, Y. Z. Sun, and H. F. Wang, “Optimal PMU placement for full network observability using Tabu search algorithm,” In- ternational Journal of Electrical Power & Energy Systems, Vol. 28, No. 4, pp. 223-231, 2006. [11] X. Q. He, “Morden statistical analysis methods and applica- tions,” China Renmin University Press, Beijing, 2007. [12] X. L. Yu and X. S. Ren, “Multivariate statistical analysis,” China Statistic Press, Beijing, 1998. [13] Y. T. Zhang and K. T. Fang, “Introduction to multivariate statis- tical analysis,” Science Press, Beijing, 1982. [14] A. Z. Arifin and A. Asano, “Image segmentation by histogram thresholding using hierarchical cluster analysis,” Pattern Recog- nition Letters, Vol. 27, No. 13, pp. 1515-1521, 2006. [15] X. Otazu and O. Pujol, “Wavelet based approach to cluster analysis: Application on low dimensional data sets,” Pattern Recognition Letters, Vol. 27, NO. 14, pp.1590-1605, 2006. [16] H. S. Park and D. K. Baik, “A study for control of client value using cluster analysis,” Journal of Network and Computer Ap- plications, Vol. 29, No. 4, pp. 262-276, 2006. [17] V. Tola, F. Lillo, M. Gallegati, and R. N. Mantegna, “Cluster analysis for portfolio optimization,” Journal of Economic Dy- namics and Control, Vol. 32, No. 1, pp. 235-258, 2008. [18] W. X. Zhao, P. K. Hopke, and K. A. Prather, “Comparison of two cluster analysis methods using single particle mass spectra,” Atmospheric Environment, Vol. 42, No. 5, pp. 881-892, 2008. [19] M. Templ, P. Filzmoser, and C. Reimann, “Cluster analysis ap- plied to regional geochemical data: Problems and possibilities,” Applied Geochemistry, Vol. 23, No. 8, pp. 2198-2213, 2008. [20] Y. G. Zhang, P. Zhang, and H. F. Shi, “Statistic character in nonlinear systems,” Proceedings of the Sixth International Con- ference on Machine Learning and Cybernetics, Hong Kong, Vo l . 5, pp. 2598-2602, 2007. [21] Y. G. Zhang, C. J. Wang, and Z. Zhou, “Inherent randomicity in 4-symbolic dynamics,” Chaos, Solitons and Fractals, Vol. 28, No. 1, pp. 236-243, 2006. [22] Y. G. Zhang and C. J. Wang, “Multiformity of inherent ran- domicity and visitation density in n-symbolic dynamics,” Chaos, Solitons and Fractals, Vol. 33, No. 2, pp. 685-694, 2007. |

