 Journal of Environmental Protection, 2011, 2, 537-544 doi:10.4236/jep.2011.25062 Published Online July 2011 (http://www.scirp.org/journal/jep) Copyright © 2011 SciRes. JEP Dynamic Emission of CH4 from a Rice-Duck Farming Ecosystem Jia-En Zhang1, Ying Ouyang2, Zhao-Xiang Huang1, Guo-Ming Quan1 1Department of Ecology, College of Agriculture, South China Agricultural University, Guangzhou, China; 2USDA Forest Service, Mississippi State, USA. Email: youyang@fs.fed.us, jeanzh@scau.edu.cn Received March 7th, 2011; revised April 15th, 2011; accepted May 22nd, 2011. ABSTRACT Global climatic change induced by emissions of greenhouse gases from human activities is an issue of increasing in- ternational environmental concerns, and agricultural practices and managements are the important contributors for such emissions. This study investigated dynamic emission of methane (CH4) from a paddy field in a rice-duck farming ecosystem. Three different cultivation treatments, namely the organic fertilizer + duck (OF+D), chemical fertilizer + duck (CF + D), and chemical fertilizer (Control) treatments , were employed in this study. Experimental data showed that hourly variations of CH4 emission from the paddy field during the day were somewhat positively correlated (R2 = 0.7 for the OF + D treatment and R2 = 0.6 for the CF+D treatment) to the hourly changes in air temperatures in addi- tion to the influences of the duck activities. The rate of CH4 emission for the CF+D treatment was higher than that of the Control treatment at the tillering stage, whereas the opposite was true at the heading stage. In contrary, the rate of CH4 emission for the OF + D treatment was always higher than that of the Control treatment regardless the tillering or heading stage. Our study revealed that the rate of CH4 emission depended not only on air temperature but also on the rice growth stage. A 6.7% decrease in CH4 emission and in global warming potential (GWP) was observed for the CF + D treatment as compared to the Control treatment. This study suggested that although the impacts of duckling on the emission of CH4 depended on the rice growth stage and air temperature regime, the introduction of ducks into the rice farming system in general mitigated the overall CH4 emission and thereby the GWP. Keywords: Methane Emission, Global Warming Potential, Rice-Duck Farming 1. Introduction Global warming, resulted from the elevated concentra- tions of greenhouse gases in the atmosphere, has emerged as the most prominent global environment issue. While many gases have been examined, only three of them, namely carbon dioxide (CO2), methane (CH4), and ni- trous oxide (N2O), were identified to have significant global warming potential (GWP) [1]. These gases have strong infrared absorption capacity and trap part of the thermal radiation from earth’s surface. Methane is an important greenhouse gas and has approximately 25 times more infrared absorption capacity or GWP than that of CO2 on a molecule basis [2,3]. It has been reported that the atmospheric concentration of CH4 increased from 1.50 to 1.72 ppm during the last decades [4,5] and con- tributed 5% toward the enhanced global warming [6]. Methane is produced naturally in soils through the mi- crobial processes. Under the anaerobic conditions, a type of soil organisms or methanogens can transform some of the soil organic matter into CH4 through the following two pathways: 1) CH3COOH → CH4 + CO2, and 2) CO2 +4H2 → CH4 + 2H2O) [7,8]. Meanwhile, methane can also be oxidized by another type of soil organisms or methanotrophs into CO2. Therefore, soil CH4 emission into the atmosphere is a net result of CH4 production and CH4 oxidation [9,10]. In addition, soil temperature re- gime and organic carbon content are the major environ- mental factors affecting the emission of CH4 into the atmosphere. Although the dominant source of anthropogenic CO2 is from fossil fuel burning, various agricultural activities in general and wetland rice agricultural practices in parti- cular are the major sources of CH4 emissions [11-14]. This source has increased in recent years due to the ex- pansion of rice cultivation in Southeast Asia [15,16]. The amount of CH4 emission from paddy fields is estimated to be 10% - 20% of the total CH4 emission [17,18]. 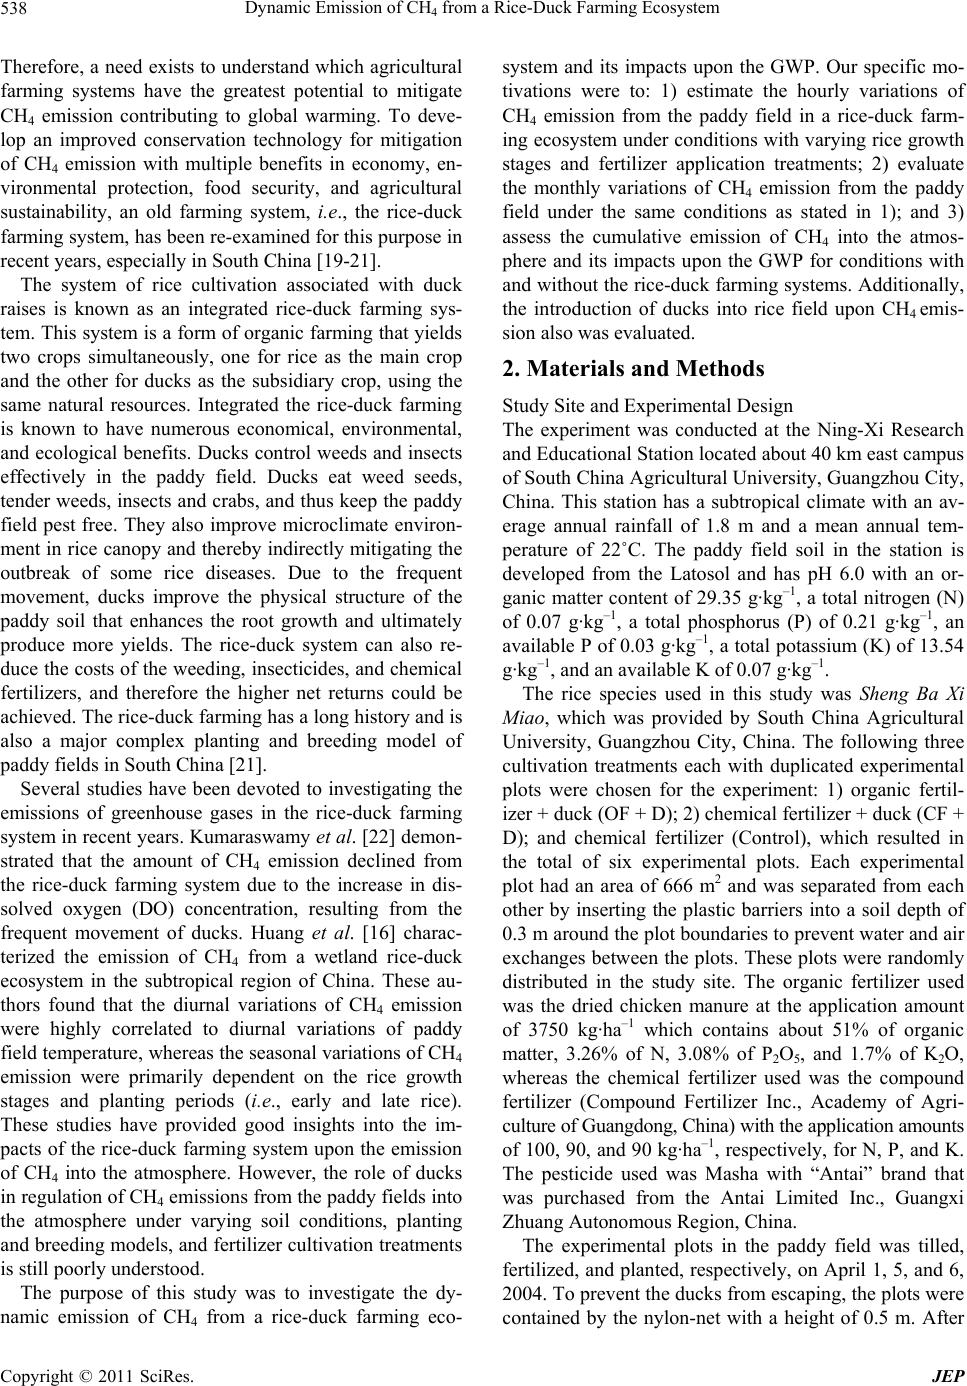 Dynamic Emission of CH from a Rice-Duck Farming Ecosystem 538 4 Therefore, a need exists to understand which agricultural farming systems have the greatest potential to mitigate CH4 emission contributing to global warming. To deve- lop an improved conservation technology for mitigation of CH4 emission with multiple benefits in economy, en- vironmental protection, food security, and agricultural sustainability, an old farming system, i.e., the rice-duck farming system, has been re-examined for this purpose in recent years, especially in South China [19-21]. The system of rice cultivation associated with duck raises is known as an integrated rice-duck farming sys- tem. This system is a form of organic farming that yields two crops simultaneously, one for rice as the main crop and the other for ducks as the subsidiary crop, using the same natural resources. Integrated the rice-duck farming is known to have numerous economical, environmental, and ecological benefits. Ducks control weeds and insects effectively in the paddy field. Ducks eat weed seeds, tender weeds, insects and crabs, and thus keep the paddy field pest free. They also improve microclimate environ- ment in rice canopy and thereby indirectly mitigating the outbreak of some rice diseases. Due to the frequent movement, ducks improve the physical structure of the paddy soil that enhances the root growth and ultimately produce more yields. The rice-duck system can also re- duce the costs of the weeding, insecticides, and chemical fertilizers, and therefore the higher net returns could be achieved. The rice-duck farming has a long history and is also a major complex planting and breeding model of paddy fields in South China [21]. Several studies have been devoted to investigating the emissions of greenhouse gases in the rice-duck farming system in recent years. Kumaraswamy et al. [22] demon- strated that the amount of CH4 emission declined from the rice-duck farming system due to the increase in dis- solved oxygen (DO) concentration, resulting from the frequent movement of ducks. Huang et al. [16] charac- terized the emission of CH4 from a wetland rice-duck ecosystem in the subtropical region of China. These au- thors found that the diurnal variations of CH4 emission were highly correlated to diurnal variations of paddy field temperature, whereas the seasonal variations of CH4 emission were primarily dependent on the rice growth stages and planting periods (i.e., early and late rice). These studies have provided good insights into the im- pacts of the rice-duck farming system upon the emission of CH4 into the atmosphere. However, the role of ducks in regulation of CH4 emissions from the paddy fields into the atmosphere under varying soil conditions, planting and breeding models, and fertilizer cultivation treatments is still poorly understood. The purpose of this study was to investigate the dy- namic emission of CH4 from a rice-duck farming eco- system and its impacts upon the GWP. Our specific mo- tivations were to: 1) estimate the hourly variations of CH4 emission from the paddy field in a rice-duck farm- ing ecosystem under conditions with varying rice growth stages and fertilizer application treatments; 2) evaluate the monthly variations of CH4 emission from the paddy field under the same conditions as stated in 1); and 3) assess the cumulative emission of CH4 into the atmos- phere and its impacts upon the GWP for conditions with and without the rice-duck farming systems. Additionally, the introduction of ducks into rice field upon CH4 emis- sion also was evaluated. 2. Materials and Methods Study Site and Experimental Design The experiment was conducted at the Ning-Xi Research and Educational Station located about 40 km east campus of South China Agricultural University, Guangzhou City, China. This station has a subtropical climate with an av- erage annual rainfall of 1.8 m and a mean annual tem- perature of 22˚C. The paddy field soil in the station is developed from the Latosol and has pH 6.0 with an or- ganic matter content of 29.35 g·kg–1, a total nitrogen (N) of 0.07 g·kg–1, a total phosphorus (P) of 0.21 g·kg–1, an available P of 0.03 g·kg–1, a total potassium (K) of 13.54 g·kg–1, and an available K of 0.07 g·kg–1. The rice species used in this study was Sheng Ba Xi Miao, which was provided by South China Agricultural University, Guangzhou City, China. The following three cultivation treatments each with duplicated experimental plots were chosen for the experiment: 1) organic fertil- izer + duck (OF + D); 2) chemical fertilizer + duck (CF + D); and chemical fertilizer (Control), which resulted in the total of six experimental plots. Each experimental plot had an area of 666 m2 and was separated from each other by inserting the plastic barriers into a soil depth of 0.3 m around the plot boundaries to prevent water and air exchanges between the plots. These plots were randomly distributed in the study site. The organic fertilizer used was the dried chicken manure at the application amount of 3750 kg·ha–1 which contains about 51% of organic matter, 3.26% of N, 3.08% of P2O5, and 1.7% of K2O, whereas the chemical fertilizer used was the compound fertilizer (Compound Fertilizer Inc., Academy of Agri- culture of Guangdong, China) with the application amounts of 100, 90, and 90 kg·ha–1, respectively, for N, P, and K. The pesticide used was Masha with “Antai” brand that was purchased from the Antai Limited Inc., Guangxi Zhuang Autonomous Region, China. The experimental plots in the paddy field was tilled, fertilized, and planted, respectively, on April 1, 5, and 6, 2004. To prevent the ducks from escaping, the plots were contained by the nylon-net with a height of 0.5 m. After C opyright © 2011 SciRes. JEP 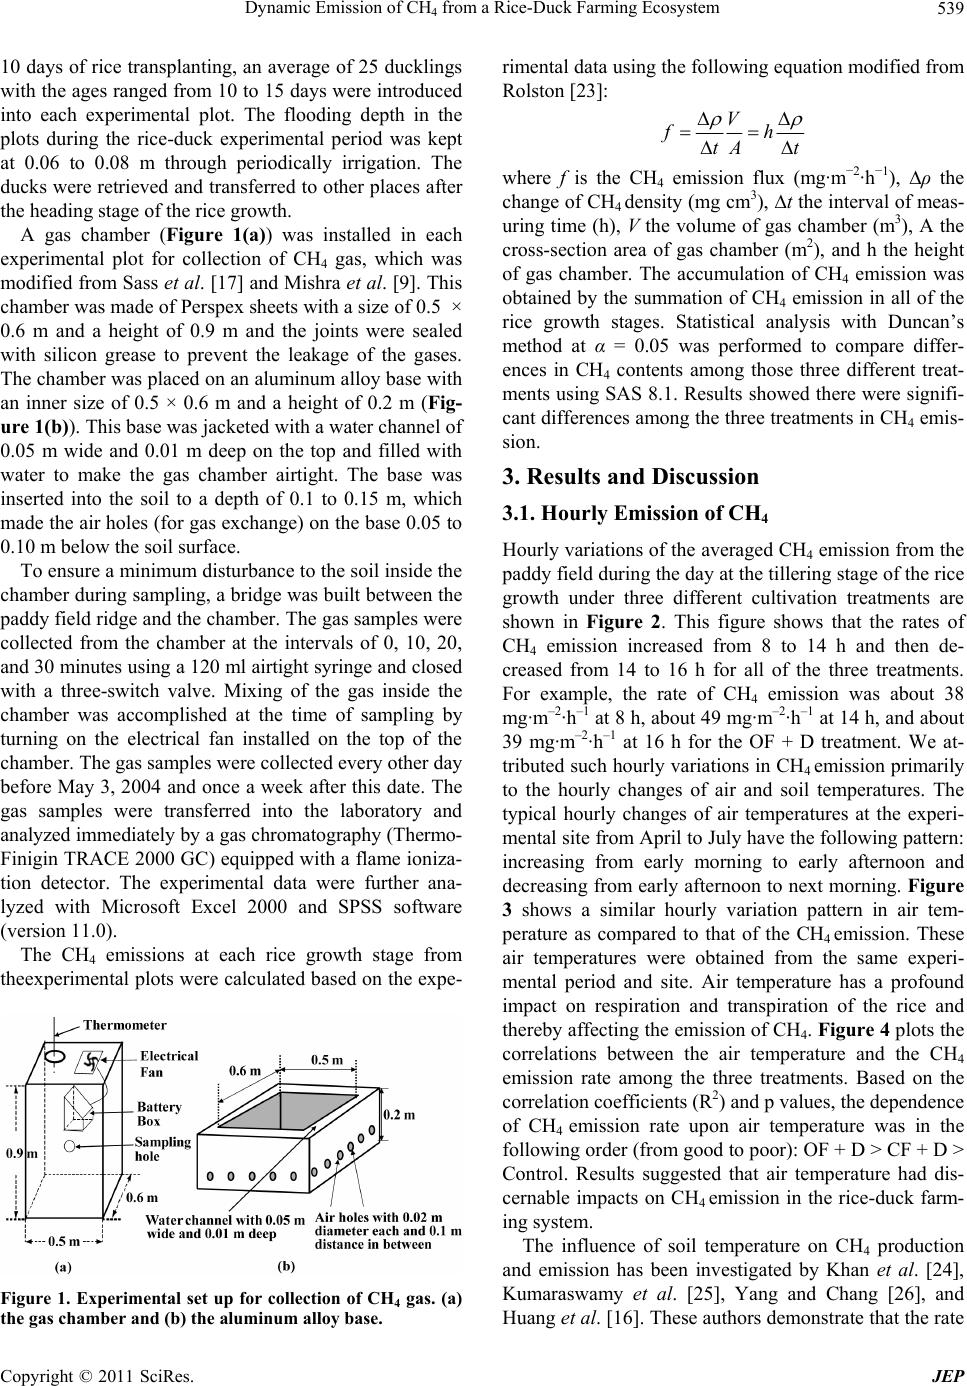 Dynamic Emission of CH from a Rice-Duck Farming Ecosystem539 4 10 days of rice transplanting, an average of 25 ducklings with the ages ranged from 10 to 15 days were introduced into each experimental plot. The flooding depth in the plots during the rice-duck experimental period was kept at 0.06 to 0.08 m through periodically irrigation. The ducks were retrieved and transferred to other places after the heading stage of the rice growth. A gas chamber (Figure 1(a)) was installed in each experimental plot for collection of CH4 gas, which was modified from Sass et al. [17] and Mishra et al. [9]. This chamber was made of Perspex sheets with a size of 0.5 × 0.6 m and a height of 0.9 m and the joints were sealed with silicon grease to prevent the leakage of the gases. The chamber was placed on an aluminum alloy base with an inner size of 0.5 × 0.6 m and a height of 0.2 m (Fig- ure 1(b)). This base was jacketed with a water channel of 0.05 m wide and 0.01 m deep on the top and filled with water to make the gas chamber airtight. The base was inserted into the soil to a depth of 0.1 to 0.15 m, which made the air holes (for gas exchange) on the base 0.05 to 0.10 m below the soil surface. To ensure a minimum disturbance to the soil inside the chamber during sampling, a bridge was built between the paddy field ridge and the chamber. The gas samples were collected from the chamber at the intervals of 0, 10, 20, and 30 minutes using a 120 ml airtight syringe and closed with a three-switch valve. Mixing of the gas inside the chamber was accomplished at the time of sampling by turning on the electrical fan installed on the top of the chamber. The gas samples were collected every other day before May 3, 2004 and once a week after this date. The gas samples were transferred into the laboratory and analyzed immediately by a gas chromatography (Thermo- Finigin TRACE 2000 GC) equipped with a flame ioniza- tion detector. The experimental data were further ana- lyzed with Microsoft Excel 2000 and SPSS software (version 11.0). The CH4 emissions at each rice growth stage from theexperimental plots were calculated based on the expe- Figure 1. Experimental set up for collection of CH4 gas. (a) the gas chamber and (b) the aluminum alloy base. rimental data using the following equation modified from Rolston [23]: V fh tA t where f is the CH4 emission flux (mg·m−2·h−1), ρ the change of CH4 density (mg cm3), t the interval of meas- uring time (h), V the volume of gas chamber (m3), A the cross-section area of gas chamber (m2), and h the height of gas chamber. The accumulation of CH4 emission was obtained by the summation of CH4 emission in all of the rice growth stages. Statistical analysis with Duncan’s method at α = 0.05 was performed to compare differ- ences in CH4 contents among those three different treat- ments using SAS 8.1. Results showed there were signifi- cant differences among the three treatments in CH4 emis- sion. 3. Results and Discussion 3.1. Hourly Emission of CH4 Hourly variations of the averaged CH4 emission from the paddy field during the day at the tillering stage of the rice growth under three different cultivation treatments are shown in Figure 2. This figure shows that the rates of CH4 emission increased from 8 to 14 h and then de- creased from 14 to 16 h for all of the three treatments. For example, the rate of CH4 emission was about 38 mg·m–2·h–1 at 8 h, about 49 mg·m–2·h–1 at 14 h, and about 39 mg·m–2·h–1 at 16 h for the OF + D treatment. We at- tributed such hourly variations in CH4 emission primarily to the hourly changes of air and soil temperatures. The typical hourly changes of air temperatures at the experi- mental site from April to July have the following pattern: increasing from early morning to early afternoon and decreasing from early afternoon to next morning. Figure 3 shows a similar hourly variation pattern in air tem- perature as compared to that of the CH4 emission. These air temperatures were obtained from the same experi- mental period and site. Air temperature has a profound impact on respiration and transpiration of the rice and thereby affecting the emission of CH4. Figure 4 plots the correlations between the air temperature and the CH4 emission rate among the three treatments. Based on the correlation coefficients (R2) and p values, the dependence of CH4 emission rate upon air temperature was in the following order (from good to poor): OF + D > CF + D > Control. Results suggested that air temperature had dis- cernable impacts on CH4 emission in the rice-duck farm- ing system. The influence of soil temperature on CH4 production and emission has been investigated by Khan et al. [24], Kumaraswamy et al. [25], Yang and Chang [26], and Huang et al. [16]. These authors demonstrate that the rate Copyright © 2011 SciRes. JEP 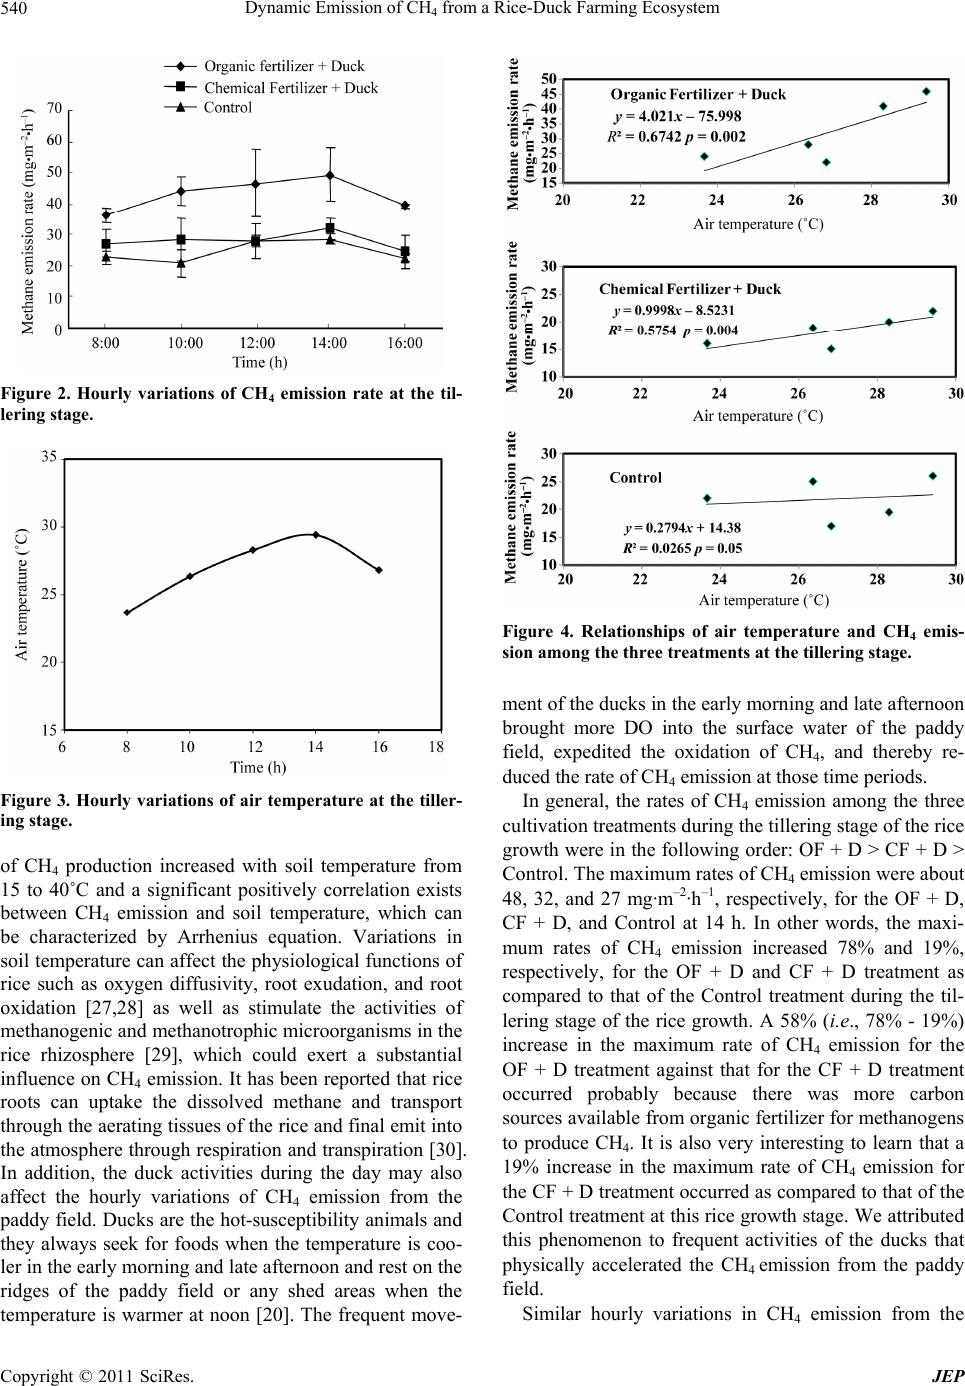 Dynamic Emission of CH from a Rice-Duck Farming Ecosystem 540 4 Figure 2. Hourly variations of CH4 emission rate at the til- lering stage. Figure 3. Hourly variations of air temperature at the tiller- ing stage. of CH4 production increased with soil temperature from 15 to 40˚C and a significant positively correlation exists between CH4 emission and soil temperature, which can be characterized by Arrhenius equation. Variations in soil temperature can affect the physiological functions of rice such as oxygen diffusivity, root exudation, and root oxidation [27,28] as well as stimulate the activities of methanogenic and methanotrophic microorganisms in the rice rhizosphere [29], which could exert a substantial influence on CH4 emission. It has been reported that rice roots can uptake the dissolved methane and transport through the aerating tissues of the rice and final emit into the atmosphere through respiration and transpiration [30]. In addition, the duck activities during the day may also affect the hourly variations of CH4 emission from the paddy field. Ducks are the hot-susceptibility animals and they always seek for foods when the temperature is coo- ler in the early morning and late afternoon and rest on the ridges of the paddy field or any shed areas when the temperature is warmer at noon [20]. The frequent move- Figure 4. Relationships of air temperature and CH4 emis- sion among the three treatments at the tillering stage. ment of the ducks in the early morning and late afternoon brought more DO into the surface water of the paddy field, expedited the oxidation of CH4, and thereby re- duced the rate of CH4 emission at those time periods. In general, the rates of CH4 emission among the three cultivation treatments during the tillering stage of the rice growth were in the following order: OF + D > CF + D > Control. The maximum rates of CH4 emission were about 48, 32, and 27 mg·m–2·h–1, respectively, for the OF + D, CF + D, and Control at 14 h. In other words, the maxi- mum rates of CH4 emission increased 78% and 19%, respectively, for the OF + D and CF + D treatment as compared to that of the Control treatment during the til- lering stage of the rice growth. A 58% (i.e., 78% - 19%) increase in the maximum rate of CH4 emission for the OF + D treatment against that for the CF + D treatment occurred probably because there was more carbon sources available from organic fertilizer for methanogens to produce CH4. It is also very interesting to learn that a 19% increase in the maximum rate of CH4 emission for the CF + D treatment occurred as compared to that of the Control treatment at this rice growth stage. We attributed this phenomenon to frequent activities of the ducks that physically accelerated the CH4 emission from the paddy field. Similar hourly variations in CH4 emission from the C opyright © 2011 SciRes. JEP 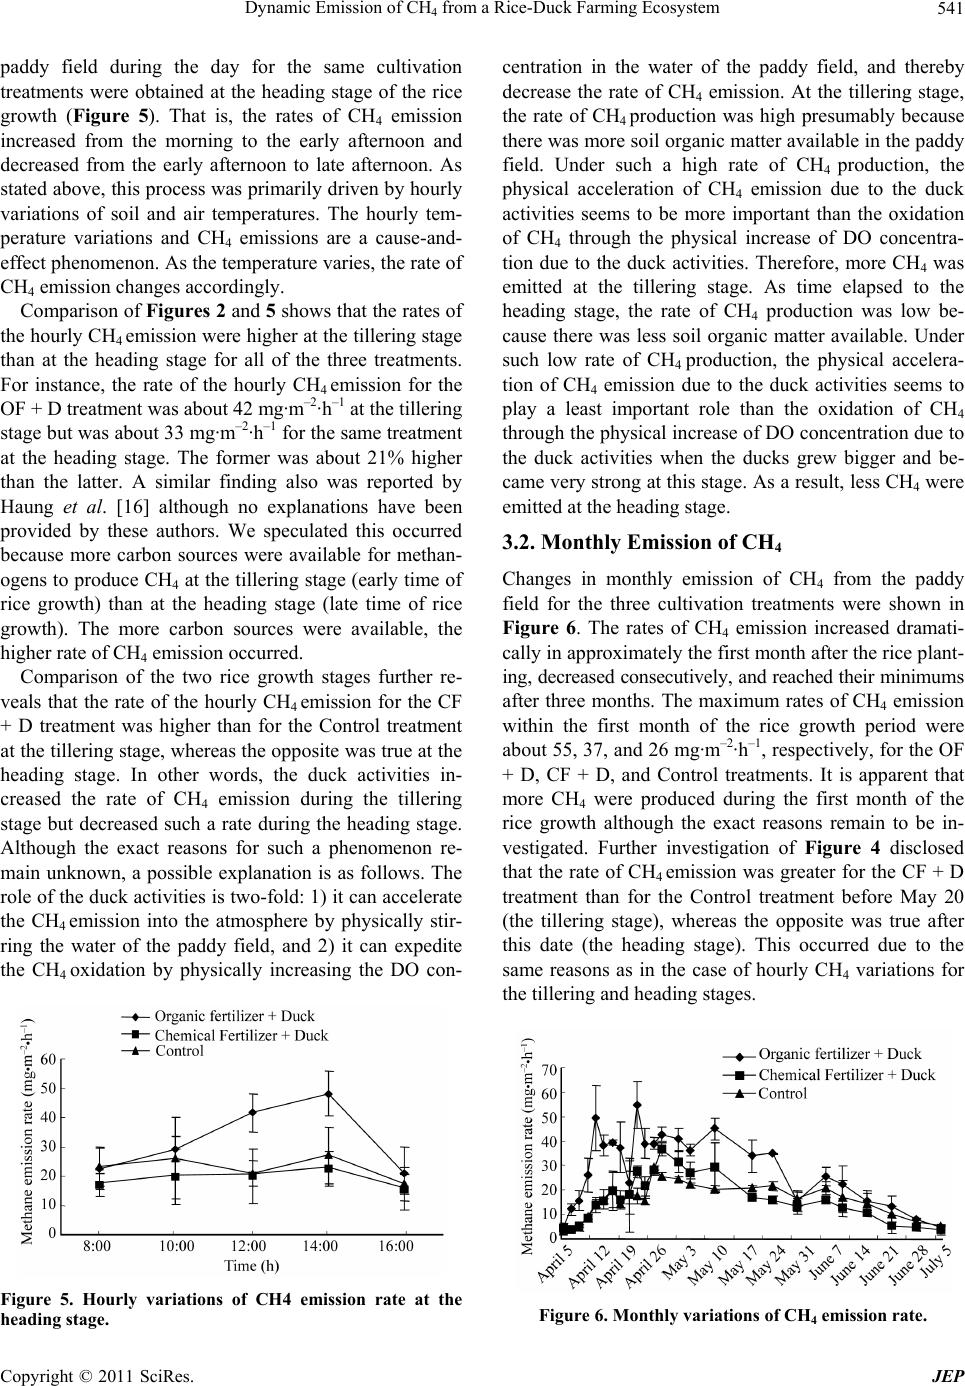 Dynamic Emission of CH from a Rice-Duck Farming Ecosystem541 4 paddy field during the day for the same cultivation treatments were obtained at the heading stage of the rice growth (Figure 5). That is, the rates of CH4 emission increased from the morning to the early afternoon and decreased from the early afternoon to late afternoon. As stated above, this process was primarily driven by hourly variations of soil and air temperatures. The hourly tem- perature variations and CH4 emissions are a cause-and- effect phenomenon. As the temperature varies, the rate of CH4 emission changes accordingly. Comparison of Figures 2 and 5 shows that the rates of the hourly CH4 emission were higher at the tillering stage than at the heading stage for all of the three treatments. For instance, the rate of the hourly CH4 emission for the OF + D treatment was about 42 mg·m–2·h–1 at the tillering stage but was about 33 mg·m–2·h–1 for the same treatment at the heading stage. The former was about 21% higher than the latter. A similar finding also was reported by Haung et al. [16] although no explanations have been provided by these authors. We speculated this occurred because more carbon sources were available for methan- ogens to produce CH4 at the tillering stage (early time of rice growth) than at the heading stage (late time of rice growth). The more carbon sources were available, the higher rate of CH4 emission occurred. Comparison of the two rice growth stages further re- veals that the rate of the hourly CH4 emission for the CF + D treatment was higher than for the Control treatment at the tillering stage, whereas the opposite was true at the heading stage. In other words, the duck activities in- creased the rate of CH4 emission during the tillering stage but decreased such a rate during the heading stage. Although the exact reasons for such a phenomenon re- main unknown, a possible explanation is as follows. The role of the duck activities is two-fold: 1) it can accelerate the CH4 emission into the atmosphere by physically stir- ring the water of the paddy field, and 2) it can expedite the CH4 oxidation by physically increasing the DO con- Figure 5. Hourly variations of CH4 emission rate at the heading stage. centration in the water of the paddy field, and thereby decrease the rate of CH4 emission. At the tillering stage, the rate of CH4 production was high presumably because there was more soil organic matter available in the paddy field. Under such a high rate of CH4 production, the physical acceleration of CH4 emission due to the duck activities seems to be more important than the oxidation of CH4 through the physical increase of DO concentra- tion due to the duck activities. Therefore, more CH4 was emitted at the tillering stage. As time elapsed to the heading stage, the rate of CH4 production was low be- cause there was less soil organic matter available. Under such low rate of CH4 production, the physical accelera- tion of CH4 emission due to the duck activities seems to play a least important role than the oxidation of CH4 through the physical increase of DO concentration due to the duck activities when the ducks grew bigger and be- came very strong at this stage. As a result, less CH4 were emitted at the heading stage. 3.2. Monthly Emission of CH4 Changes in monthly emission of CH4 from the paddy field for the three cultivation treatments were shown in Figure 6. The rates of CH4 emission increased dramati- cally in approximately the first month after the rice plant- ing, decreased consecutively, and reached their minimums after three months. The maximum rates of CH4 emission within the first month of the rice growth period were about 55, 37, and 26 mg·m–2·h–1, respectively, for the OF + D, CF + D, and Control treatments. It is apparent that more CH4 were produced during the first month of the rice growth although the exact reasons remain to be in- vestigated. Further investigation of Figure 4 disclosed that the rate of CH4 emission was greater for the CF + D treatment than for the Control treatment before May 20 (the tillering stage), whereas the opposite was true after this date (the heading stage). This occurred due to the same reasons as in the case of hourly CH4 variations for the tillering and heading stages. Figure 6. Monthly variations of CH4 emission rate. Copyright © 2011 SciRes. JEP 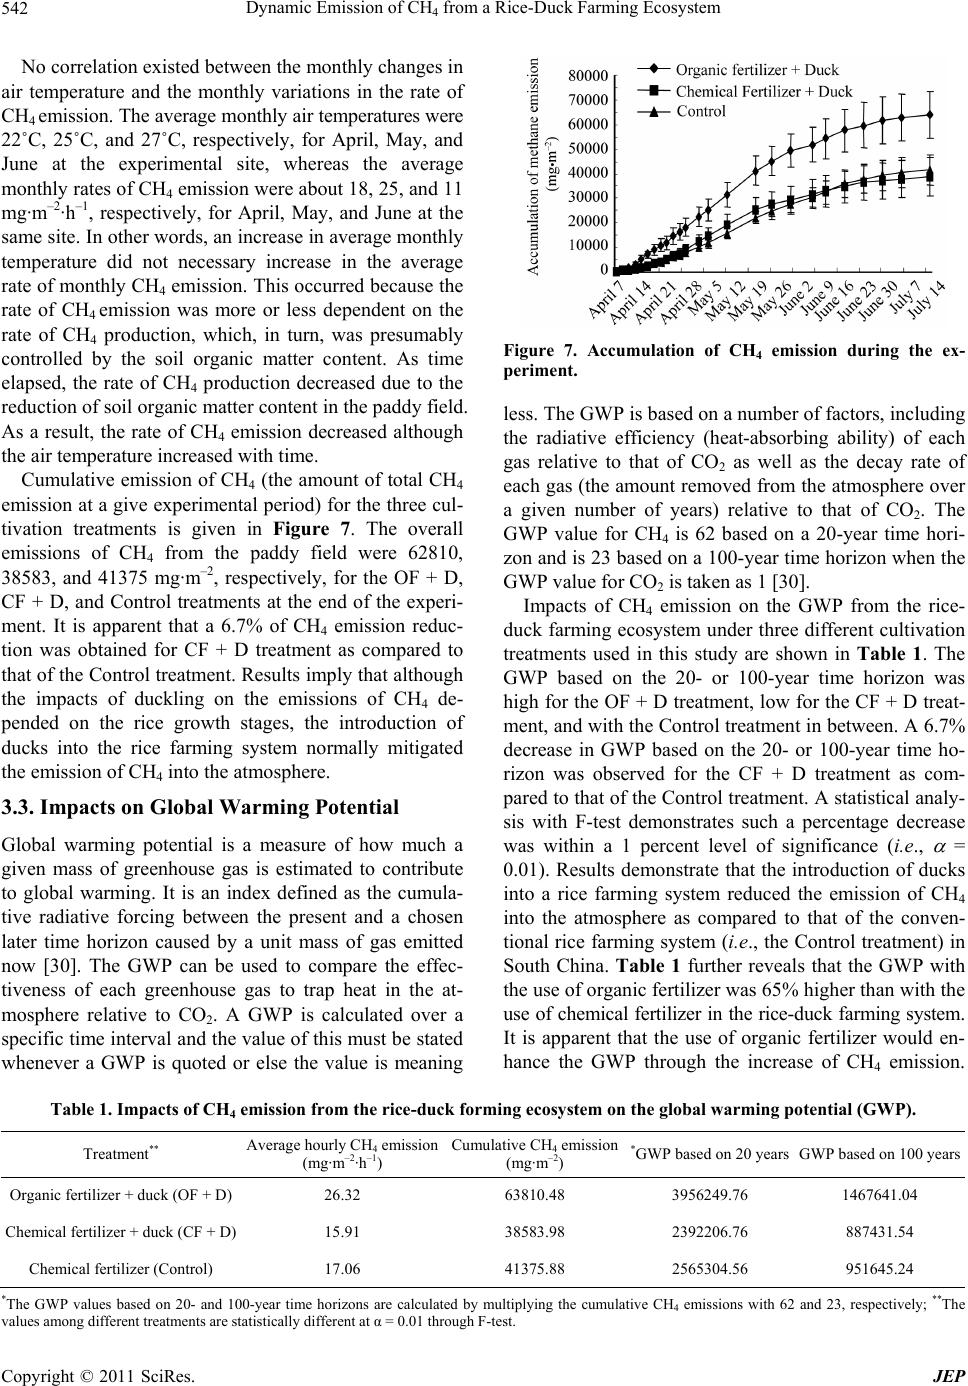 Dynamic Emission of CH4 from a Rice-Duck Farming Ecosystem Copyright © 2011 SciRes. JEP 542 No correlation existed between the monthly changes in air temperature and the monthly variations in the rate of CH4 emission. The average monthly air temperatures were 22˚C, 25˚C, and 27˚C, respectively, for April, May, and June at the experimental site, whereas the average monthly rates of CH4 emission were about 18, 25, and 11 mg·m–2·h–1, respectively, for April, May, and June at the same site. In other words, an increase in average monthly temperature did not necessary increase in the average rate of monthly CH4 emission. This occurred because the rate of CH4 emission was more or less dependent on the rate of CH4 production, which, in turn, was presumably controlled by the soil organic matter content. As time elapsed, the rate of CH4 production decreased due to the reduction of soil organic matter content in the paddy field. As a result, the rate of CH4 emission decreased although the air temperature increased with time. Figure 7. Accumulation of CH4 emission during the ex- periment. less. The GWP is based on a number of factors, including the radiative efficiency (heat-absorbing ability) of each gas relative to that of CO2 as well as the decay rate of each gas (the amount removed from the atmosphere over a given number of years) relative to that of CO2. The GWP value for CH4 is 62 based on a 20-year time hori- zon and is 23 based on a 100-year time horizon when the GWP value for CO2 is taken as 1 [30]. Cumulative emission of CH4 (the amount of total CH4 emission at a give experimental period) for the three cul- tivation treatments is given in Figure 7. The overall emissions of CH4 from the paddy field were 62810, 38583, and 41375 mg·m–2, respectively, for the OF + D, CF + D, and Control treatments at the end of the experi- ment. It is apparent that a 6.7% of CH4 emission reduc- tion was obtained for CF + D treatment as compared to that of the Control treatment. Results imply that although the impacts of duckling on the emissions of CH4 de- pended on the rice growth stages, the introduction of ducks into the rice farming system normally mitigated the emission of CH4 into the atmosphere. Impacts of CH4 emission on the GWP from the rice- duck farming ecosystem under three different cultivation treatments used in this study are shown in Table 1. The GWP based on the 20- or 100-year time horizon was high for the OF + D treatment, low for the CF + D treat- ment, and with the Control treatment in between. A 6.7% decrease in GWP based on the 20- or 100-year time ho- rizon was observed for the CF + D treatment as com- pared to that of the Control treatment. A statistical analy- sis with F-test demonstrates such a percentage decrease was within a 1 percent level of significance (i.e., = 0.01). Results demonstrate that the introduction of ducks into a rice farming system reduced the emission of CH4 into the atmosphere as compared to that of the conven- tional rice farming system (i.e., the Control treatment) in South China. Table 1 further reveals that the GWP with the use of organic fertilizer was 65% higher than with the use of chemical fertilizer in the rice-duck farming system. It is apparent that the use of organic fertilizer would en- hance the GWP through the increase of CH4 emission. 3.3. Impacts on Global Warming Potential Global warming potential is a measure of how much a given mass of greenhouse gas is estimated to contribute to global warming. It is an index defined as the cumula- tive radiative forcing between the present and a chosen later time horizon caused by a unit mass of gas emitted now [30]. The GWP can be used to compare the effec- tiveness of each greenhouse gas to trap heat in the at- mosphere relative to CO2. A GWP is calculated over a specific time interval and the value of this must be stated whenever a GWP is quoted or else the value is meaning Table 1. Impacts of CH4 emission from the rice-duck forming ecosystem on the global warming potential (GWP). Treatment** Average hourly CH4 emission (mg·m–2·h–1) Cumulative CH4 emission (mg·m–2) *GWP based on 20 years GWP based on 100 years Organic fertilizer + duck (OF + D) 26.32 63810.48 3956249.76 1467641.04 Chemical fertilizer + duck (CF + D) 15.91 38583.98 2392206.76 887431.54 Chemical fertilizer (Control) 17.06 41375.88 2565304.56 951645.24 *The GWP values based on 20- and 100-year time horizons are calculated by multiplying the cumulative CH4 emissions with 62 and 23, respectively; **The values among different treatments are statistically different at α = 0.01 through F-test. 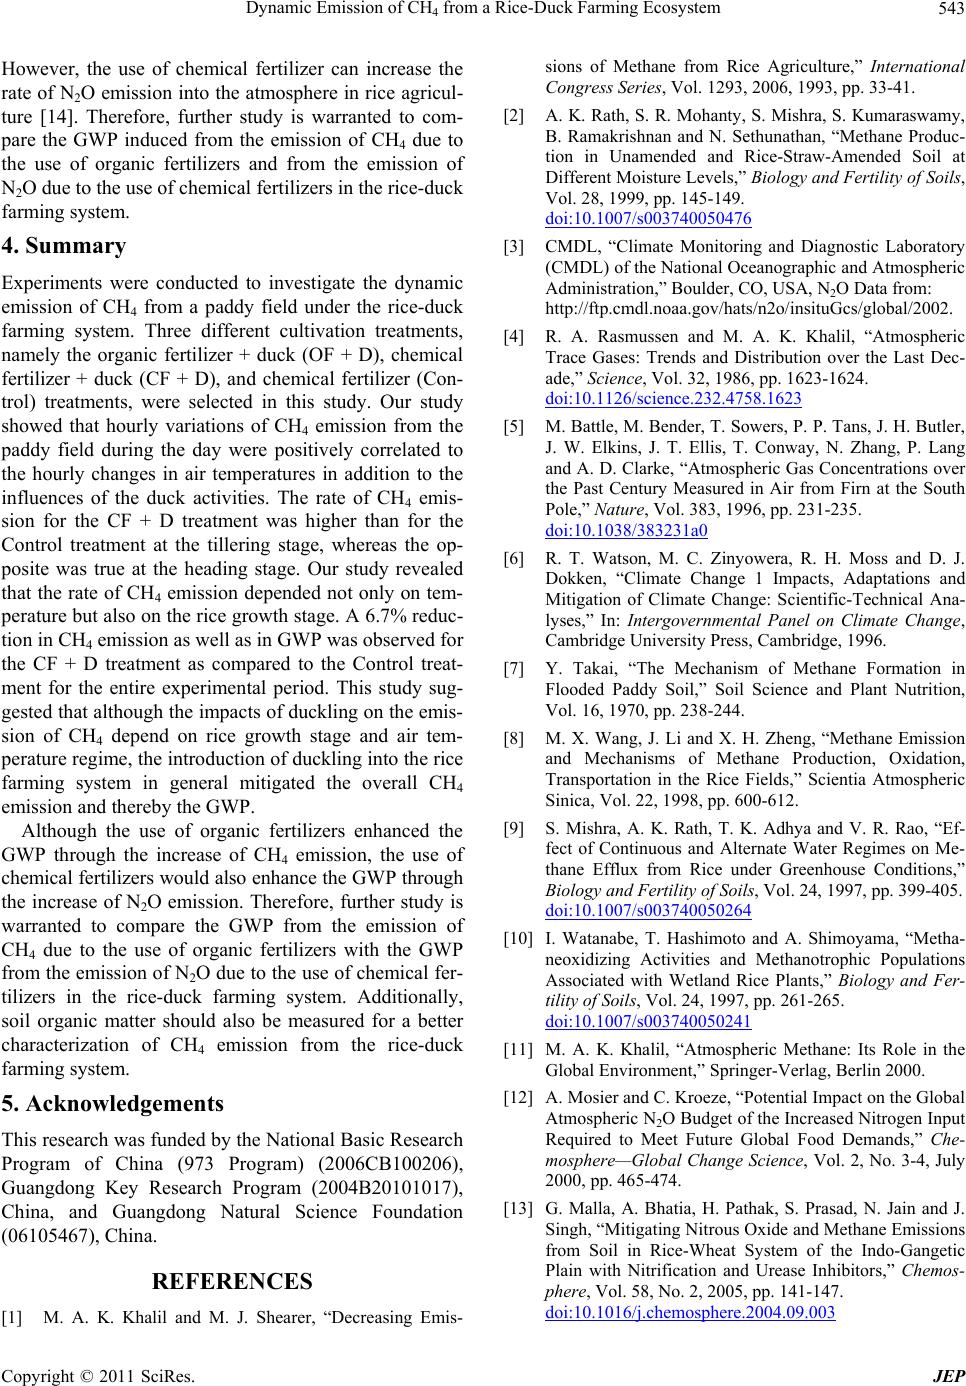 Dynamic Emission of CH from a Rice-Duck Farming Ecosystem543 4 However, the use of chemical fertilizer can increase the rate of N2O emission into the atmosphere in rice agricul- ture [14]. Therefore, further study is warranted to com- pare the GWP induced from the emission of CH4 due to the use of organic fertilizers and from the emission of N2O due to the use of chemical fertilizers in the rice-duck farming system. 4. Summary Experiments were conducted to investigate the dynamic emission of CH4 from a paddy field under the rice-duck farming system. Three different cultivation treatments, namely the organic fertilizer + duck (OF + D), chemical fertilizer + duck (CF + D), and chemical fertilizer (Con- trol) treatments, were selected in this study. Our study showed that hourly variations of CH4 emission from the paddy field during the day were positively correlated to the hourly changes in air temperatures in addition to the influences of the duck activities. The rate of CH4 emis- sion for the CF + D treatment was higher than for the Control treatment at the tillering stage, whereas the op- posite was true at the heading stage. Our study revealed that the rate of CH4 emission depended not only on tem- perature but also on the rice growth stage. A 6.7% reduc- tion in CH4 emission as well as in GWP was observed for the CF + D treatment as compared to the Control treat- ment for the entire experimental period. This study sug- gested that although the impacts of duckling on the emis- sion of CH4 depend on rice growth stage and air tem- perature regime, the introduction of duckling into the rice farming system in general mitigated the overall CH4 emission and thereby the GWP. Although the use of organic fertilizers enhanced the GWP through the increase of CH4 emission, the use of chemical fertilizers would also enhance the GWP through the increase of N2O emission. Therefore, further study is warranted to compare the GWP from the emission of CH4 due to the use of organic fertilizers with the GWP from the emission of N2O due to the use of chemical fer- tilizers in the rice-duck farming system. Additionally, soil organic matter should also be measured for a better characterization of CH4 emission from the rice-duck farming system. 5. Acknowledgements This research was funded by the National Basic Research Program of China (973 Program) (2006CB100206), Guangdong Key Research Program (2004B20101017), China, and Guangdong Natural Science Foundation (06105467), China. REFERENCES [1] M. A. K. Khalil and M. J. Shearer, “Decreasing Emis- sions of Methane from Rice Agriculture,” International Congress Series, Vol. 1293, 2006, 1993, pp. 33-41. [2] A. K. Rath, S. R. Mohanty, S. Mishra, S. Kumaraswamy, B. Ramakrishnan and N. Sethunathan, “Methane Produc- tion in Unamended and Rice-Straw-Amended Soil at Different Moisture Levels,” Biology and Fertility of Soils, Vol. 28, 1999, pp. 145-149. doi:10.1007/s003740050476 [3] CMDL, “Climate Monitoring and Diagnostic Laboratory (CMDL) of the National Oceanographic and Atmospheric Administration,” Boulder, CO, USA, N2O Data from: http://ftp.cmdl.noaa.gov/hats/n2o/insituGcs/global/2002. [4] R. A. Rasmussen and M. A. K. Khalil, “Atmospheric Trace Gases: Trends and Distribution over the Last Dec- ade,” Science, Vol. 32, 1986, pp. 1623-1624. doi:10.1126/science.232.4758.1623 [5] M. Battle, M. Bender, T. Sowers, P. P. Tans, J. H. Butler, J. W. Elkins, J. T. Ellis, T. Conway, N. Zhang, P. Lang and A. D. Clarke, “Atmospheric Gas Concentrations over the Past Century Measured in Air from Firn at the South Pole,” Nature, Vol. 383, 1996, pp. 231-235. doi:10.1038/383231a0 [6] R. T. Watson, M. C. Zinyowera, R. H. Moss and D. J. Dokken, “Climate Change 1 Impacts, Adaptations and Mitigation of Climate Change: Scientific-Technical Ana- lyses,” In: Intergovernmental Panel on Climate Change, Cambridge University Press, Cambridge, 1996. [7] Y. Takai, “The Mechanism of Methane Formation in Flooded Paddy Soil,” Soil Science and Plant Nutrition, Vol. 16, 1970, pp. 238-244. [8] M. X. Wang, J. Li and X. H. Zheng, “Methane Emission and Mechanisms of Methane Production, Oxidation, Transportation in the Rice Fields,” Scientia Atmospheric Sinica, Vol. 22, 1998, pp. 600-612. [9] S. Mishra, A. K. Rath, T. K. Adhya and V. R. Rao, “Ef- fect of Continuous and Alternate Water Regimes on Me- thane Efflux from Rice under Greenhouse Conditions,” Biology and Fertility of Soils, Vol. 24, 1997, pp. 399-405. doi:10.1007/s003740050264 [10] I. Watanabe, T. Hashimoto and A. Shimoyama, “Metha- neoxidizing Activities and Methanotrophic Populations Associated with Wetland Rice Plants,” Biology and Fer- tility of Soils, Vol. 24, 1997, pp. 261-265. doi:10.1007/s003740050241 [11] M. A. K. Khalil, “Atmospheric Methane: Its Role in the Global Environment,” Springer-Verlag, Berlin 2000. [12] A. Mosier and C. Kroeze, “Potential Impact on the Global Atmospheric N2O Budget of the Increased Nitrogen Input Required to Meet Future Global Food Demands,” Che- mosphere—Global Change Science, Vol. 2, No. 3-4, July 2000, pp. 465-474. [13] G. Malla, A. Bhatia, H. Pathak, S. Prasad, N. Jain and J. Singh, “Mitigating Nitrous Oxide and Methane Emissions from Soil in Rice-Wheat System of the Indo-Gangetic Plain with Nitrification and Urease Inhibitors,” Chemos- phere, Vol. 58, No. 2, 2005, pp. 141-147. doi:10.1016/j.chemosphere.2004.09.003 Copyright © 2011 SciRes. JEP  Dynamic Emission of CH from a Rice-Duck Farming Ecosystem 544 4 [14] S. J. D. Grosso, W. J. Parton, A. R. Mosier, M. K. Walsh, D. S. Ojima and P. E. Thornton, “DAYCENT National- scale Simulations of Nitrous Oxide Emissions from Cropped Soils in the United States,” Journal of Environ- mental Quality, Vol. 35, No. 4, 2006, pp. 1451-1460. doi:10.2134/jeq2005.0160 [15] J. S. Singh and S. Singh, “Methanogenic Bacteria, Me- thanogenesis and Methane Emission from Rice Paddies,” Journal of Tropical Ecology, 1995, Vol. 36, pp. 145-165. [16] Y. Huang, H. Wang, H. Huang, Z. W. Feng, Z. H. Yang and Y. C. Luo, “Characteristics of Methane Emission from Wetland Rice-Duck Complex Ecosystem,” Agricul- ture, Ecosystems & Environment, Vol. 105, No. 1-2, 2005, pp. 181-193. doi:10.1016/j.agee.2004.04.004 [17] R. L. Sass, F. M. Fisher, S. T. Lewis, M. F. Jund and F. T. Turner, “Methane Emission from Rice Fields: Effects of Soil Properties,” Global Biogeochemical Cycles, Vol. 8, No. 2, 1994, pp. 135-140. doi:10.1029/94GB00588 [18] W. Reiner and S. A. Milkha, “The Role of Rice Plants in Regulating Mechanisms of Methane Missions,” Biology and Fertility of Soils, Vol. 31, No. 1, 2000, pp. 20-29. doi:10.1007/s003740050619 [19] Y. H. Zheng, G. B. Deng and G. M. Lu, “Eco-Economic Benefits of Rice-Fish-Duck Complex Ecosystem,” Jour- nal of Applied Ecology, Vol. 8, 1997, pp. 431-434. [20] Y. Wang, “Studies on Ecological Benefits of Planting and Breeding Model in Rice Fields,” Acta Ecologica Sinica, Vol. 20, 2000, pp. 311-316. [21] Y. Wang and Y. Wang, “Quick Measurement of CH4, CO2 and N2O Emission from a Short-Plant Ecosystem,” Advances in Atmospheric Sciences, Vol. 20, No. 5, 2003, pp. 842-844. doi:10.1007/BF02915410 [22] S. Kumaraswamy, A. K. Rath, B. Ramakrishnan and N. Sethunathan, “Wetland Rice Soils as Sources and Sinks of Methane: A Review and Prospects for Research,” Bi- ology and Fertility of Soils, Vol. 31, No. 6, 2000, pp. 449-461. doi:10.1007/s003740000214 [23] D.E. Rolston, “Gas flux,” In: A. Klute, Ed., Methods of Soil Analysis, Second Edition, In: Agronomy Monograph, No. 9, ASA and SSSA, Madison, Wisconsin, 1986, pp. 1103-1119. [24] R. Z. Khan, C. Miiller and S. G. Sommer, “Micrometeo- rological Mass Balance Technique for Measuring CH4 Emission from Stored Cattle Slurry,” Biology and Fertil- ity of Soils, Vol. 24, 1997, pp. 442-444. doi:10.1007/s003740050270 [25] S. Kumaraswamy, A. K. Rath, K. Bharati, B. Ramakrish- nan and N. Sethunathan, “Influence of Pesticide on Me- thane Oxidation in a Flooded Tropical Rice Soil,” Bulle- tin of Environmental Contamination and Toxicology, Vol. 59, 1997, pp. 222-227. doi:10.1007/s001289900468 [26] S. S. Yang and E.H. Chang, “Effect of Fertilizer Applica- tion on Methane Emission/Production in the Paddy Soils of Taiwan,” Biology and Fertility of Soils, Vol. 25, 1997, pp. 245-251. doi:10.1007/s003740050310 [27] S. N. Satpathy, A. K. Rath, S. Mishra, S. Kumaraswamy, B. Ramakrishnan, T. K. Adhya and N. Sethunathan, “Ef- fect of Hexachlorocyclohexane on Methane Production and Emission from Flooded Rice Soils,” Chemosphere, Vol. 34, No. 2, 1997, pp. 2663-2671. doi:10.1016/S0045-6535(97)00092-1 [28] T. K. Adhya, A. K. Rath, P. K. Gupta, P. R. Rao, S. N. Das, K. M. Parida, D. C. Parasher and N. Sethunathan, “Methane Emission from Flooded Rice Fields under Irri- gated Conditions,” Biology and Fertility of Soils, Vol. 18, 1994, pp. 245-248. doi:10.1007/BF00647675 [29] H. Schutz, W. Seiler and R. Conrad, “Influence of Soil Temperature on Methane Emission from Rice Paddy Fields,” Biogeochemistry, Vol. 11, 1990, pp. 77-95. doi:10.1007/BF00002060 [30] IPCC (Intergovernmental Panel on Climate Change), “Good Practice Guidance and Uncertainty Management in National Greenhouse Gas Inventories,” IGES, Tokyo, 2000. C opyright © 2011 SciRes. JEP
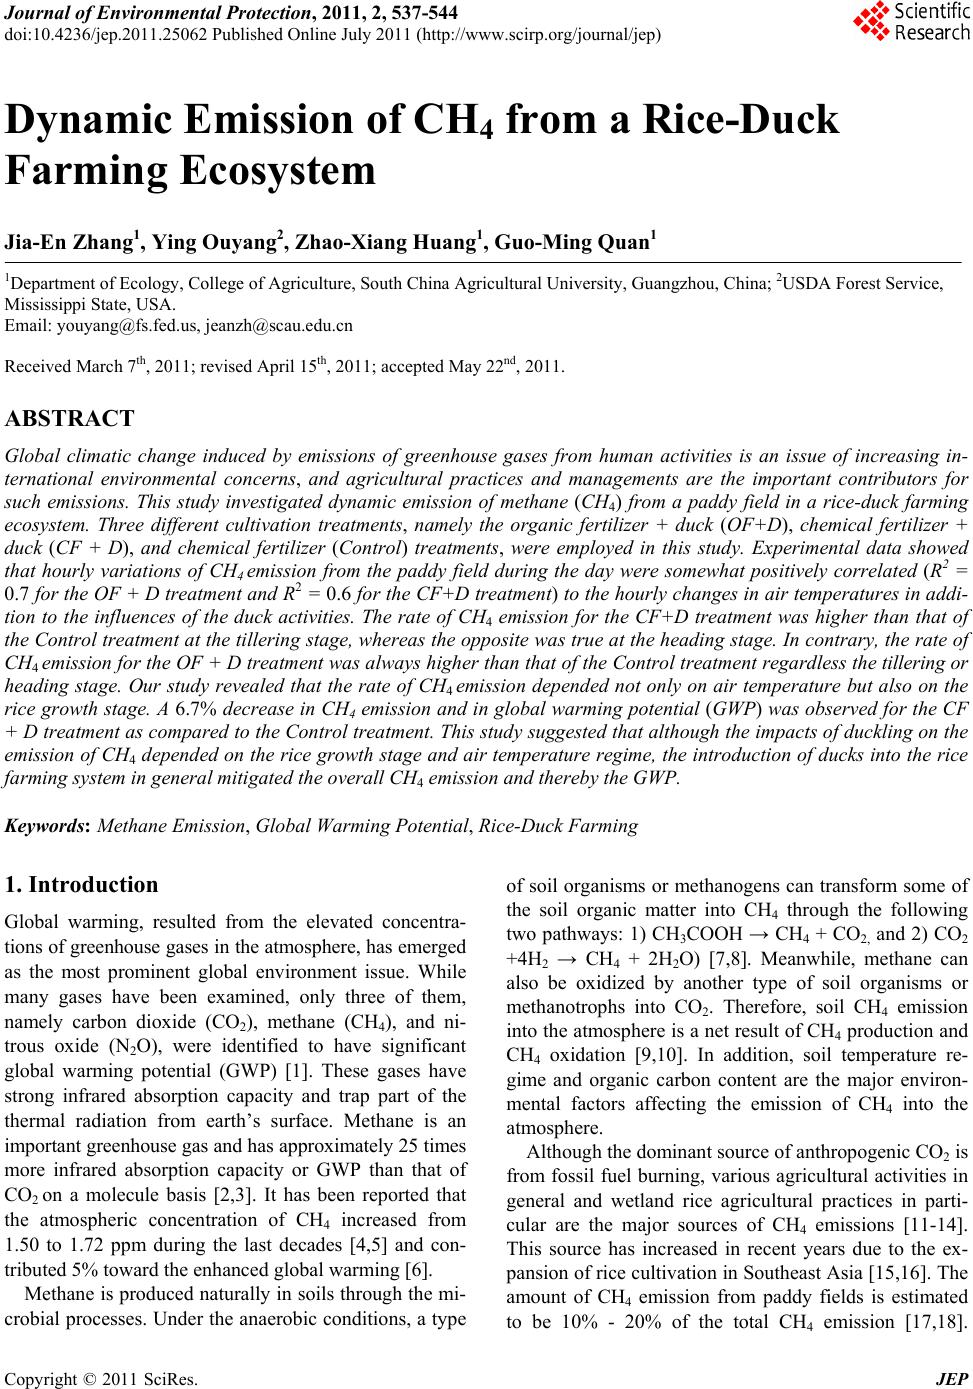
|