 Journal of Environmental Protection, 2011, 2, 581-591 doi:10.4236/jep.2011.25067 Published Online July 2011 (http://www.scirp.org/journal/jep) Copyright © 2011 SciRes. JEP Use of the Environmental Impact Quotient to Estimate Health and Environmental Impacts of Pesticide Usage in Peruvian and Ecuadorian Potato Production Peter Kromann1, Willy Pradel2, Donald Cole3, Arturo Taipe1, Gr eg or y A. Forbes2 1International Potato Center (CIP), Quito, Ecuador; 2Internat i onal Potato Center, Lima, Peru; 3Dalla Lana School of Public Health, University of Toronto, Toronto, Canada Email: g.forbes@cgiar.org Received January 1st, 2011; revised April 2nd, 2011; accepted May 6th, 2011. ABSTRACT Currently there is no effective mechanism for measuring the potential benefits of integrated pest and disease interven- tions in terms of reducing pesticide risks in potato production in developing countries. The environmental impact quo- tient (EIQ), a composite hazard indicator, was applied to data from potato field trials implemented in Ecuador to eva- luate the practical boundaries of this metric related to potato production practices in the Andes. The EIQ was also ap- plied to data from two independent farmer surveys, one from Peru and one from Ecuador to compare potato farming practices and the utility of the EIQ when applied to existing survey data. In the Ecuadorian field trials, the EIQ values, i.e., environmen tal impact (EI) per ha, varied greatly among th e different potato systems tested a nd ranged fro m 40 for an integrated pest management system (resistant cultivar plus less hazardous pesticides) to 1235 for a high -input con- ventional system (susceptible cultivar plus frequent use of hazardous pesticides). Thus, this parameter demonstrates substantial variation under different conditions and different crop management approaches. EI per ha values from the two surveys fell within the range found in the field trial, but in the survey values were toward the lower end, ranging from 64 to 213. Methodical and biophysical factors are discussed that may account for the relatively low EI per ha found in the field survey data. Our study demonstrates the utility of the EIQ for assessing health and environmental hazards of potato production in the Andes and potentially other areas in the developing world. Nonetheless, there are limitations to the EIQ as presently u sed and care is ne eded in the interp reta tion of resu lts. We see our work as an initial step in the development of an integrated metric to estimate environmental and human health hazards related to pesti- cide use in potato production in the diverse conditions of developing countries. Keywords: Insecticide, Fungicide, Farmer Training, Andean Weevil, Late Blight 1. Introduction Potato is the most important crop in the Peruvian Andes, both in terms of area planted, and farm households pro- ducing - approximately 600 thousand. In Ecuador there are approximately 90 thousand potato producers. Cur- rently, the potato crop contributes 11% and 7% of the agricultur al gross domestic produ ct in Peru and Ecuador, respectively, equivalent to a total added value of US $684 million in 2006 [1]. It is estimated that the potato producers in the two countries represent 5% of the agri- cultural economically active population, and more than 30 million workdays are generated each year in the potato sector [1]. Thus, the potato cr op is one of th e main labour and income sources in the rural areas of Andean Peru and Ecuador. However, average potato yields in the two countries remain low: 12.3 t·ha–1 in Peru and 7.8 t·ha–1 in Ecuador, compared to 17.2 t·ha–1 in the neigh- bouring country Co lombia and the world average of 17.6 t·ha–1 [1]. Farms in the Andean highlands of Peru and Ecuador are characterized by small-scale agriculture and significantly rely on a rain-fed cro pping system. Potato is predominantly grown for local and regional markets and is a subsistence crop for many of the poorest Andean farmers.  Use of the Environmental Impact Quot i ent to Estimate Health and Environmen t al Impacts of Pestici d e Usage in 582 Peruvian and Ecuadorian Potato Production The main potato disease in the Andes is late blight, which is caused by the oomycete pathogen Phytopht hora infestans . According to one study, about 42% of the 268,000 ha cultivated with potato in Peru are at risk from high late blight severity and approximately 15% of the Peruvian potato crop is lost annually to late blight [2]. In Ecuador, in the northern wet Andes, late blight is particu- larly widespread because farmers plant potato year-round and the dry seasons are generally relatively short [3] . Pests are also major biotic constraints to potato pro- duction in the Andes, especially the Andean potato wee- vil (Premnotrypes spp.), the potato tuber moths (Sym- metrischema plaesiosema, Tecia solanivora, Phthori- maea operculella) and flea beetles (Epitrix spp.). The use of pesticides is common practice among po- tato farmers due to the prevalent pest and disease prob- lems. In both countries fungicides are routinely used for control of potato late blight and insecticides are applied primarily to control Andean potato weevil, but also fre- quently for flee beetle. The product types and number of sprays commonly used are highly variable from one lo- cation to another. The use of highly hazardous (World Health Organization, WHO class Ia and Ib) and moder- ately hazardous (WHO class II) pesticides has been re- ported to be common [4]. A study done in 1999 in north- ern Peru [5] found that farmers applied fungicides 6 times on the average to their potato crops. Two surveys carried out by the International Potato Center (CIP) in the 1990’s found that farmers in northern Ecuador on the average sprayed potato 7 times with an average of 2.5 products in a mixture at each application [6]. A recent intensive follow-up study of producers in northern Ec- uador found that the situation has ch anged little; the new study reported an aver age of 7.3 sprays per season [7]. CIP and its partners have put a high priority on the development and diffusion of integrated pest (and disease) management (IPM) knowledge and technologies that help to reduce the damage caused by pests and diseases, while also reducing dependency on hazardous pesticides. These technologies include use of potato cultivars with resistance to late blight, biological control, and alterna- tive management practices to reduce the overall need for insecticides and the complete avoidance of highly toxic insecticides for control of Andean potato weevil (World Health Organization, WHO category Ia and Ib) [8]. Measuring the success of IPM and related technologies can be done in several ways. For example, one can dem- onstrate increased productivity and/or economic benefits of any practice that is to be adopted by farmers. This can be done with a large number of established techniques routinely used in field trials, including demonstration plots or the more participatory farmer field schools [9]. Yield measurements and simple economic analysis are readily carried out with farmers to compare crop man- agement practices [10]. Within the developing countries where CIP and its partners work, however, there is no effective mecha- nism for measuring the potential benefits of IPM inter- ventions in reducing environmental and human health risks. It has become increasingly clear that assessments based solely on the costs of pesticides or on the vol- umes applied are not sufficient metrics for evaluating the potential environmental or health benefits of IPM approaches [11]. Furthermore, given the resource limi- tations and difficulties associated with work in many developing countries, any metric adopted for assessing health and environmental risks should require a mini- mum of input information. Many tools, which summarize the complexity of envi- ronmental and h uman health haza rd s and risks, hav e be en developed for the evaluation of secondary adverse effects of pesticides [12]. One of the more widely used measures is the EIQ [13], a composite system, which permits the integration of several important environmental and hu- man health impacts into one value [14]. The EIQ is re- garded as relatively easy to use and has been presented in the scientific literature as useful for estimating potential environmental hazards associated with agricultural pesti- cide use in diverse environments [15-25]. In this article, we apply the EIQ to data from con- trolled field trials implemented in Ecuador to evaluate the practical boundaries of this metric for different crop management practices that may be found in potato pro- duction in the Andes. We also use the EIQ to compare potato farming practices reported in two independent surveys, one involving three locations in Peru and the other from two locations in Ecuador. We propose the EIQ as a simple metric for comparing crop management practices in potato production in developing countries. We discuss some limitations of this approach as well as research that may facilitate or improve it. 2. Materials and Methods 2.1. The Environmental Impact Quotient (EIQ) The EIQ is a mathematical and conceptual summary of environmental and health hazards [14]. It combines the pesticide hazard posed to farm workers (applicator and picker effects), consumers (consumer effect and ground- water effect), and the local environment (aquatic and terrestrial effects) into a composite hazard indicator (Eq- uation (1)) . Equation (1): C opyright © 2011 SciRes. JEP  Use of the Environmental Impact Quot i ent to Estimate Health and Environmen t al Impacts of Pestici d e Usage in 583 Peruvian and Ecuadorian Potato Production 5 23 353 EIQCDTDT PCSPSY LFRDSP ZP BP 2 here: nic toxicity ues half-life tial otential hropod toxicity by toxicity in- fo ever, for ntal impact (EI) of each a.i. per hectare (h active ingredient × is the amount of formulation in ki- lo of Potato nts in A coeriment was implemented three times in ra- hu us w C = chro DT = dermal toxicity P = plant surface resid S = soil residues half-life SY = systemicity L = leaching poten F = fish toxicity R = surface loss p D = bird toxicity Z = bee toxicity B = beneficial art Values in the equation are determined rmation from several sources including the Extension Toxicology Network (EXTOXNET), CHEM-NEWS, SELCTV, individual chemical manufacturers’ data sheets, and public data sources, such as those available from the US Environmental Protection Agency [13]. The mini- mum EIQ for a pesticide active ingredient (a.i.) is 6.7 and the maximum 210. Most EIQ values used in this study were taken from a database of over 450 a.i. that are cur- rently available on a Cornell Uni versity website (http://nysipm.cornell.edu/publications/eiq/). How some pesticide a.i. that were not available at that site, we used the EIQ of a chemically similar product which be- longed to the same hazard classification of the World Health Organization (WHO) [8]. For example, benalaxyl and oxycarboxin, not on the published list, were given the value of 15.55, which is the average value of the chemically similar fenhexamid and carboxin, which are on the list. All four products are classified as “U”, un- likely to present acute hazard in normal use, in the WHO classification. The environme a) was calculated for each individual field or experi- mental plot with the following formula: EI per ha = EIQ × [dosage ha–1] × %- no. applications; Where dosage ha–1 grams or liters per ha. The total EI per ha was calcu- lated by summing the EI per ha for each individual a.i., across all applications of the season. 2.2. Environmental Impact (EI) Production Systems in Field Experime Ecuador ntrolled exp Ecuador in important potato production zones. The ex- periments were designed to give estimates of EI of dif- ferent production practices ranging from those consid- ered most ecological to those highly dependent on pesti- cides. One trial was conducted in the CIP-Quito experi- mental station in the province of Pichincha in 2008, a second in a farmer’s field in San Vincente de Tiazo in the province of Chimborazo also in 2008 and a third in a farmer’s field in Pillaro in the province of Tungurahua in 2009. The experiments were designed to estimate the environmental and health hazards of six different potato management systems (Table 1). Each system included a potato cultivar and technology package. The technology packages were designed in consultation with farmers and workers from the national potato program. The trials in- cluded the cultivars Fripapa, Superchola and Capiro, which were combined with conventional practices which depend heavily, but to a varying degree, on pesticide inputs, and the late blight resistant and early maturing breeding varieties C8, C11 and CIP 575045, which were combined with IPM practices recommended by CIP and national partner scientists. Thus, conventional production systems differed from IPM production systems in that the former generally included both more applications of pes- ticides and also pesticides with higher EIQ values (Table 1). For example, conventional systems used sys- temic/transla- minar fungicides such as dimethomorph (EIQ = 24.01) and cymoxanil (EIQ = 35.48) and the contact fungicides mancozeb (EIQ = 25.72) and chlorothalonil (EIQ = 37.42), while the IPM systems generally used phosphonate fungicides (EIQ = 8.67) (Table 1). A similar situation existed for insecticides. CIP 575045 was not included in the trial in Tungu a. Conventional farmer practices for the first three cul- tivars consisted of calendar sprays with pesticides that were selected based on interviews with farmers who reg- ularly grew the cultivars and selected pesticides accord- ing to the pests that were present and the perceived se- verity of late blight. Several pesticides were used to rep- resent common pesticide choices in the different prov- inces. For the management systems based on IPM prac- tices, late blight was treated by spraying primarily with phosphonate fungicides after each 50 mm accumu- lated rainfall [26]. IPM insect control consisted of traps for Andean potato weevil, monitoring and, when needed, applications primarily with the insecticides acephate and deltamethrin, both with relatively low EIQ values (Table 3) for control of weevil and flea beetle respectively [27]. At all sites a randomized complete block design was ed with four replicates. To verify natural pest and dis- ease levels, six additional control plots with each of the six cultivars (five in Tungurahua) without pesticide ap- plications were included. Plot size was approximately 6 × 6 m with an intra-row distance of 0.8 m for all cultivars Copyright © 2011 SciRes. JEP  Use of the Environmental Impact Quot i ent to Estimate Health and Environmen t al Impacts of Pestici d e Usage in Peruvian and Ecuadorian Potato Production Copyright © 2011 SciRes. JEP 584 inix different potato pest management systems in field trials Integrated pest management system1 Tabel 1. Pesticide active ingredients and range of sprays used s carried out at three locations in Ecuador in 2008 and 2009. Active ingredients Capiro-C and Super chola-C C8 and C11 Fripapa-C CIP 575045 Fungicide2 Number of spray 3 - 11 2 - 8 ph 0 - 0 Phosphonate 0 -0 -0 - ide mber of sprays 1 - 3 1 - 3 1 1 / Carbosulfan 0 1 - s s Cymoxanil Dimethomor2 - 3 1 - 2 1 Fosetyl-Al 2 - 4 2 - 3 2 - 4 - 1 Metalaxyl 2 - 5 2 - 4 0 - 1 0 - 1 Ca-,Cu-or K- 2 - 3 Chlorothalonil 2 2 1 1 - 3 Mancozeb 3 - 7 2 - 4 0 - 1 Maneb / Propineb 0 - 3 0 - 2 Sulfur 0 - 4 0 - 3 Insectic Nu Acephate Carbofuran0 - 6 0 - 2 - 1 Deltamethrin 1 - 3 1 - 3 3 1 - 3 Methamidopho1 - 2 1 - 2 Profenofos 2 - 3 1 - 2 1nvolves one potato variety and a peshnology package. Thoowed by “C” are considered conventional and are deved from inter- xcept Superchola and Capiro, which were planted with r Survey nt department of the numbers of farmers were recruited from the three dis- een June and Au- farmer participa- Each system iticide tecse follri views with farmers and consultations with local potato researchers. The others are based on integrated disease and pest management recommendations. See Table 2 for more information on locations and Table 3 for EIQ values of pesticides; 2Cymoxanil, dimethomorph and metalaxyl were used in mixture with a contact fungicide. e an intrarow distance of 1.1 m as is commonly done by farmers. Cultural practices and fertilization were done following recommendations for each cultivar indivi- dually and the latter was based on soil analyses. Pesti- cides included in the treatments were applied with 20-liter lever-operated knap-sack sprayers with constant flow valves (CFValve R11–16SY; G.A.T.E, Sebastian, FL). The three experiments were all planted to coincide with th e rainy season to insure natural late blight disease pressure. To differentiate experimental units and reduce potential interference effects of pesticide drift or patho- gen/pest spread, all plots were surrounded with 1 to 2 m of oats (Avena sativa). 2.3. Peruvian Farme Three districts, each from a differe Peruvian highlands were selected for the study (Table 3). La Encañada and Huamachuco are in the departments of Cajamarca and La Libertad, respectively, both in north- ern Peru, while Chaglla is in the department of Huánuco in central Peru. These zones were selected because of their importance in Peruvian potato production. A total of 307 farmers were surveyed between March and April of 2006 to gather information about potato production dur- ing their most recent crop cycle. Approximately equal tricts. In La Encañada 101 farmers were interviewed; in Huamachuco 104; and in Chaglla 102, representing ap- proximately 4.9%, 5.5% and 46.1% of the potato area in each respective district. Average potato area per farmer differed substantially, with 0.89 ha in La Encañada, 1.55 ha in Huamachuco and 4.96 ha in Chaglla. All farms included in the survey were located more than 3000 m above sea level (m.a.s.l). The survey included questions on farm and potato plot sizes, varieties grown and details of pesticide use. Data were collected by agronomists vis- iting the farms and interviewing the farm owners. Data were based primarily on farmers’ perceptions, but at times the interviewers attempted to verify the answers by in- specting equipment, plots or pesticide stocks. 2.4. Ecuadorian Farmer Survey A detailed survey was carried out betw gust of 2007 to analyze the impact of tion in a program aimed at fomenting associations in the central region of Ecuador. Those who participated in the program received some IPM training. Data were col- lected in the provinces of Chimborazo and Tungurahua, two important potato production zones, which represent typical smallholder farming in the central Ecuadorian highlands. All data were collected for production fields 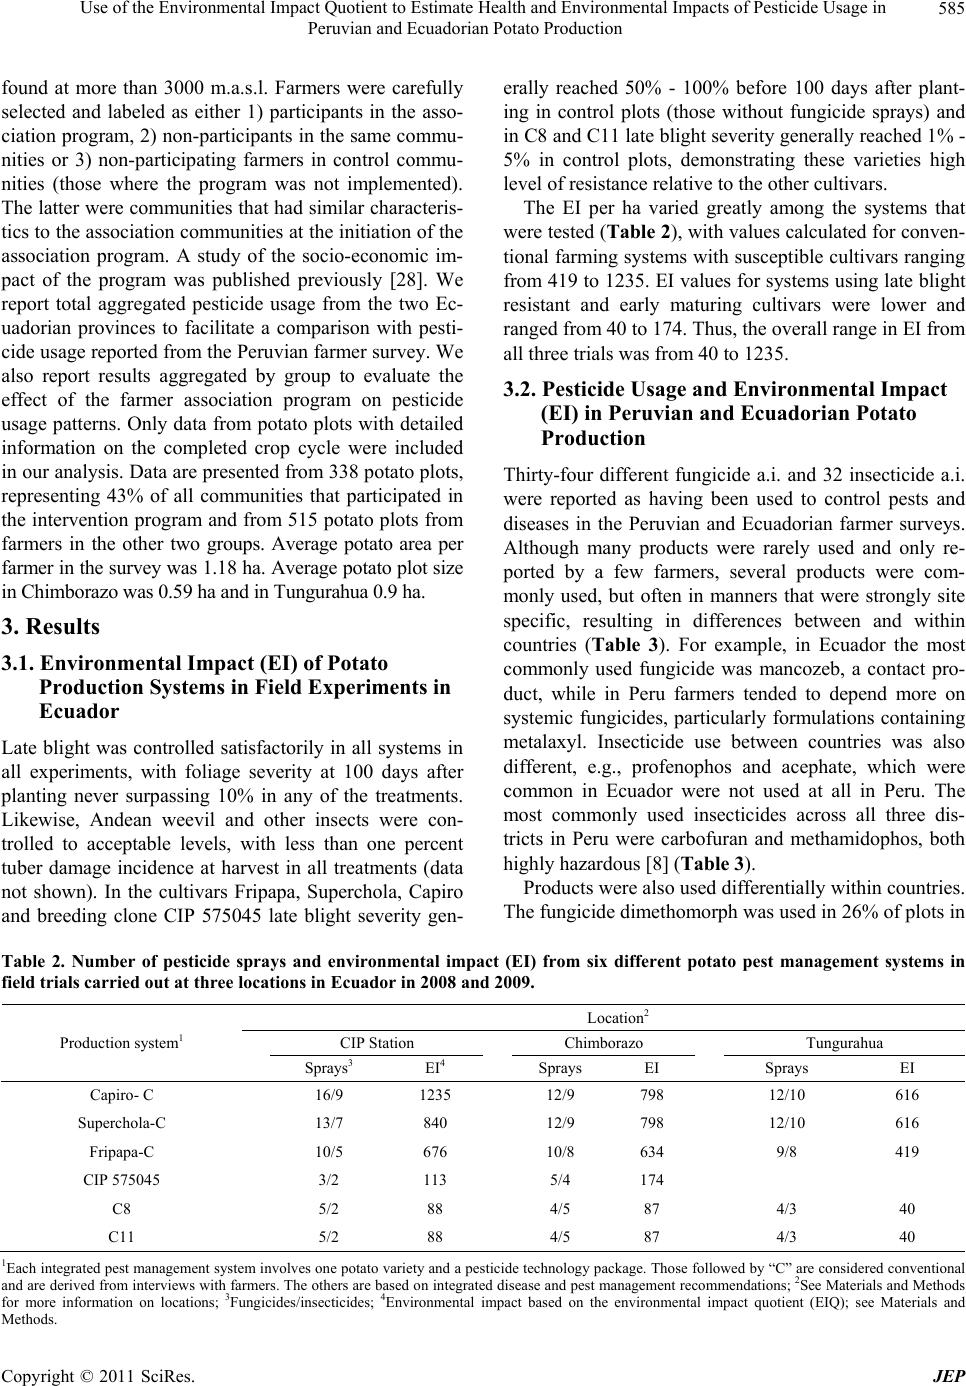 Use of the Environmental Impact Quot i ent to Estimate Health and Environmen t al Impacts of Pestici d e Usage in 585 Peruvian and Ecuadorian Potato Production mental Impact (EI) of Potato ion Systems in Field Experiments in Late all e with foliage severity at 100 days after ms that w mental Impact Thir t fungicide a.i. and 32 insecticide a.i. Th Table 2. Number of pesticide sprays and environmental impact (EI) from six different potato pest management systems in Location2 found at more than 3000 m.a.s.l. Farmers were carefully selected and labeled as either 1) participants in the asso- ciation program, 2) non-participants in the same commu- nities or 3) non-participating farmers in control commu- nities (those where the program was not implemented). The latter were communities that had similar characteris- tics to the association communities at the initiation of the association program. A study of the socio-economic im- pact of the program was published previously [28]. We report total aggregated pesticide usage from the two Ec- uadorian provinces to facilitate a comparison with pesti- cide usage reported from the Peruvian farmer survey. We also report results aggregated by group to evaluate the effect of the farmer association program on pesticide usage patterns. Only data from potato plots with detailed information on the completed crop cycle were included in our analysis. Data are presented from 338 potato plots, representing 43% of all communities that participated in the intervention program and from 515 potato plots from farmers in the other two groups. Average potato area per farmer in the survey was 1.18 ha. Average potato plot size in Chimborazo was 0.59 ha and in Tungurahu a 0.9 ha. 3. Results 3.1. Environ Product Ecuador blight was controlled satisfactorily in all systems in xperiments, planting never surpassing 10% in any of the treatments. Likewise, Andean weevil and other insects were con- trolled to acceptable levels, with less than one percent tuber damage incidence at harvest in all treatments (data not shown). In the cultivars Fripapa, Superchola, Capiro and breeding clone CIP 575045 late blight severity gen- erally reached 50% - 100% before 100 days after plant- ing in control plots (those without fungicide sprays) and in C8 and C11 late blight severity generally reached 1% - 5% in control plots, demonstrating these varieties high level of resistance relative to the other cultivars. The EI per ha varied greatly among the syste ere tested (Table 2 ), with values calculated for conven- tional farming systems with susceptible cultivars ranging from 419 to 1235. EI values for systems using late blight resistant and early maturing cultivars were lower and ranged from 40 to 174. Thus, the overall range in EI from all three trials was from 40 to 1235. 3.2. Pesticide Usage and Environ (EI) in Peruvian and Ecuadorian Potato Production ty-four differen were reported as having been used to control pests and diseases in the Peruvian and Ecuadorian farmer surveys. Although many products were rarely used and only re- ported by a few farmers, several products were com- monly used, but often in manners that were strongly site specific, resulting in differences between and within countries (Table 3). For example, in Ecuador the most commonly used fungicide was mancozeb, a contact pro- duct, while in Peru farmers tended to depend more on systemic fungicides, particularly formulations containing metalaxyl. Insecticide use between countries was also different, e.g., profenophos and acephate, which were common in Ecuador were not used at all in Peru. The most commonly used insecticides across all three dis- tricts in Peru were carbofuran and methamidophos, both highly hazardous [8] (Ta ble 3). Products were also used differentially within countries. e fungicide dimethomorph was used in 26% of plots in field trials carried out at three locations in Ecuador in 2008 and 2009. CIP Station ChTungurahua imborazo Production system1 Spray EI4 Sprays Sprays EI s3 EI Capiro- C 16/9 1235 12/9 798 12/10 616 S 4/3 40 uperchola-C 13/7 840 12/9 798 12/10 616 Fripapa-C 10/5 676 10/8 634 9/8 419 CIP 575045 3/2 113 5/4 174 C8 5/2 88 4/5 87 C11 5/2 88 4/5 87 4/3 40 1Each integrated anagement systemnvolves otato variety a pesticide tech packagse followed by “e consid ered cotional pest m ione p andnologye. ThoC” arnven and are derived from interviews with farmers. The others are based on integrated disease and pest management recommendations; 2See Materials and Methods for more information on locations; 3Fungicides/insecticides; 4Environmental impact based on the environmental impact quotient (EIQ); see Materials and Methods. Copyright © 2011 SciRes. JEP 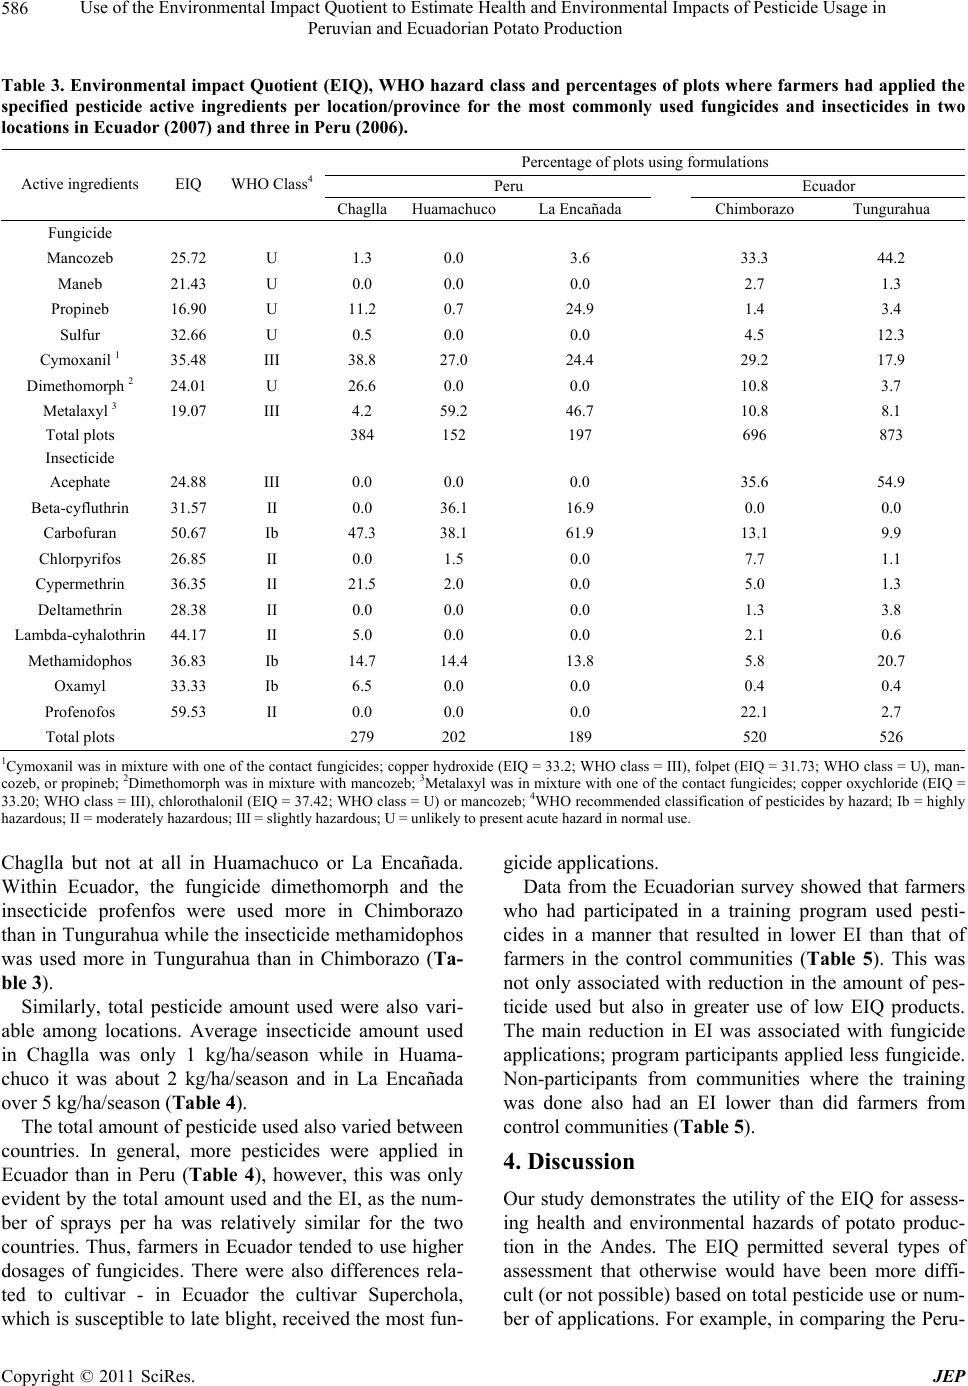 Use of the Environmental Impact Quot i ent to Estimate Health and Environmen t al Impacts of Pestici d e Usage in 586 Peruvian and Ecuadorian Potato Production Percentage of plots using formulations Table 3. Environmental impact Quotient (EIQ), WHO hazard class and percentages of plots where farmers had applied the specified pesticide active ingredients per location/province for the most commonly used fungicides and insecticides in two locations in Ecuador (2007) and three in Peru (2006). Perucuador E Active ingredients EIQ WHO Class4 ChagllaHuamachucoazo ungurahua La Encañada ChimborT Fungicide Mancozeb 251.0334 Cy D2 248 III Ben Lain P .72 U 3 .0 .6 3.3 4.2 Maneb 21.43 U 0.0 0.0 0.0 2.7 1.3 Propineb 16.90 U 11.2 0.7 24.9 1.4 3.4 Sulfur 1 32.66 U 0.5 0.0 0.0 4.5 12.3 moxanil 35.48 III 38.8 27.0 24.4 29.2 17.9 imethomorph 24.01 U 26.6 0.0 0.0 10.8 3.7 Metalaxyl 3 19.07 III 4.2 59.2 46.7 10.8 8.1 Total plots Insecticide 384 152 197 696 873 Acephate .80 .00 .00 .0 3 5.65 4.9 ta-cyfluthri31.57 II 0.0 36.1 16.9 0.0 0.0 Carbofuran 50.67 Ib 47.3 38.1 61.9 13.1 9.9 Chlorpyrifos 26.85 II 0.0 1.5 0.0 7.7 1.1 Cypermethrin 36.35 II 21.5 2.0 0.0 5.0 1.3 Deltamethrin 28.38 II 0.0 0.0 0.0 1.3 3.8 mbda-cyhalothr44.17 II 5.0 0.0 0.0 2.1 0.6 Methamidophos 36.83 Ib 14.7 14.4 13.8 5.8 20.7 Oxamyl 33.33 Ib 6.5 0.0 0.0 0.4 0.4 rofenofos59.53 II 0.0 0.0 0.0 22.1 2.7 Total plots 279 202 189 520 526 1Cymoixture w of thect fung copper hide (EIQ = 33.O class = III), folpet ( 31.73; WHO clU), man- cozeb, or pr2Dimethomorph was in mixture with mozeb; 3Mas in mixtureith one of th contact funs; copper oxych (EIQ = ds of potato produc- . The EIQ permitted several types of xanil was in m opineb; ith one contaicides; anc ydrox etalaxyl w2; WH wEIQ = gicide ass = loridee 33.20; WHO class = III), chlorothalonil (EIQ = 37.42; WHO class = U) or mancozeb; 4WHO recommended classification of pesticides by hazard; Ib = highly hazardous; II = moderately hazardous; III = slightly hazardous; U = unlikely to present acute hazard in normal use. haglla but not at all in Huamachuco or La Encañada. gicide applications. C Within Ecuador, the fungicide dimethomorph and the insecticide profenfos were used more in Chimborazo than in Tungurahua while the insecticide methamidophos was used more in Tungurahua than in Chimborazo (Ta- ble 3). Similarly, total pesticide amount used were also vari- able among locations. Average insecticide amount used in Chaglla was only 1 kg/ha/season while in Huama- chuco it was about 2 kg/ha/season and in La Encañada over 5 kg/ha/season (Table 4). The total amount of pesticide used also varied between countries. In general, more pesticides were applied in Ecuador than in Peru (Table 4), however, this was only evident by the total amount used and the EI, as the num- ber of sprays per ha was relatively similar for the two countries. Thus, farmers in Ecuador tended to use higher dosages of fungicides. There were also differences rela- ted to cultivar - in Ecuador the cultivar Superchola, which is susceptible to late blight, received the most fun- Data from the Ecuadorian survey showed that farmers who had participated in a training program used pesti- cides in a manner that resulted in lower EI than that of farmers in the control communities (Table 5). This was not only associated with reduction in the amount of pes- ticide used but also in greater use of low EIQ products. The main reduction in EI was associated with fungicide applications; program participants applied less fungicide. Non-participants from communities where the training was done also had an EI lower than did farmers from control communities (Table 5). 4. Discussion Our study demonstrates the utility of the EIQ for assess- ing health and environmental hazar tion in the Andes assessment that otherwise would have been more diffi- cult (or not possible) based on total pesticide u se or num- ber of applications. For example, in comparing the Peru- C opyright © 2011 SciRes. JEP 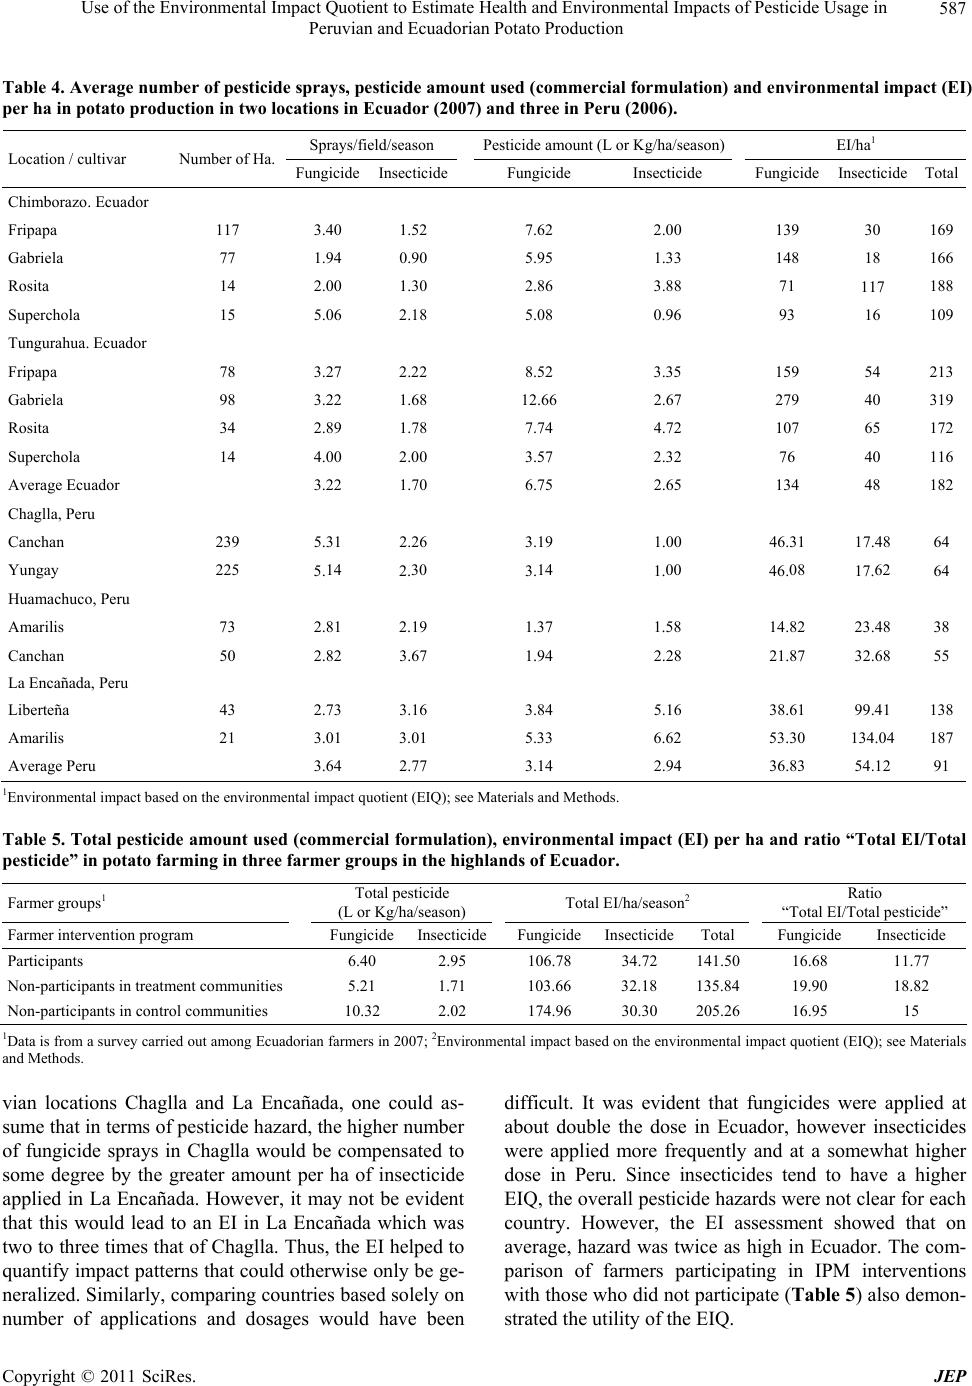 Use of the Environmental Impact Quot i ent to Estimate Health and Environmen t al Impacts of Pestici d e Usage in 587 Peruvian and Ecuadorian Potato Production t u ) and three in Peru (2006). Table 4. Average number of pesticide sprays, pesticide amounsed (commercial formulation) and environmental impact (EI) per ha in potato production in two locations in Ecuador (2007 Sprays/field/season Pesticide amount (L or Kg/ha/season) EI/ha1 Location / cultivar Number of Ha. Fungicide InsecticideFungicide Insecticide Fungicide InsecticideTotal Chimborazo. Ecuador Fripapa 117 3.40 1. 1.52 0. 7.62 5. 2.00 1. 139 148 30 18 169 166Gabriela 77 117 Ecuador 159 98 3.1.12.2.279 40 319 uador 46. 17. 5.2.3.1.46.17.64 Peru 138 94 90 95 33 Rosita 14 2.00 1.30 2.86 3.88 71 188 Superchola 15 5.06 2.18 5.08 0.96 93 16 109 Tungurahua. Fripapa 78 3.27 2.22 8.52 3.35 54 213 Gabriela 22 68 66 67 Rosita 34 2.89 1.78 7.74 4.72 107 65 172 Superchola c 14 4.00 2.00 3.57 2.32 76 40 116 Average E 3.22 1.70 6.75 2.65 134 48 182 Chaglla, Peru Canchan 239 5.31 2.26 3.19 1.00 31 48 64 Yungay 225 14 30 14 00 08 62 Huamachuco, Amarilis 73 2.81 2. 2.19 3. 1.37 1.58 1. 14.82 21. 23.48 32. 38 55 Canchan 50 Peru 82 67 94 2.28 87 68 La Encañada, Liberteña 43 2.73 3.16 3.84 5.16 38.61 99.41 Amarilis 21 3.01 3.01 5.33 6.62 53.30 134.04 187 Average Peru 3.64 2.77 3.14 2.94 36.83 54.12 91 1ntal impac t based on theironmentalt quotie); see MateriaMethods. l pesticide amot used (commercial formulation), enmental impI) per hatio “Total EI/T Environme env impacnt (EIQls and Table 5. Totaunvironact (E and raotal pesticide” in potato farming in three farmer groups in the highlands of Ecuador. Farmer groups1 Total pesticide (L or Kg/ha/season) Total EI/ha/season2 Ratio “Total EI/Total pesticide” Farmer intervention p rogram Fungicide InsecticideFungicideInsecticideTotal Fungicide Insecticide Participants 6.40 2.95 106.78 141.50 16.68 11.77 34.72 Non-participants in treatment communities 103.66 munities 5.21 1.71 32.18 135.84 19.90 18.82 Non-participants in control com 10.32 2.02 174.96 30.30 205.26 16.95 15 1Data is from a survey carried out among Ecua and Methods. dn far 2007; nmentaased oroctt (EIQ); srials terms of pesticide hazard, the higher number f fungicide sprays in Chaglla would be compensated to about double the dose in Ecuador, however insecticides were applied more frequently and at a somewhat higher oriamers in2Envirol impact bn the envinmental impa quotienee Mate vian locations Chaglla and La Encañada, one could as- sume that indifficult. It was evident that fungicides were applied at o some degree by the greater amount per ha of insecticide applied in La Encañada. However, it may not be evident that this would lead to an EI in La Encañada which was two to three times that of Chaglla. Thus, the EI helped to quantify impact patterns that could otherwise only be ge- neralized. Similarly, comparing countries based solely on number of applications and dosages would have been dose in Peru. Since insecticides tend to have a higher EIQ, the overall pesticide hazards were not clear for each country. However, the EI assessment showed that on average, hazard was twice as high in Ecuador. The com- parison of farmers participating in IPM interventions with those who did not participate (Table 5) also demon- strated the utility of the EIQ. Copyright © 2011 SciRes. JEP  Use of the Environmental Impact Quot i ent to Estimate Health and Environmen t al Impacts of Pestici d e Usage in 588 Peruvian and Ecuadorian Potato Production cies related to methodo- lo thermore, the number of fungicide applications w s [30]. Kr he farmers. The high application rate re ming pro- gr r ha per season as farmers in Hua- m The observation above on dosages highlights one of the potential limitations of this approach that should be controlled as much as possible in future applications of the EIQ. The very large differences in fungicide dosages between Ecuadorian and Peruvian farmers stimulated us to consider possible discrepan gy used in the surveys. As noted, these data are prima- rily collected from farmer memory. Furthermore, there are a number of estimations involved in the calculation of dosage per ha, including area, volume of solution applied per area, and even the concentration of the product in the solution. Under general production practices, these things are not usually measured precisely and a parti cular com- ponent of the dosage estimation may vary greatly among farmers. For example, one study in Ecuador de- monstrated that volumes of pesticide applied per ha per application ranged from 300 to over 900 L depending on spray equipment [29]. The published documents from the surveys we studied do not permit us to identify possible factors that may have affected estimates of dosage in either Ecuador or Peru, but the study does highlight the need to verify the accuracy of dosage data taken in future surveys. This is another utility of the EIQ. As with any meta-analysis, the EIQ can help iden- tify extreme differences that may represent reality or may represent artifacts, but nonetheless warrant verifi- cation. Our field study in Ecuador indicated that potato pro- duction in the Andes could be expected to have EI values ranging from less than 100 to more than 100 0 (Table 2). The values from the two farmer surveys all fell within this range but in all cases toward the lower part of the range. Fur as lower than expected in all cases. Earlier surveys had placed the average number of fungicide applications in Peru at 6 [5] and in Ecuador at 7 [6,7], both of which are higher than values reported in the surveys herein. In spite of the data reported in the recent surveys, we consider that the upper boundaries set by the Ecuadorian study are not unrealistic. Oyarzun et al. [3] reported that farmers in northern Ecuador sometimes spray potato crops as much as 18 times per season, and another study reported a similarly high number of application omann et al. [26] found that cultivars susceptible to late blight could not be protected in Peru or Ecuador us- ing weekly or even 5-day schedules of application with a contact fungicide. The relatively low number of fungicide applications reported in the recent surveys could result from several factors, including cultivar resistance, prevailing weather conditions, access to and price of fungicides and the fi- nancial capacity of the farmers, and the disease manage- ment capacity of t ported by Oyarzun et al. [3] was from northern Ecua- dor where farmers were growing the cultivar Capiro, which is probably more susceptible than any used by farmers in the surveys reported herein. The northern Ec- uador farmers are also relatively large-scale and have resources to buy inputs. Finally, these far mers often grow Capiro under contract for potato chip production and are therefore assured a good price. A survey done in 2006 by the Ecuadorian national potato program (unpublished) found that small-scale farmers in the central parts of the country generally tend to apply less pesticide than their compatriots in the north. Therefore, cost of fungicides and household economies may have influenced the amounts used in the surveys. This hypothesis is less evi- dent in Peru where the larger farmers in Chaglla applied more fungicide but less insecticide (Table 4). Late blight severity was not measured in the two surveys reported herein so we do not know if the interviewed farmers were successful in controlling the disease. At least one study from Bolivia indicated that many farmers do not spray enough for adequate control of late blight [31]. Farmers with training tend more so than other farmers to adjust the amount of fungicide for the level of resistance in the cultivar and for weather conditions [9]. In the case of Ecuador in our study, training also was associated with differences in the amount of fungicide used, but this was less evident with insecticides (Table 5). Other studies using the EIQ have also reported high EI values. In some of the locations studied in Europe, EI per hectare in tomato production was over 1000 and on the island of Reunion EI per hectare (tomato) was over 1500 [32]. Tomato producers in Reunion used about 40 kg·ha–1 of pesticide per season. In our study, the far am at the CIP-Quito experimental site with cultivar Capiro involved 63 kg·ha-1 of pesticide per season result- ing in an EI of 1235. Yield data from the Ecuadorian and Peruvian farmer surveys indicated that productivity was highly variable among farmers and not clearly associated with EI. In the three study locations in Peru, yield ranged from about 5 t·ha–1 to 30 t·ha–1 (data is not shown). Farmers in Chaglla had similar total EI pe achuco, but their average productivity was about three times that of the latter. On the other hand, farmers in Huamachuco had similar productivity but a much higher EI than farmers in La Encañada. Average yield for farm- ers participating in the intervention program in Ecuador was 8.4 t·ha–1 and the average yield for non-participating farmers in the two control farmer groups in Ecuador was 6.3 t·ha–1 (data not shown). The extent to which pesticide use may have influenced yields is not known. C opyright © 2011 SciRes. JEP  Use of the Environmental Impact Quot i ent to Estimate Health and Environmen t al Impacts of Pestici d e Usage in 589 Peruvian and Ecuadorian Potato Production and limi- ta ide usage ac robable or definite risk to hu- m lications in five zones in the high- la pesticide use patterns, and particularly to com- pa ys in Ecuador. This research was funded by er (CIP) with support from elopment Assistance (DAN- Numerous tools have been developed to assess envi- ronmental and human health hazards or risks associated with pesticide use [12,14]. Levitan et al. [14] classified a number of tools as ranging from anecdotal accounts to holistic assessments of impact of agriculture. For each tool, examples, units of measure, objectives tions were presented [14]. Examples of recent scoring systems that have been used for pesticides include the Environmental Hazard Index and the Priority Substances List in Canada [16]; the Ecological Relative Risk indica- tor in Austria [33], the European Risk Ranking method (EURAM); the Chemical Hazard Evaluation for Man- agement Strategies from University of Tennessee; and Purdue Research Foundation’s Pollution Prevention Pro- gress Measurement Method in the USA [12]. The EIQ is an external analysis, insensitive to site- specific data, which makes the method insensitive to lo- cal environmental parameters, but also highly practical as there is no need for detailed information that often is not available in developing countries. The primary advantage of using a common metric for comparing pestic ross time and space is that it can facilitate comparisons across these dimensions and among crops. However, for such comparisons there is an underlying assumption that the metric is appropriate for all locations. The EIQ is composed of three hazard components: farm worker, consumer and environment, which obviously are not the same in all locations. Based on a rapidly increasing body of knowledge, hazards to farm workers (and their fami- lies) is higher in the developing world than in industria- lized countries [34,35]. The current EIQ values do not take into account differences in application technology or in use of personal protective equipment (Kovach J, pers. comm.) and hence some overestimation in applicator exposure may occur in higher income countries, or even underestimation in developing countries where use of protective clothing is rare [4,29]. Greater bystander ex- posure might also be expected in lower and middle in- come countries where separation of agricultural opera- tions and home life is less clear. As well, potentially vul- nerable fauna may have greater exposure due to unsafe pesticide use practices e.g. washing backpack sprayers in streams, or may themselves be more susceptible to pesti- cide toxicity due to species differences and variation in environmental conditions. The EIQ, e.g., is heavily weighted to assess impacts on beneficial insects of apple production in the USA, for which the equation was originally developed, and there are particular limits for the human health component. Firstly, the use of a limited range of ordinal ratings to assign an a.i. a possible, p an health and the low ordinal values assigned to these ratings dilute the underlying extent of variability in toxi- city values that may be present. This ordinal ranking would cause the EIQ values assigned to a.i. to appear more similar in hazard level than would be reflected in the original data, subsequently attenuating the variation in the hazard present for different crops and geographic areas. Secondly, studies used for dermal toxicity (DT) values are entirely rabbit or rat based models with a.i. being applied directly to the skin. The EIQ should thus be modified in areas where farmers do use protective clothing, although, again, this would appear to be rare in developing countries. While, to our knowledge, this article is the first EIQ- based evaluation of pesticide use on potatoes in develop- ing countries, it follows other studies where the EIQ was used on other crops in low to lower-middle income coun- tries. Mazlan and Mumford [17] compared cabbage farm- ers and insecticide app nds of Malaysia. Bardenes-Perez and Shelton [18] used the EIQ to compare potential impact of cruciferous vege- tables growing in the Kenyan highlands and in three ar- eas in the Kullu Valley in India. Morse et al. [21] as- sessed the environmental impact of an agricultural shift to genetically modified cotton production in South Africa. Muhammetoglu and Uslu [36] used the EIQ to select the least detrimental pesticide from an evaluation of different pesticide management scenarios in an agricultural area in Turkey. At this time the EIQ appears to be an effective tool for comparing potato production patterns in the diverse con- ditions found in developing countries. It is understood that the EIQ primarily should be used as a tool for agri- cultural practitioners to rapidly assess the hazards associ- ated with re the relative differences among different pesticide use practices; it does not constitute a detailed risk as- sessment of a particular scenario. It is essential that the EIQ values from the Cornell University web page be constantly updated and adjusted with the latest health and environmental impact information on pesticides, and that agronomists and researchers in developing countries ex- plore ways to make the EIQ more representative of local conditions. 5. Acknowledgements We thank the Agricultural Development Economics Di- vision of the Food and Agriculture Organization of the United Nations for letting us analyze their data from farmer surve the International Potato Cent the Danish International Dev IDA) and the Canadian International Development Agen- Copyright © 2011 SciRes. JEP  Use of the Environmental Impact Quot i ent to Estimate Health and Environmen t al Impacts of Pestici d e Usage in 590 Peruvian and Ecuadorian Potato Production Potato ( tophthora infe Profile,” Proceed- 5, No. 3, July 2009, pp. 255- cy (CIDA). REFERENCES [1] A. Devaux, M. Ordinola, A. Hibon and R. Flores, “El sector papa en la región andina: Diagnostico y elementos para una visión estratégica (Bolivia, Ecuador y Perú),” Centro Internacional de la Papa, 2010. [2] R. Egúsquiza and W. Apaza, “Rancha of stans) in Peru. CountryPhy- ings the International Workshop Complementing Resis- tance to Late Blight (Phytophthora Infestolans) in the Andes, February 2001, International Potato Center, Lima, Peru, October 2002, pp. 27-37. [3] P. J. Oyarzún, C. D. Garzón, D. Leon, I. Andrade and G. A. Forbes, “Incidence of Potato Tuber Blight in Ecua- dor,” American Journal of Potato Research, Vol. 82, March 2005, pp. 117-122. [4] F. A. Orozco, D. C. Cole, G. A. Forbes, J. Kroschel, S. Wanigaratne and D. Arica, “Monitoring Adherence to the International FAO Code of Conduct on the Distribution and Use of Pesticides: Highly Hazardous Pesticides in Central Andean Agriculture and Farmers’ Rights to Health,” International Journal of Occupational and En- vironmental Health, Vol. 1 268. [5] O. Ortiz, P. Winters and H. Fano, “La percepción de los agricultores sobre el problema del tizón tardío o rancha (Phytophthora infestans) y su manejo: Estudio de casos en Cajamarca, Perú,” Revista Latinoamericana de la Papa, Vol. 11, No. 1, January 1999, pp.97-120. [6] C. Crissman, P. Espinosa and V. H. Barrera, “El uso de plaguicidas en la producción de papa en Carchi,” In: D. Yanggen, C. Crissman and P. Espinosa, Eds., Los Plaguicidas: Impactos en producción, salud y medio ambiente en Carchi, Ecuador, CIP – INIAP, Quito, 2003, pp. 9-24. [7] M. Paredes, “Peasants, Potatoes and Pesticides - Hetero- geneity in the Context of Agricultural Modernization in the Highland Andes of Ecuador,” Ph.D. Dissertation, Wageningen University, Wageningen, 2010. [8] IPCS (International Program on Chemical Safety), “The WHO Recommended Classification of Pesticides by Hazard and Guidelines to Classification 2004,” World Health Organization, June 2006. [9] O. Ortiz, K. A. Garrett, J. J. Heath, R. Orrego and R. J. Nelson, “Management of Potato Late Blight in the Peru- vian Highlands: Evaluating the Benefits of Farmer Field Schools and Farmer Participatory Research,” Plant Dis- ease, Vol. 88, May 2004, pp. 565-571. doi:10.1094/PDIS.2004.88.5.565 [10] CIMMYT, “La formulación de recomendaciones a partir de datos agronómicos: un manual metodológico de evaluación económica,” CIMMYT, México, 1988. [11] Food and Agriculture Organization of the United Nations, “Panel of Experts on Pesticide Management: Report on the Second Session, 7-10 November 2 , 006,” Rome, Italy Tools 2007. [12] C. Pittinger, T. Brennan, D. Badger, P. Hakkinen and M. C. Fehrenbacher, “Aligning Chemical Assessment across the Hazard-Risk Continuum,” Risk Analysis, Vol. 23, No. 3, June 2003, pp. 529-535. doi:10.1111/1539-6924.00333 [13] J. Kovach, C. Petzoldt, J. Degni and J. Tette, “A Method ach, “Assessing the ts of Agricultural Pesti- to Measure the Environmental Impact of Pesticides,” New York’s Food and Life Sciences Bulletin, No. 139, 1992, pp. 1-8. [14] L. Levitan, I. Merwin and J. Kov Relative Environmental Impac cides: The Quest for a Holistic Method,” Agriculture, Ecosystems and Environment, Vol. 55, No. 3, October 1995, pp. 153-168. doi:10.1016/0167-8809(95)00622-Y [15] J. Maud, G. Edwards-Jones and F. Quin, “Comparative Evaluation of Pesticide Risk Indices for Policy Develop- ment and Assessment in the United Kingdom,” Agricul- ture, Ecosystems and Environment, Vol. 86, No. 1, July 2001, pp. 59-73. doi:10.1016/S0167-8809(00)00258-9 [16] G. J. Gallivan, H. Berges and B. McGee, “Evaluation of 4 16/j.cropro.2004.06.005 the Changes in Pesticide Risk. Research Project SR9128: Survey of Pesticide Use and Evaluation of the Changes in Pesticide Risk on Agricultural Crops in Ontario,” June 2005. http://www.agcare.org/File.aspx?id=94b98a8e-8ec1-431 -a906-ca5eca7a435e [17] N. Mazlan and J. Mumford, “Insecticide Use in Cabbage Pest Management in the Cameron Highlands, Malaysia,” Crop Protection, Vol. 24, No. 1, January 2005, pp. 31-39. doi:10.10 ultural Practices among Farmers [18] F. R. Badenes-Perez and A. M. Shelton, “Pest Manage- ment and Other Agric Growing Cruciferous Vegetables in the Central and Western Highlands of Kenya and the Western Himalayas of India,” International Journal of Pest Management, Vol. 52, No. 4, 2006, pp. 303-315. doi:10.1080/09670870600819169 [19] P. Cross and G. Edwards-Jones, “Variation in Pesticide Hazard from Arable Crop Production in Great Britain from 1992 to 2002: Pesticide Risk Indices and Policy Analysis,” Crop Protection, Vol. 25, No. 10, October 2006, pp. 1101-1108. doi:10.1016/j.cropro.2006.02.013 rnative Way to Evalu-[20] T. J. Greitens and E. Day, “An Alte ate the Environmental Effects of Integrated Pest Man- agement: Pesticide Risk Indicators,” Renewable Agricul- ture and Food Systems, Vol. 22, No. 3, September 2007, pp. 213- 222. doi:10.1017/S1742170507001755 [21] S. Morse, R. Bennet and Y. Ismael, “Environmental Im- pact of Genetically Modified Cotton in South Africa,” Agriculture, Ecosystems and Environment, Vol. 117, No. 4, December 2006, pp. 277-289. doi:10.1016/j.agee.2006.04.009 [22] G. A. Kleter, R. Bhula, K. Bodnaruk, E.Carazo, A. S. Felsot, C. A. Harris, A. Katayama, H. A. Kuiper, K. D. Racke, B. Rubin, Y. Shevah, G. R. Stephenson, K. Ta- C opyright © 2011 SciRes. JEP  Use of the Environmental Impact Quot i ent to Estimate Health and Environmen t al Impacts of Pestici d e Usage in Peruvian and Ecuadorian Potato Production Copyright © 2011 SciRes. JEP 591 Crops and the Associ- ental Perspect naka, J. Unsworth, R. D. Wauchope and S. Wong, “Al- tered Pesticide Use on Transgenic ated General Impact from an Environmive,” Pest Management Science, Vol. 63, No. 11, September 2007, pp. 1107-1115. doi:10.1002/ps.1448 [23] M. Stenrod, H. E. Heggen, R. Bolli and O. M. Eklo, “Testing and Comparison of Three Pesticide Risk Indica- tor Models under Norwegian Conditions: A Case Study in the Skuterud and Heiabekken Catchments,” Agriculture, Ecosystems and Environment, Vol. 123, No. 1-3, January 2008, pp. 15-29. doi:10.1016/j.agee.2007.03.003 [24] C. A. Bahlai, YinGen Xue, C. M. McCreary, A. W. Schaafsma and R. H. Hallett, “Choosing Organic Pesti- cides over Synthetic Pesticides May Not Effectively Mitigate Environmental Risk in Soybeans,” PLoS ONE, Vol. 5, No. 6, 22 June 2010. doi:10.1371/journal.pone.0011250 [25] G. Brookes and P. Barfoot, “Global Impact of Biotech Crops: Environmental Effects, 1996-2008,” AgBioForum, Vol. 13, No. 1, 2010, pp. 76-94. [26] P. Kromann, A. Taipe, W. G. Perez and G. A. Forbes, “Rainfall Thresholds as Support Applications in the Control of Pota for Timing Fungicide to Late Blight in Ec- uador and Peru,” Plant Disease, Vol. 93, No. 2, February 2009, pp. 142-148. doi:10.1094/PDIS-93-2-0142 [27] P. Gallegos and G. Avalos, “Control integrado de and Agricultural Organization (FAO), tact Fungicide in the Control of Premnotrypes vorax (Hustache) mediante manejo de la población de adultos y control químico en el cultivo de papa,” Revista Latinoamericana de la Papa, Vol. 8, No. 1, 1995, pp. 55-60. [28] R. Cavatassi, M. Gonzale z, P. Winters, J. Andrade-P iedra, G. Thiele and P. Espinosa, “Linking Smallholders to the New Agricultural Economy: An Evaluation of the Plata- formas Program in Ecuador,” ESA Working Paper No. 09-06, Agricultural Development Economics Division (ESA), The Food Rome, Italy, 2009. [29] P. Kromann, D. Leon, A. Taipe, J. L. Andrade-Piedra, and G. A. Forbes, “Comparison of Two Strategies for Use of Translaminar and Con Potato Late Blight in the Highland Tropics of Ecuador,” Crop Protection, Vol. 27, No. 7, July 2008, pp. 1098- 1104. doi:10.1016/j.cropro.2008.01.006 [30] W. E. Peterson, A. Zuloaga, B. E. Swanson, J. E. Uquillas and C. Crissman, “El sistema tecnológico de la papa en el Ecuador,” Centro Internacional de la Papa, Fundagro, in the Andes,” In: Impact on a Changing World: e Environmental Impact of the Pesti- Eco- systems 1990. [31] R. Torrez, J. Tenorio, C. Valencia, R. Orrego, O. Ortiz, R. Nelson and G. Thiele, “Implementing IPM for Late Blight Program Report 1997-98, The International Potato Center, Lima, pp. 91-99. [32] R. Bues, M. Dadomo, J. P. Lyannaz, G. di Lucca, J. I. Macua Gonzalez, H. Prieto Losada and Y. Dumas, “Evaluation of th cides Applied in Processing Tomato Cropping,” Acta Horticulturae, No. 613, 2003, pp. 255-258. [33] F. Sánchez-Bayo, S. Baskaran and I. R. Kennedy, “Eco- logical Relative Risk (EcoRR): Another Approach for riSk Assessment of Pesticide s,” Agriculture, and Environment, Vol. 91, No. 1-3, September 2002, pp. 37-57. doi:10.1016/S0167-8809(01)00258-4 [34] C. Wesseling, M. Corriols and V. Bravo, “Acute Pesticide Poisoning and Pesticide Registration in Central America,” Toxicology and Applied Pharmacology, Vol. 207, No. 2, oxic Burden in an ental Impacts of pesti- Sup. 1, September 2005, pp. 697-705. [35] D. C. Cole, S. Sherwood, M. Paredes, L. H. Sanin, C. Crissman, P. Espinosa and F. Muñoz, “Reducing Pesti- cide Exposure and Associated Neurot Ecuadorian Small Farm Population,” International Jour- nal of Occupational and Environmental Health, Vol. 13, No. 3, July 2007, pp. 281-289. [36] A. Muhammetoglu and B. Uslu, “Application of Envi- ronmental Impact Quotient Model to Kumluca Region, Turkey to Determine Environm cides,” Water Science and Technology Journal, Vol. 56, No. 1, January 2007, pp. 139-145. doi:10.2166/wst.2007.445
|