 Journal of Environmental Protection, 2011, 2, 545-554 doi:10.4236/jep.2011.25063 Published Online July 2011 (http://www.scirp.org/journal/jep) Copyright © 2011 SciRes. JEP Distribution of Different Organotin and Organolead Compounds in Sediment of Suez Gulf Mohamed A. Shreadah1, Tarek O. Said1*, Safaa A. Abd El Ghani1, Abd El Moniem M. Ahmed2 1National Institute of Oceanography and Fisheries, Kayet Bay, Alexandria, Egypt; 2Chemistry Department, Faculty of Science, Alexandria University, Alexandria, Egypt. Email: tareksaideg@yahoo.co.uk Received January 2nd, 2011; revised March 7th, 2011; accepted April 11th, 2011. ABSTRACT Organotin and organolead compou nds were determined in sediments of the Suez Gulf. The con centra tion s of Tributyltin (TBT) ranged from 0.27 to 2.77 with an average value of 1.37 µg·g–1; dry wt. However, the concentrations of dibutyltin (DBT) ranged from 0.07 to 2.27 with an average value of 0.58 µg·g–1; dry wt. A significant correlation was found be- tween TBT and DBT with r = 0.82, (p = 0.05) indicating that the occu rrence of DBT is mainly related to the degrada- tion of TBT. Generally, the high concentration of TBT was attributed to shipping activity in harbours. In addition, Di- phenyltin (DPhT) concentrations ranged from not detected to 2.09 with an average of 1.10 µg·g–1 dry wt. Antifouling agents, industrial discharge and the influence of sewage discharge are the main sources of pollution by DPhT com- pounds in Suez Gulf. On the other side, organolead (OLC) concentrations ranged from 10.88 - 440.2 with an average of 168.7 ng·g–1; dry wt. A significant setting of OLC recorded in sediments of Suez Gulf was mainly attrib uted to cars ex- haust and/or spelling and direct evaporation of fuels. Keywords: Organotin, Organolead, Se diment , Suez Gulf, Egy pt 1. Introduction Organometallic compounds have different toxicological behavior compared to that of nonorganic compounds of the respective elements. Under environmental conditions metal-carbon bonds of the elements Sn and Pb are stable [1]. Organotin (OT) compounds have a broad range of applications and they are among the most widely used organometallic chemicals. Monobutyltin (MBT) and di- butyltin (DBT) compounds are used as thermal and UV stabilizers of polyvinylchloride (PVC) and as catalysts in the production of polyurethane foams and silicones. Tri- butyltin (TBT) and triphenyltin (TPhT) have been used as antifouling agents in pleasure boats, large ships and vessels, harbor structures, and aquaculture nets, as well as agrochemicals and general biocides [2]. Various bio- logical effects as a result of OTs exposure have been well documented. TBT, among OTs is of the most concern due to its direct introduction into the environment and its high toxicity; it has been shown that it was toxic to many embryonic and larval organisms even at low concentra- tions [3]. TBT compounds caused the reduction of mol- lusks growth [4], shell thickening in Pacific oysters [5] and imposex in gastropods [6-8]. Organotin compounds were measured in sediments of four different semi-en closed areas of the Mediterranean coast of Alexandria: the Eastern Harbor, Western Harbor, El-Max Bay and Abu-Qir Bay [9]. Due to the commercial trade activity inside the West- ern Harbor, in addition to the effect of wastes discharged from El Noubaria canal, it shows the highest concentra- tions of total tin (6.34 μg·g–1 dry wt), dibutyl tin (1.63 μg·g−1 wet wt), tributyl tin (0.33 μg·g−1; wet wt) and di- phenyl tin (1.06 μg·g−1; wet wt) compared with other locations. During the past decade it became gradually recognized that exploring and monitoring the concentration levels of the various ionic organolead species in the environment would be of major importance for a double reason; to elucidate a possible bio-geochemical cycle of lead and to paint out possible adverse effects, on man and the envi- ronment, associated with the wide spread use of tetra alkyllead compounds (TAL; PbR4, R = methyl or ethyl) as antiknock agents in gasoline. Tetraethyllead (TEL) and tetramethyllead (TML) were produced world-wide as anti-knocking additives for gasoline to increase octane numbers. The use of leaded gasoline over almost one century caused a ubiquitous pollution of the environment 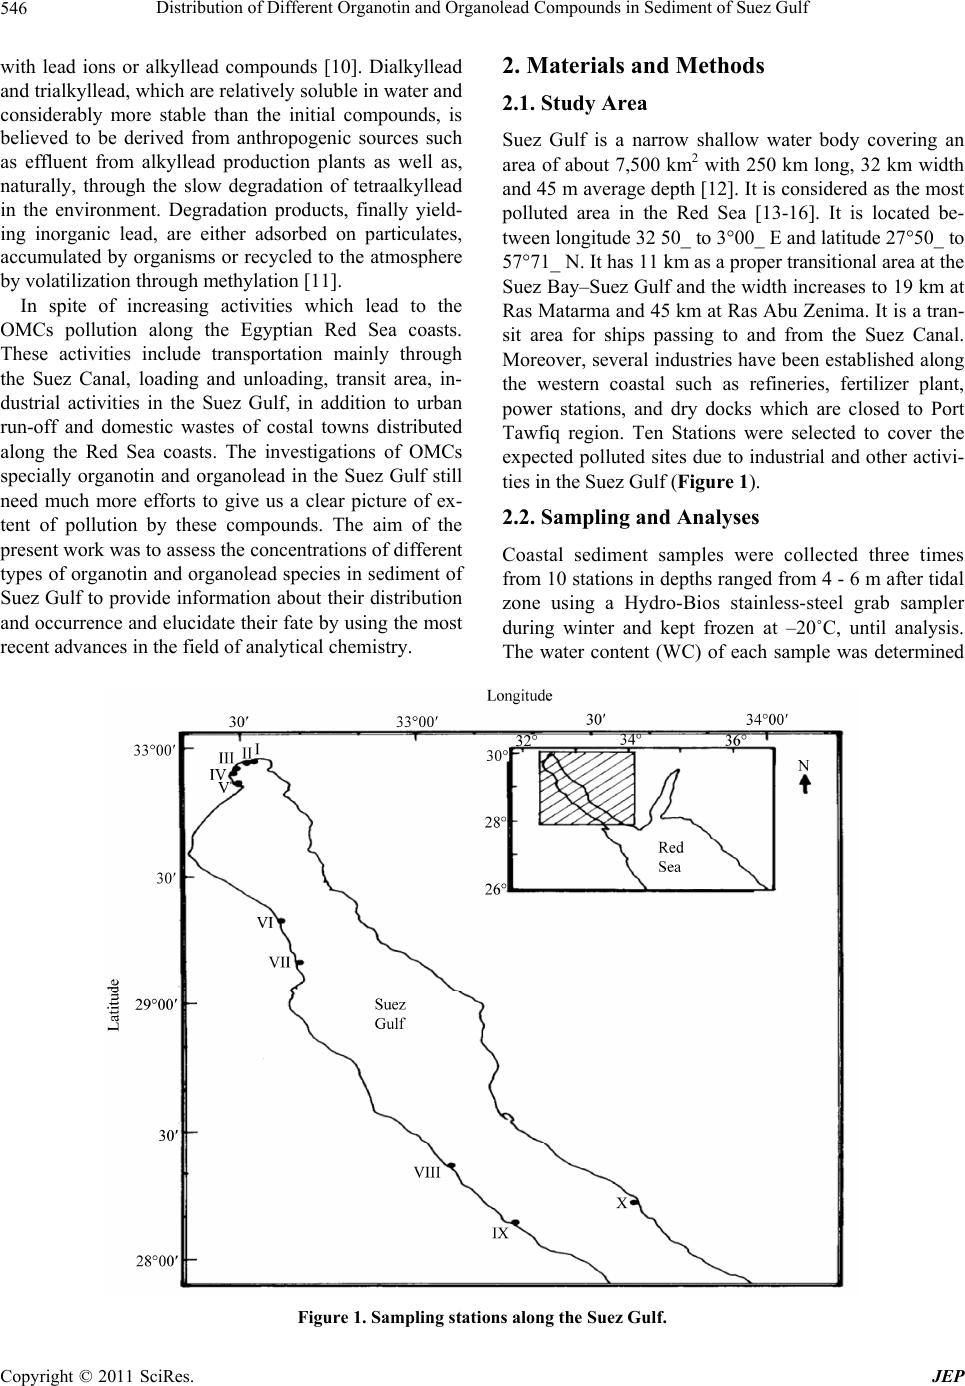 Distribution of Different Organotin and Organolead Compounds in Sediment of Suez Gulf 546 with lead ions or alkyllead compounds [10]. Dialkyllead and trialkyllead, which are relatively soluble in water and considerably more stable than the initial compounds, is believed to be derived from anthropogenic sources such as effluent from alkyllead production plants as well as, naturally, through the slow degradation of tetraalkyllead in the environment. Degradation products, finally yield- ing inorganic lead, are either adsorbed on particulates, accumulated by organisms or recycled to the atmosphere by volatilization through methylation [11]. In spite of increasing activities which lead to the OMCs pollution along the Egyptian Red Sea coasts. These activities include transportation mainly through the Suez Canal, loading and unloading, transit area, in- dustrial activities in the Suez Gulf, in addition to urban run-off and domestic wastes of costal towns distributed along the Red Sea coasts. The investigations of OMCs specially organotin and organolead in the Suez Gulf still need much more efforts to give us a clear picture of ex- tent of pollution by these compounds. The aim of the present work was to assess the concentrations of different types of organotin and organolead species in sediment of Suez Gulf to provide information about their distribution and occurrence and elucidate their fate by using the most recent advances in the field of analytical chemistry. 2. Materials and Methods 2.1. Study Area Suez Gulf is a narrow shallow water body covering an area of about 7,500 km2 with 250 km long, 32 km width and 45 m average depth [12]. It is considered as the most polluted area in the Red Sea [13-16]. It is located be- tween longitude 32 50_ to 3°00_ E and latitude 27°50_ to 57°71_ N. It has 11 km as a proper transitional area at the Suez Bay–Suez Gulf and the width increases to 19 km at Ras Matarma and 45 km at Ras Abu Zenima. It is a tran- sit area for ships passing to and from the Suez Canal. Moreover, several industries have been established along the western coastal such as refineries, fertilizer plant, power stations, and dry docks which are closed to Port Tawfiq region. Ten Stations were selected to cover the expected polluted sites due to industrial and other activi- ties in the Suez Gulf (Figure 1). 2.2. Sampling and Analyses Coastal sediment samples were collected three times from 10 stations in depths ranged from 4 - 6 m after tidal zone using a Hydro-Bios stainless-steel grab sampler during winter and kept frozen at –20˚C, until analysis. The water content (WC) of each sample was determined Figure 1. Sampling stations along the Suez Gulf. C opyright © 2011 SciRes. JEP  Distribution of Different Organotin and Organolead Compounds in Sediment of Suez Gulf547 by drying a representative sample in an oven at 105˚C overnight to a constant weight. Moreover, organic carbon was determined using acid/dichromate titration method [17]. Grain- size analysis was carried out using the con- ventional method [18]. About 30 g of washed and quar- tered dried sample was subjected to the combined tech- nique of dry sieving and pipette analysis. Porosity % was calculated according to the equation Porosity = (WC/1.02)/[(1–WC)/2.64 + WC/1.02] [19]. Total tin and total lead compounds in sediment samples were deter- mined according to UNEP/IAEA [20]. 0.5 g of dry sedi- ment sample was completely digested in Teflon vessels using a mixture of HNO3, HF and HClO4 (3:2:1 V/V) and triplicate digestions were made for each sample. The final solution was diluted to 25 ml with distilled de-ion- ized water. All digested solutions were analyzed by using inductively coupled plasma instrument; ICP (Spectro Analytical instruments Gmbh, Boschstra Be 10, D-47533 Kleve/Germany, 7431/95). Accuracy and precision were checked by using reference material (SD-M-2/IM marine sediment) provided by the National Research Council of Canada (Analytical results of the quality control samples indicated a satisfactory performance of heavy metals determination within the range of certified values with 90.4% - 97.5% recovery for studied metals. Organotin compounds; TBT, DPhT and DBT were determined ac- cording to Tsuda. et al. [21] as follows; ten grams of se- diment was placed into 500 ml separating funnel, and extracted for 30 min with 50 ml ethyl acetate after adding 50 ml water and 5 ml HCl. The mixture was centrifuged at 2500 rpm for 5 min and 30 ml of organic layer were transferred to 50 ml round-bottom flask. The organic layer was evaporated nearly to dryness (0.1 ml) in vac- uum at 40oC. The residue was dissolved in 1 ml ethanol, 2 ml hydrogenation reagent (1 g of NaBH4 dissolved in 40 ml ethanol) was added with shaking, and let for standing for 10 min at room temperature. Five ml of wa- ter was added to the reaction mixture, shacked slightly, and transferred to 50 ml separating funnel. The flask was rinsed with 5 ml portions of water, and transferred to the funnel then extracted for 5 min with 5 ml hexane after adding of 5 g NaCl. Hexane was passed through silica gel column to elute butyltin hydrides. The first 20 ml was collected in round-bottom flask, evaporated to about 2 ml under reduced pressure at 40˚C. (The concentrate was transferred into 5 ml gradual test tube, rinsing flask with hexane, and the volume was adjusted to 1 ml under ni- trogen stream in 40˚C dry bath. The final extract was then injected into gas chromatograph/electron capture de- tector, GC/ECD (HP 5890 II). The chromatographic column was HP-5 capillary column (30 m × 0.32 mm × 0.25 µm); 5% diphenyl and 95% dimethyl polysiloxane, non-polar 60 to 325˚C) with N2 as carrier gas with flow rate of 2 ml/min. The injection port and detector line were at 300 and 310, respectively. The column was pro- grammed from 80˚C for 3 min to a final 310˚C for 8 min at a rate 5˚C /min. Organolead compounds (tri-alkyllead and tetraal- kyllead) were determined according to Chau et al. [22] as follows; about 5 g of sediment samples was extracted in a capped glass vial with 3 ml benzene after addition of 10 ml H2O, 6 g NaCl, 1g potassium iodide, 2 g sodium benzoate, 3 ml of 0.5 mol/l sodium diethyldithiocar- bamate (NaDDTC) and 2 g coarse glass beads (20 - 40 mesh) with stirring for 2 h in mechanical Shaker. After centrifugation of the mixture, a measured aliquot (1 ml) of benzene was taken for butylation. Derivatization was carried out by adding 0.5 ml butyl Grignard reagent (bu- tyl magnesium chloride; Sigma Aldrich, USA) to the sample. The mixture was gently shacked for 10 min, and washed with 5 ml of 0.5 M sulfuric acid to destroy the excess of Grignard reagent. About 2 - 3 ml of the organic phase was pipetted into a small vial and dried with anhy- drous sodium sulfate. Appropriate amounts (3 - 5 µl) were injected into gas chromatograph/flame ionization detector (GC/FID). The sample extract was introduced directly to the chromatographic column by micro-syringe. The chromatographic column was HP-5 capillary column (30 m × 0.32 mm × 0.25 µm); 5% diphenyl and 95% dimethyl polysiloxane, non-polar (60 to 325˚C) with N2 as carrier gas with flow rate of 2 ml/min. The injection port and detector line were at 150 and 200˚C, respec- tively. The column was programmed from 60˚C to 200˚C at a rate 8˚C/min. 2.3. Method Validation and Quality Control Studies Method validation and quality control samples were done using standard solutions and applying the computerized 4.3 quality system provided by DANIDA from VKI. Two natural samples were analyzed in duplicate in each of six batches of samples after spiking by a known con- centration of the standard solution. The same two natural samples were analyzed without spiking. The highest and lowest percentages of recovery for spiked samples were used to determine the accuracy which ranged between 90 and 105%. 3. Results 3.1. Grain Size A thorough sight on data of Table 1, indicated that sandy sediments are dominant at most of the area of investiga- tion. The mean size of sediments ranges from 2.03Ø at station II (El Zaitia Harbour) to 0.19Ø at station VII (Ras Gharib), i.e. from fine to course sand. However, sorting Copyright © 2011 SciRes. JEP  Distribution of Different Organotin and Organolead Compounds in Sediment of Suez Gulf 548 values vary from 0.65 to 1.47 (i.e. from moderately well sorted to poorly sorted) reflected unstable condition in the Suez Gulf. Folk (18) stated that the most the skew- ness value departs from zero, the greatest the degree of asymmetry. About 70 % of the samples of investigation are positively skewed (i.e. finely skewed), this clearly in- dicates the asymmetry of sediments in the Suez Gulf. The same is true for Kurtosis values ranging from 0.45 at sta- tion III (El Kabanon) to 1.11 at station V (Adabiya Port). 3.2. Water Percent and Porosity Percent Water percent is an important factor in controlling the early digenetic processes of sediments. It affects the rate of reactions particularly, the Redox processes, pH and the amount of organotin compounds that may be trapped due to their hydrophobic characteristics. Water percent reflects the ability of sediments to hold water molecules between their particles, which are mainly a function of particle size and mineral composition [23]. Water percent of the Suez Gulf sediments is ranged between 13.55% and 54.54%. The maximum absolute value of 54.54% was observed at station II; while the minimum absolute value 13.55% was observed at station VIII, this reflects the effect of the nature of coarse sandy sediment at this station. The porosity ranged from 6.11% at station VII to 37.79 % at station I (Table 2). 3.3. Total Organic Carbon (TOC) Organic carbon contents ranged from 0.01% to 2.95% with an average value of 0.67% (Table 2). The maxi- mum values were observed at stations I and II, and this may be due to the influence of industrial wastewater pro- duced by discharging about 93 tones of heavy petroleum fractions annually into the bay from two large refineries (Suez petroleum and El Nasr petroleum companies [24]. Moreover, El-Zeitia Harbor station (II) considered one of the heaviest loading and unloading operations of oil tan- kers in the world [25]. On the other hand, it pol- luted by the discharge of both agriculture and domestic wastes from cities distributed along the Suez Canal. (A good correlation between TOC and water contents in sediment of the Suez Gulf was observed r = 0.82 (p = 0.05). The minimum absolute value of 0.01% was ob- served at station VI revealed that this station is not sub- jected to the influence of industrial or domestic dis- charge. Table 1. Grain size analysis of sediment samples collected from Suez Gulf during 2005. St. No. Gravel % Sand % Pan % Ø Sk Ku Type of Sand Sorting I 0 100 0 2.02 0.07 0.77 Fine sand 0.67 (Moderately well sorted) II 0 100 0 2.03 0.13 0.85 Fine sand 0.72 (Moderately sorted) III 48.86 50.9 0.24 0.32 0.53 0.45 Coarse sand 0.97 (Moderately sorted) IV 19.08 76.45 4.45 0.32 0.53 0.45 Coarse sand 0.97 (Moderately sorted) V 15.57 80.24 4.19 1.83 –0.18 1.11 Medium sand 1.47 (Poorly sorted) VI 0 100 0 2.02 0.42 0.99 Fine sand 0.87 (Moderately sorted) VII 61.06 38.87 0.07 0.19 0.61 Coarse sand 0.94 (Moderately sorted) VIII 27.01 72.9 0.09 0.82 –0.3 0.74 Coarse sand 1.01 (Poorly sorted) IX 0.72 97.62 0.66 0.97 0.13 0.75 Coarse sand 0.65 (Moderately well sorted) X 3.66 95.63 0.71 1.98 0.06 0.9 Medium sand 0.76 (Moderately sorted) W: water percent, P: porosity, TOC: total organic carbon, TC: total carbonate, Si: silicon content, * cited from Shreadah et al. [42]. Table 2. Physico-chemical parameters of the sediment samples collected from Suez Gulf during 2005. I 43.06 37.79 1.65 50 12 II 54.54 26.92 2.95 - - III 37.88 22.53 0.35 54 13.2 IV 31.12 17.26 0.35 42 22.5 V 38.76 23.25 0.80 60 9.9 VI 14.21 6.460 0.01 66 11.7 VII 17.98 8.580 0.10 28 31.8 VIII 13.55 6.110 0.30 22 26.7 IX 21.03 10.41 0.05 42 19.4 X 33.84 19.32 0.20 21 10.6 W: water percent, P: porosity, TOC: total organic carbon, TC: total carbonate, Si: silicon content, * cited from Shreadah et al. [42]. C opyright © 2011 SciRes. JEP 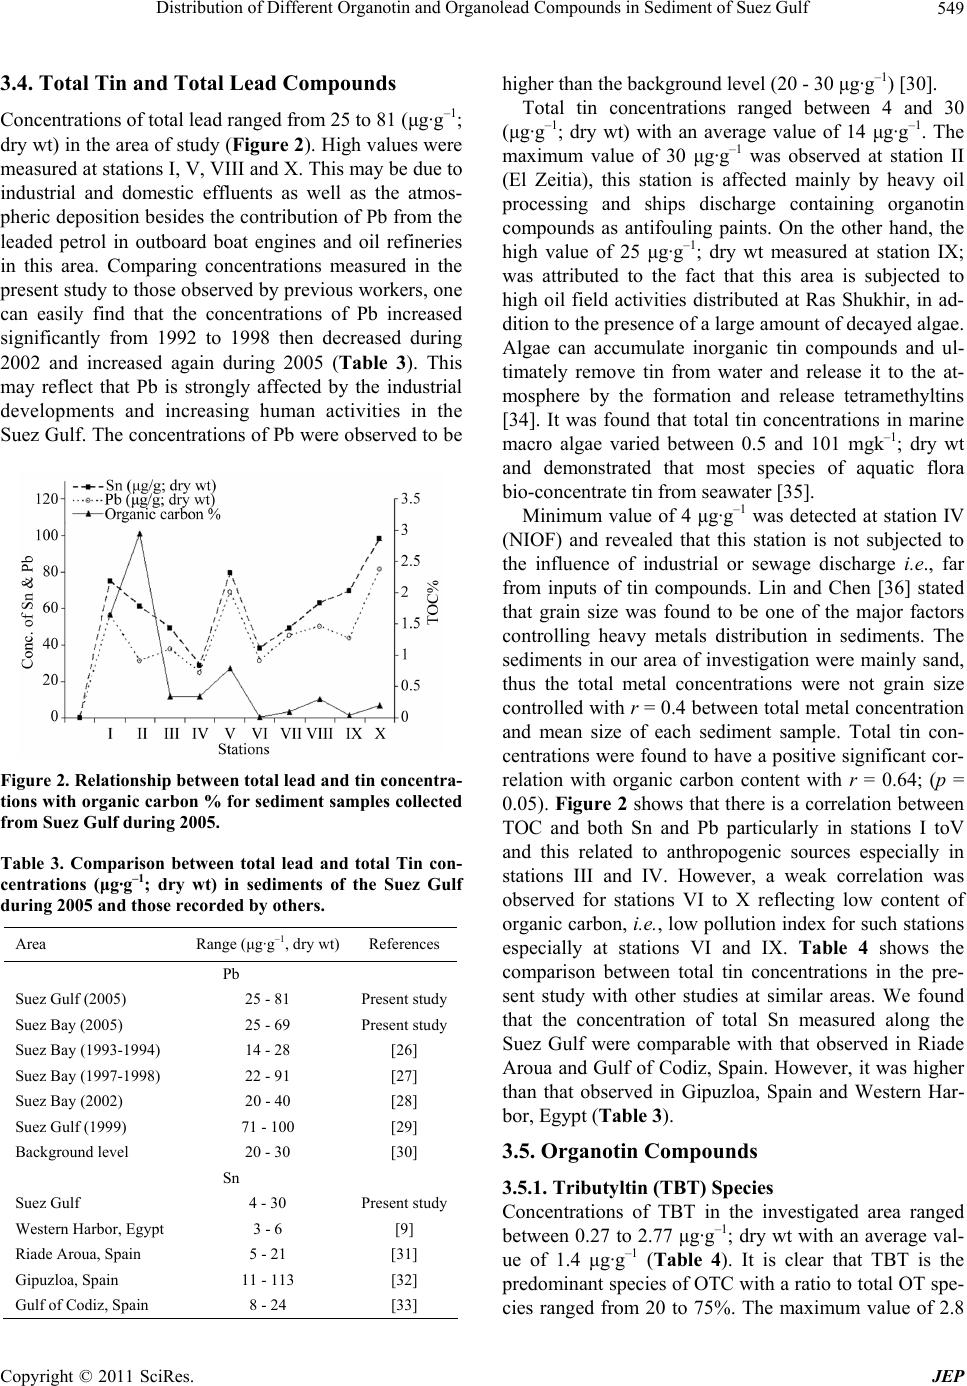 Distribution of Different Organotin and Organolead Compounds in Sediment of Suez Gulf549 3.4. Total Tin and Total Lead Compounds Concentrations of total lead ranged from 25 to 81 (μg·g–1; dry wt) in the area of study (Figure 2). High values were measured at stations I, V, VIII and X. This may be due to industrial and domestic effluents as well as the atmos- pheric deposition besides the contribution of Pb from the leaded petrol in outboard boat engines and oil refineries in this area. Comparing concentrations measured in the present study to those observed by previous workers, one can easily find that the concentrations of Pb increased significantly from 1992 to 1998 then decreased during 2002 and increased again during 2005 (Table 3). This may reflect that Pb is strongly affected by the industrial developments and increasing human activities in the Suez Gulf. The concentrations of Pb were observed to be Figure 2. Relationship between total lead and tin concentra- tions with organic carbon % for sediment samples collected from Suez Gulf during 2005. Table 3. Comparison between total lead and total Tin con- centrations (μg·g–1; dry wt) in sediments of the Suez Gulf during 2005 and those recorded by others. Area Range (μg·g–1, dry wt) References Pb Suez Gulf (2005) 25 - 81 Present study Suez Bay (2005) 25 - 69 Present study Suez Bay (1993-1994) 14 - 28 [26] Suez Bay (1997-1998) 22 - 91 [27] Suez Bay (2002) 20 - 40 [28] Suez Gulf (1999) 71 - 100 [29] Background level 20 - 30 [30] Sn Suez Gulf 4 - 30 Present study Western Harbor, Egypt 3 - 6 [9] Riade Aroua, Spain 5 - 21 [31] Gipuzloa, Spain 11 - 113 [32] Gulf of Codiz, Spain 8 - 24 [33] higher than the background level (20 - 30 μg·g–1) [30]. Total tin concentrations ranged between 4 and 30 (μg·g–1; dry wt) with an average value of 14 μg·g–1. The maximum value of 30 μg·g–1 was observed at station II (El Zeitia), this station is affected mainly by heavy oil processing and ships discharge containing organotin compounds as antifouling paints. On the other hand, the high value of 25 μg·g–1; dry wt measured at station IX; was attributed to the fact that this area is subjected to high oil field activities distributed at Ras Shukhir, in ad- dition to the presence of a large amount of decayed algae. Algae can accumulate inorganic tin compounds and ul- timately remove tin from water and release it to the at- mosphere by the formation and release tetramethyltins [34]. It was found that total tin concentrations in marine macro algae varied between 0.5 and 101 mgk–1; dry wt and demonstrated that most species of aquatic flora bio-concentrate tin from seawater [35]. Minimum value of 4 μg·g–1 was detected at station IV (NIOF) and revealed that this station is not subjected to the influence of industrial or sewage discharge i.e., far from inputs of tin compounds. Lin and Chen [36] stated that grain size was found to be one of the major factors controlling heavy metals distribution in sediments. The sediments in our area of investigation were mainly sand, thus the total metal concentrations were not grain size controlled with r = 0.4 between total metal concentration and mean size of each sediment sample. Total tin con- centrations were found to have a positive significant cor- relation with organic carbon content with r = 0.64; (p = 0.05). Figure 2 shows that there is a correlation between TOC and both Sn and Pb particularly in stations I toV and this related to anthropogenic sources especially in stations III and IV. However, a weak correlation was observed for stations VI to X reflecting low content of organic carbon, i.e. , low pollution index for such stations especially at stations VI and IX. Table 4 shows the comparison between total tin concentrations in the pre- sent study with other studies at similar areas. We found that the concentration of total Sn measured along the Suez Gulf were comparable with that observed in Riade Aroua and Gulf of Codiz, Spain. However, it was higher than that observed in Gipuzloa, Spain and Western Har- bor, Egypt (Table 3). 3.5. Organotin Compounds 3.5.1. Tributyltin (TBT) Species Concentrations of TBT in the investigated area ranged between 0.27 to 2.77 μg·g–1; dry wt with an average val- ue of 1.4 μg·g–1 (Table 4). It is clear that TBT is the predominant species of OTC with a ratio to total OT spe- cies ranged from 20 to 75%. The maximum value of 2.8 Copyright © 2011 SciRes. JEP  Distribution of Different Organotin and Organolead Compounds in Sediment of Suez Gulf 550 Table 4. Concentrations of organotin species (μg·g–1; dry wt) and organolead species (ng·g–1; dry wt) in sediment samples collected from the Suez Gulf during 2005. St. TBT DBT DPhT TOT Et4Pb Me4Pb Et3Pb Me3Pb TOL I 0.51 ± 0.02 0.19 ± 0.021.32 ± 0.03 2.0213.58 ± 0.2219.30 ± 0.41 126.59 ± 0.51 13.59 ± 0.36 173.06 II 2.77 ± 0.25 2.27 ± 0.122.09 ± 0.04 7.134.88 ± 0.11 15.09 ± 0.14 22.44 ± 0.71 10.78 ± 0.59 53.19 III 0.27 ± 0.03 0.08 ± 0.010.98 ± 0.03 1.3471.27 ± 0.2734.06 ± 0.10 3.59 ± 0.05 20.70 ± 0.55 129.62 IV 0.81 ± 0.09 0.07 ± 0.010.89 ± 0.05 1.7774.48 ± 1.23210.74 ± 1.87 4.57 ± 0.27 150.73 ± 0.65 440.52 V 2.19 ± 0.13 1.32 ± 0.031.44 ± 0.05 4.9535.60 ± 0.50203.38 ± 0.58 25.42 ± 0.86 162.49 ± 0.37 426.89 VI 1.50 ± 0.10 0.48 ± 0.03<DL 1.98<DL 47.13 ± 0.61 <DL 35.13 ± 0.41 82.26 VII 0.35 ± 0.04 0.11 ± 0.010.82 ± 0.03 1.280.59 ± 0.03 2.27 ± 0.14 3.18 ± 0.20 4.84 ± 0.16 10.88 VIII 1.11 ± 0.18 0.22 ± 0.010.99 ± 0.02 2.334.04 ± 0.05 63.96 ± 0.75 1.23 ± 0.08 61.16 ± 0.27 130.38 IX 1.87 ± 0.18 0.42 ± 0.021.13 ± 0.05 3.4242.31 ± 0.1223.90 ± 0.78 8.38 ± 0.33 13.44 ± 0.49 88.02 X 2.31 ± 0.20 0.60 ± 0.051.33 ± 0.05 4.253.37 ± 0.25 13.97 ± 0.23 121.49 ± 0.65 12.94 ± 0.31 151.77 Av. 1.37 0.58 1.1 3.0525.01 63.38 31.69 48.58 168.66 <DL: below the detection limit, Av. = average value for triplicate analyses, TOT = Sum (TBT+ DBT+DPhT), TOL = Sum (Et4Pb + Me4Pb + Et3Pb+ Me3Pb). μg·g–1 was observed at station (II); Zeitia Harbor which has high contents of total organic carbon with 2.95%. It has been reported that the organic carbon content of se- diments affects the bioavailability and toxicity of TBT i.e. sediments with high concentration of organic matter may act as sink for TBT [37,38]. In addition it situated near the shipyard dry dock in which TBT compounds are used in painting the hulls of new vessels and on older vessels during dry docking. The average TBT content in marine paints was about 4%, and approximately 1200 tons of TBT was applied annually to ships hulls [39]. On the meantime, high concentrations of TBT were also found at stations V, VI, IX and X where, station V (El Adabiya port) is affected by loading and unloading activities. In addition to the wastes of some industries such as vegeta- ble oil factories and chemical industries near this station and wastes discharged from Attaqa power station, at which TBT compounds are used as a biocide for cooling waters. Station VI (El Sukhna) is considered as transit area of ships passing through the Suez Canal. It was re- ported that, during 3-days stay inside a harbor, a com- mercial ship, leaching TBT at the constant leach rate, can release more than 200 g TBT into water [40]. However, if freshly painted, this amount can reach 600 g, which can result in a dissolved TBT contamination of the sur- rounded water ranging between 100 and 200 or about 600 ng·Snl–1, respectively. Station IX (Ras Shukier) is a large center for collection and shipment of oil from sev- eral oil fields including off shore wells. The high value of TBT observed at station (X); El Tour was attributed to the high intensity of fishing boats activities which use TBT in antifouling paints. on the other hand, the rela- tively low concentration of 0.27 μg·g–1 dry wt found at station III+ is mainly due to the coarse sand nature of sediment. A good significant correlation was observed between TBT and mean size (Ø) with r = 0.67 (p = 0.05). Therefore, TBT accumulated in sediments of the Suez Gulf was affected by grain size. It has been reported that The Australian sediment quality guidelines for TBT are 5 ng·g–1 and 70 ng·g–1 for low and high threshold values [41]. The concentrations of TBT in sediment samples from 10 stations along the Suez Gulf were found to be higher than the highest thre- shold value, suggesting these sediments may pose a threat to a benthic biota. Moreover, high levels of TBT in Suez Gulf sediments reflects its widespread contamina- tion and could be an indicative of the continuing usage of TBT- based antifouling paints on ship hulls. Shereadah et al. [42] investigated the mineralogical composition of surficial sediments along the Egyptian Red sea coast during 2006. They indicated that in Suez Gulf, the average value of total carbonate (TC %) = 42% while the average value of Si% = 19.4 (Table 2). This indicated that the composition of sediment in our area of investigation is mainly carbonate meaning that sediments are weak adsorbents and prone to digenesis and redisso- lution. However, the relatively high concentrations of TBT recorded in sediments of the Suez Gulf result from renewal source of contamination by such compounds rather that adsorption to sediment. Dowson et al. [37] have introduced a classification for TBT concentrations in sediments, characterizing concen- trations below 3ngg-1 as uncontaminated, 3 - 20 ng·g–1 as light contaminated, 20 - 100 ng·g–1 as moderately con- taminated, 100 - 500 as highly contaminated and above 500 ng·g–1 as grossly contaminated. Following this scheme, C opyright © 2011 SciRes. JEP  Distribution of Different Organotin and Organolead Compounds in Sediment of Suez Gulf551 the sampled surface sediments in the Suez Gulf are con- sidered as highly to grossly contaminate. 3.5.2. Dibutyltin (DBT) Species Dibutyltin concentrations varied from 0.07 to 2.27 μg·g–1; dry wt with an average concentration of 0.58 μg·g–1; dry wt. (Table 4). A significant correlation with r = 0.82 (p = 0.05) was found between the concentration of TBT and DBT reflecting the degradation of TBT as a main source of DBT in the Suez Gulf. The maximum value of DBT was observed at station (II) due to 1) the direct emission or the degradation of TBT to DBT at surface water as mentioned by [43-49] and microbial degradation of TBT to DBT and MBT in oxic and anoxic sediments [50], 2) high value of organic carbon content 2.95 % in sediments. The minimum absolute value of DBT 0.07 μg·g-1;dry wt at stations (III and IV) may be attributed to the type of sediment (coarse sand).In general, the concentration of TBT was greater than DBT in sediments of the Suez Gulf and the TBT/DBT ratio showed large variation from 1.22 to 11.20. High TBT/DBT ratio may be attributed to re- cent input of TBT and/or to low degradation of TBT to DBT into these stations. It is known that TBT degrada- tion rates in sediment are slower than in water column, particularly in anaerobic conditions. The half life of TBT in sediments is in the range of years rather than days or weeks in the water column [51]. Although abiotic degra- dation occurs, the process remains less important than biological action [52]. Microbial degradation of TBT to DBT and MBT takes days to weeks in water, years in oxic sediments and more than that in anoxic sediments [50]. The degradation products have generally been as- sumed to be less toxic than TBT because they are less lipophilic. Furthermore, bacterial communities degrading TBT might be dependent on salinity and other environ- mental factors [53]. 3.5.3. Diphenyltin (DPhT) species A thorough sight on data of Table 5 indicated that di- phenyltin (DPhT) species showed relatively high con- centrations at the stations along the Suez Gulf. This may be due to the influence of sewage and industrial (refiner- ies and textile companies) discharge. DPhT concentra- tions in the Suez Gulf were < 2.09 μg·g–1; dry wt with an average concentration of 1.09 μg·g–1dry wt. The maxi- mum absolute value of DPhT 2.09 μg·g–1; dry wt ob- served at station (II), is due to the use of triphenyltin as antifouling agents in ship paints and discharged of the agricultural wastewater from the Suez Canal. According to Odoyemi et al. [54] high concentrations of butyltin and phenyltin derivatives are possibly due to using them in agricultural and industrial activities or high sorption affinity onto soils. However, the occurrence of butyltin and phenyltin derivatives in an aquatic environment could be a result of sewage sludge and high degradation of triphenyltin to phenyltin derivatives (mono and di phenyltin) [55]. Previous studies revealed that TBT is toxic to aquatic biota at concentrations of >2 ng·l−1 [56]. Regarding to the production, usage, accumulation, and toxicity of or- ganotin compounds. Based on the results obtained from the present study, we can conclude that the prohibition of using organotin in antifouling paints is an effective ac- tion for both the protection and conservation of marine life. Furthermore, detecting the average concentration values 1.37, 0.58 and 1.10 (μg·g–1) for TBT, DBT, and DPhT, respectively in our investigated areas proves a real need for enforcing the existing regulations. 3.6. Organolead Compounds (OLC) Table 4 shows the concentrations of four OLC species in sediment samples, collected from the Suez Gulf. The concentrations ranged from not detected - 74.48, 2.270 - 210.7, not detected -126.6 and 4.840 - 162.5 ng·g–1; dry wt, for Et4Pb, Me4Pb, Et3Pb+ and Me3Pb+, respectively. However, the concentration of total OLC ranged from 10.88 - 440.2 ng·g–1; dry wt. The results of OLC species indicated the significant setting of OLC into sediments. It has been reported that Et4Pb species is expected to be Table 5. The correlation matrix for different organic pollutants recorded in different stations of the investigated area during 2005. Parameter TBT DBT DPhT Et4Pb Me4Pb Et3Pb Me3Pb TBT 1.00 DBT 0.82 1.00 DPhT 0.50 0.68 1.00 Et4Pb –0.31 –0.28 –0.02 1.00 Me4Pb 0.05 0.03 –0.04 0.55 1.00 Et3Pb 0.13 0.01 0.36 –0.29 –0.26 1.00 Me3Pb 0.07 0.05 –0.03 0.48 0.99 –0.26 1.00 Copyright © 2011 SciRes. JEP  Distribution of Different Organotin and Organolead Compounds in Sediment of Suez Gulf 552 absorbed onto suspended solids and sediments in water column [57]. Table 4 shows relatively high concentra- tions of tetraalkyllead in sediments of the Suez Gulf. This is attributed to the presence of renew sources and the high density of these compounds to sink and spread along the stream bottom. On the other word, the concen- tration of Me4Pb is higher than Et4Pb, this reflecting the biomethylation of inorganic lead or organolead cations to tetramethyllead [58]. In addition, Et4Pb is more sensitive to photochemical process than Me4Pb [59], which lead to higher decomposition of Et4Pb in water column. Trie- thyllead species show a positive correlation with mean size (Ø) with r= 0.57(p = 0.05). Maximum concentrations of 440.2 and 426.89 ng/g; dry wt of OLC were recorded at stations IV and V, re- spectively. These stations are located near busy roads of the Suez city at which antiknock organolead compounds are emitted from incomplete fuels combustion through cars exhaust. Besides, spilling and direct evaporation are possible sources of OLC pollution. In addition, water circulation could affect the transport mechanism of OLC, where there is a persistent anti-clock wise circulation in the Bay causing more pollution in the western side. In- significant correlation was calculated between total Pb (μg·g–1 dry wt) and total OLC (ng·g–1; dry wt) with r = 0.13 (p = 0.05) in sediment samples, reflecting the influ- ence of different sources of lead pollution on these sta- tions. Table 5 shows that a significant correlation is re- corded between TBT and DBT, DBT and DPhT, Me4Pb and Me3Pb with r = 0.82, 0.68 and 0.99 respectively. REFERENCES [1] H. Siegl and A. Sigel, “Biological Properties of Metal Alkyl Derivatives,” Dekker, New York, 1993. [2] K. Fent, “Ecotoxicology of Organotin Compounds,” Re- vised Marine Toxicology, Vol. 26, 1996, pp. 117-121. [3] G. W. Bryan and P. E. Gibbs, “Impacts of Low Concen- trations of Tributyltin (TBT) on Marine Organisms,” In: M. C. Newman and A. W. McIntosh, Eds., Metal toxi- cology, Concepts and applications, Academic Press, Lon- don, 1991. [4] M. H. Salazar and S. M. Salazar, “Assessing Site-Specific Effects of TBT Contamination with Mussel Growth Rates,” Marine Environment Research, Vol. 32, No. 1-4, 1991, pp. 131-150. doi:10.1016/0141-1136(91)90038-A [5] C. Alzieu, J. Sanjuan, J. P. Deltreil and B. Borel, “Tin Applied,” Organometallic Chemistry, Vol. 17, 1986, pp. 81-105. [6] T. Horiguchi, H. Shiraishi, M. Shimizu and M. Morita, “Imposex and Organotin Compounds in Thais Clavigera and T. Bronni in Japan,” Journal of Marine Biolology, Vol. 74, 1994, pp. 651-669. doi:10.1017/S002531540004772X [7] A. Siah, J. Pellerin, J. C. Amiard, E. Pelletier and L. Vig- lino, “Delayed Gamesomeness and Progesterone Levels in Soft-Shell Clams (Mya Arenaria) in Relation to in Situ Contamination to Organotins and heAvy Metals in the St. Lawrence River,” Comparative Biochemistry and Physi- ology Part C: Toxicol. Pharm., Canada, 2003. [8] J. L. Gomez-Ariza, M. M. Santos, E. Morales, I. Giraldez, D. Sanchez-Rodas and N. Vieira, “Organotin Contamina- tion in the Atlantic Ocean off the Iberian Peninsula in Relation to Shipping,” Chemosphere, Vol. 64, No. 7, 2006, pp. 1100-1108. doi:10.1016/j.chemosphere.2005.11.068 [9] M. A. Shreadah, T. O. Said, A. M. Younis and R. S. Fa- rag, “Speciation of Organotin Compounds in Sediments of Semi-Closed Areas along the Mediterranean Coast of Alexandria,” Chemistry and Ecology, Vol. 22, No. 5, 2006, pp. 395-404. doi:10.1080/02757540600917443 [10] C. Gallert and J. Winter, “Bioremediation of Soil Con- taminated with Alkyllead Compounds,” Water Research, Vol. 36, No. 12, 2002, pp. 3130-3140. doi:10.1016/S0043-1354(01)00543-7 [11] Y. K. Chau, P. T. S. Wong, G. A. Bengert, J. L Dunn and B. Glen, “Occurrence of Alkyllead Compounds in the Detroit and St Clair Rivers,” Journal of Lakes Research, Vol. 11, No. 4, 1985, pp. 13-19. [12] T. S. Murty and M. T. El-Sabh, “Weather System, Storm Surges and Sea State in the Red Sea and the Gulf of Aden,” Proceeding Symposium on Coral Reef Environ- ment, Red Sea, Jeddah, KSA, 1984. [13] T. O. Said, “Analytical Determination of Dissolved Pe- troleum Components in Seawater Using Coupling System (GC-MS),” Ph.D. Thesis, Mansoura University, Egypt, 1996. [14] A., Khaled, A. El-Nemer and A. El-Sikaily, “Contamina- tion of Coral Reefs by Heavy Metals along the Egyptian Red Sea Coast,” Bulletin Environmental Contamination and Toxicology, Vol. 71, No. 3, 2003, pp. 577-584. doi:10.1007/s00128-003-8751-y [15] A. El Sikaily, A. Khaled, A. El-Nemer, T. O. Said and A. M. A. Abdullah, “Polycyclic Aromatic Hydrocarbons and Aliphatics in the Coral Reef Skeleton of the Egyptian Red Sea Coast,” Bulletin Environmental Contamination and Toxicology, Vol. 71, No. 6, 2003, pp. 1252-1259. doi:10.1007/s00128-003-8736-x [16] A. El Sikaily, A. Khaled and A. El-Nemer, “Heavy Met- als Monitoring Using Bivalves from Mediterranean Sea and Red Sea,” Environmental Monitoring Assessment, Vol. 98, No. 1-3, 2004, pp. 41-58. doi:10.1023/B:EMAS.0000038178.98985.5d [17] APHA-AWWA-WEF, “Standard Methods for the Ex- amination of Water and Wastewater,” 18th Edition, Washington DC, 1992. [18] R. L. Folk, “Petrology of Sedimentary Rocks,” Hemphill, Austin, 1974. [19] P. D. Jackson, D. Taylor Smith and P. N. Stanford, “Re- sistively-Porosity-Particle Shape-Relationships for Ma- C opyright © 2011 SciRes. JEP  Distribution of Different Organotin and Organolead Compounds in Sediment of Suez Gulf553 rine Sands,” Geophysics, Vol. 43, No. 6, 1978, pp. 1250-1268. doi:10.1190/1.1440891 [20] UNEP/IAEA, “Reference Methods for Marine Pollution Studies,” Athens, 1986. [21] T. Tsuda, H. Nakanishi, S. Aoki and J. Takebayashi, “Determination of Butyltin Compounds in Biological and Sediment Samples by Electron-Capture Gas Chromatog- raphy,” Journal of Chromatography, Vol. 387, 1987, pp. 361-370. doi:10.1016/S0021-9673(01)94538-8 [22] Y. K. Chau, P. T. S. Wong, G. A. Bengert and J. L. Dunn, “Determination of Dialkyllead, Trialkyllead, Tetraal- kyllead and Lead (II) Compounds in Sediment and Bio- logical Samples,” Analytical Chemistry, Vol. 56, No. 2, 1984, pp. 271-274. doi:10.1021/ac00266a034 [23] M. Meherm, “Assessment of the State of Pollution by Antifouling Paints in Marine Environment of Alexandria Coastal Region,” Ph.D. Thesis in Maritime Transport Technology (Environmental Protection), Arab Academy for Science and Technology and Maritime Transport, 2002. [24] T. O. Said and M. A. Hamed, “Mobility of Polycyclic Aromatic Hydrocarbons in Water of the Egyptian Red Sea Coasts,” Bulletin Environmental Contamination and Toxicology, Vol. 77, No. 5, 2006, pp. 126-136. doi:10.1007/s00128-006-1041-8 [25] T. O. Said, “Oil Pollution Inputs into the Suez Gulf, Red Sea,” Egyptian Journal of Academic Society Environ- mental Development (D-Environmental Studies), Vol. 4, 2003, pp. 19-32. [26] Kh. M. El Moselhy and M. N. Gabal, “Trace Metals in Water, Sediments and Marine Organisms from the North- ern Part of the Suez Gulf, Red Sea,” Journal of Marine System, Vol. 46, 2004, pp. 39-46. doi:10.1016/j.jmarsys.2003.11.014 [27] Kh. M. El Moselhy, A. A. Diab and M. R. Tolba, L. I. Mohamadein, “Levels of Some Heavy Metals in Coastal Water, Sediment and the Limpet Patella sp. from the Northern Part of the Suez Gulf (Suez Bay),” Egyptian Journal of Aquatic Research, Vol. 3, 1999, pp. 69-84. [28] Kh. M. El Moselhy and H. Abd El-Azim, “Heavy Metals Content and Grain Size of Sediments from Suez Bay, Red Sea,” Egyptian Journal of Aquatic Research, Vol. 31, No. 2, 2005, pp. 224-238. [29] A. El Sikaily, A. Khaled and A. El Nemr, “Leachable and Total Nine Heavy Metals in Muddy and Sandy Sediment Collected from Suez Gulf. Egypt,” Journal of Aqua-tic Research, Vol. 31, 2005, pp. 99-119. [30] G. Bryan and W. J. Langston, “Bioavailability, Accumu- lation and Effects of Heavy Metals in Sediments with Special Reference to United Kingdom Estuaries: A Re- view,” Environmental Pollution, Vol. 76, 1992, pp. 89-132. doi:10.1016/0269-7491(92)90099-V [31] M. C. Barciela-Alonsa, P. Pazos-Capeans, M. E. Regue- ria-Miguens, A. Bermejo-Barrera and P. Bermejo-Barrera, “Study of Cadmium, Lead and Tin Distribution in Surface Marine Sediment Samples from Ria de Aroua (NW of Spain),” Analytical Chemical Acta, Vol. 524, No. 1-2, 2004, pp. 115-120. doi:10.1016/j.aca.2004.03.087 [32] I. Arambarri, R. Garcia and E. Millan, “Assessment of Tin and Butyltin Species in Estuarine Superficial Sedi- ment from Gipuzkoa, Spain,” Chemosphere, Vol. 51, No. 8, 2003, pp. 643-649. doi:10.1016/S0045-6535(03)00154-1 [33] T. A. Delvallas, T. M. Forja and A. Gomez-Parra, “Sea- sonality of Contamination, Toxicity and Quality Values in Sediments from Littoral Ecosystems in the Gulf of Co- diz (SW Spain),” Chemosphere, Vol. 46, No. 7, 2002, pp.1033-1043. doi:10.1016/S0045-6535(01)00176-X [34] O. F. X. Donard, P. Quevauviller and A. Bruchet, “Tin and Organotin Speciation during Wastewater and Sludge Treatment Processes,” Water Research, Vol. 27, No. 6, 1993, pp. 1085-1089. doi:10.1016/0043-1354(93)90073-Q [35] R. Eisler, “Tin Hazards to Fish, Wildlife, and Inverte- brates: A Synoptic Review,” Laurel, MD, US Fish and Wildlife Service, Patuxent Wildlife Research Center, (PB-89-139620/XAB), US, 1989. [36] S. Lin and C. Chen, “Spatial Variations of Heavy Metals in the East China Sea Continental Shelf Surface Se- di-ments,” Chemistry and Ecology, Vol. 13, No. 2, 1996, pp. 77-91. doi:10.1080/02757549608035521 [37] P. H. Dowson, J. M. Bubband and J. N. Lester, “Tempo- ral Distribution of Organotins in the Aquatic Environment: Five Years after the 1989 UK Retail Ban on TBT Based Antifouling Paints,” Marine Pollution Bulletin, Vol. 26, 1993, pp.487-494. doi:10.1016/0025-326X(93)90465-V [38] J. P. Meador, C. A. Krone, D. W. Dyar and U. Varanasi, “Toxicity of Sediment Associated Tributyltin in Faunal Invertebrate’s Species Comparison and the Role of Or- ganic Carbon,” Marine Environmental Research, Vol. 43, No. 3, 1997, pp. 219-241. doi:10.1016/0141-1136(96)00090-6 [39] M. D. Ian, K. Susan and J. C. Melanie, “Tributyltin Inputs to the North Sea from Shipping Activities and Potential Risk of Biological Effects,” Journal of Marine Science, Vol. 55, No. 1, 1998, pp. 34-43. [40] G. E. Batley, “The Distribution and Fate of Tributyltin in the Marine Environment,” In: S. J. De Mora, Ed, Tribu- tyltin: A Case Study of an Environmental Contaminant, Cambridge Environmental Chemistry Series, Cambridge University Press, Cambridge, 1996. [41] ANZECC/ARMCANZ, “Australian and New Zealand Guidelines for Fresh and Marine Water Quality,” Austra- lian and New Zealand Environment and Conservation Council/Agriculture and Resource Management Council of Australian and New Zealand Canberra, 2000. [42] M. A. Shereadah, T.O. Said, G. El Zokm and M. S. Ma- soud, “Physico-Chemical Characteristics of the Surficial sediments along the Egyptian Red Sea coasts,” Egyptian Journal of Aquatic Research, Vol. 34, No. 2, 2008, pp. 83-95. [43] C.-C. Lee, C.-Y. Hsieh and C.-J. Tien, “Factors Influenc- ing Organotin Distribution in Different Marine Environ- mental Compartments and Their Potential Health Risk,” Copyright © 2011 SciRes. JEP  Distribution of Different Organotin and Organolead Compounds in Sediment of Suez Gulf Copyright © 2011 SciRes. JEP 554 Chemosphere, Vol. 65, No. 4, 2006, pp. 547-559. doi:10.1016/j.chemosphere.2006.02.037 [44] S. Diez, A. M. Balos and J. M. Bayona, “Organotin Con- tamination in Sediments from the Western Mediterranean Enclosures following 10 Years of TBT Regulation,” Wa- ter Research, Vol. 36, 2002, pp. 908-918. doi:10.1016/S0043-1354(01)00305-0 [45] S. Biselli, K. Bester, H. Huhnerfuss and K. Fent, “Con- centrations of the Antifouling Compound Irgarol 1051 and of Organotins in Water and Sediments of German North and Baltic Sea Marinas,” Marine Pollution Bulletin, Vol. 40, No. 3, 2000, pp. 233-243. doi:10.1016/S0025-326X(99)00177-0 [46] M. M. C. Ko, G. C. Bradley, A. H. Neller and M. J. Broom, “Tributyltin Contamination of Marine Sediments of Hong Kong,” Marine Pollution Bulletin, Vol. 31, No. 4, 1995, pp. 249-253. doi:10.1016/0025-326X(95)00138-D [47] S. D. St-Jean, S. C. Courtenay, E. Pelletier and R. St-Louis, “Butyltin Concentrations in Sediments and Blue Mussels (Mytilus Edulis) of the Southern Gulf of St. Lawrence, Canada,” Marine Pollution Bulletin, Vol. 31, No. 4, 1995, pp. 249-253. doi:10.1080/09593332008616807 [48] A. Sudaryanto, S. Takahashi, H. Iwata, S. Tanabe and A. Ismail, “Contamination of Butyltin Compounds in Ma- laysian Marine Environment,” Environmental Pollution, Vol. 130, No. 3, 2004, pp. 347-358. doi:10.1016/j.envpol.2004.01.002 [49] L. Schebek and M. Andreae, “Methyl- and Butyl Com- pounds in Water and Sediments of the Rhine River,” En- vironmental Science Technology, Vol. 25, No. 5, 1991, pp. 871-878. doi:10.1021/es00017a007 [50] P. H. Dowson, J. M. Bubb, T. P Williams and J. N. Les- term, “Degradation of Tributyltin in Fresh Water and Es- tuarine Marine Sediments,” Water Science Technology, Vol. 28, 1993, pp.133-137. [51] F. Cima, P J. Craig and C, Harrington, “Organotin Com- pounds in the Environment, in Organometallic Com- pounds in the Environment,” John Willey and Sons, Chichester, 2003, pp. 101-149. [52] WHO (World Health Organization), “Tributyltin Com- pounds,” Environmental Health Criteria 116, Geneva, 1990. [53] W. E. Pereira, Y. L. Wade, F. D. Hostettler and F. Par- chaso, “Accumulation of Butyltins in Sediments and Liq- uid Tissues of the Asian clam, Potamocorbula Amurensis, Near Mare Island Naval Shipyard, San Francisco Bay,” Marine Pollution Bulletin, Vol. 38, No. 11, 1999, pp. 1005-1010. doi:10.1016/S0025-326X(99)00124-1 [54] O. Odoyemi and E. Ajulo, “Stability of Brestan in Tropi- cal Waters,” Water Science Technology, Vol. 14, No. 4-5, 1982, pp. 133-142. [55] D. Muller, “Comprehensive Trace Level Determination of Organotin Compounds in Environmental Samples Using HRGC with FPD,” Analytical Chemistry, Vol. 59, No. 4, 1987, pp. 617-623. doi:10.1021/ac00131a017 [56] US EPA (United States Environmental Protection Agen- cy), “Chesapeake Bay Program: Findings and Recom- mendations. US EPA Report,” Region 3, Philadelphia, 1983. [57] W. J. Lyman “Handbook of Chemical Property Estima- tion Methods,” Washington DC, 1990. [58] U. Schmidt and F. Huber, “Methylation of Organolead and Lead (II) Compounds to (CH3)4Pb by Microorgan- isms,” Nature, Vol. 259, 1976, pp. 157-158. doi:10.1038/259157c0 [59] R. Van Cleuvenbergen, R. Chakraborti and F. Adams, “Occurrence of Triand Dialkyllead Species in Environ- mental Water,” Environmental Science Technology, Vol. 20, 1986, pp. 589-593. doi:10.1021/es00148a007
|