 Journal of Water Resource and Protection, 2015, 7, 860-870 Published Online July 2015 in SciRes. http://www.scirp.org/journal/jwarp http://dx.doi.org/10.4236/jwarp.2015.711070 How to cite this paper: Guissouma, W. and Tarhouni, J. (2015) Fluoride in Tunisian Drinking Tap Water. Journal of Water Resource and Protection, 7, 860-870. http://dx.doi.org/10.4236/jwarp.2015.711070 Fluoride in Tunisian Drinking Tap Water Wiem Guissouma*, Jamila Tarhouni Department of Rural Engineering, National School of Agronomy of Tunis, University of Carthage, Tunis , Tunisia Email: *wiem.guissouma@g mail.com, elmaainat@yahoo.fr Received 18 May 2015; accept ed 19 July 2015; published 22 July 2015 Copyright © 2015 by authors and Scientific Research Publishing Inc. This work is licensed under the Creative Commons Attribution International License (CC BY). http://creativecommons.org/licenses/by/4.0/ Abstract This paper presents a fluoride health risk characterization approach to identify the hyper-se nsi - tive population of adverse effect like tooth decay, dental fluorosis and skeletal fluorosis. In this context, a sampling campaign has been done over 100 Tunisian water consumption points (tap). Laboratory analysis results show that the quality of drinking water is affected by high fluoride concentration level exceeding 2 mg∙L−1. Over these samples, 7% of them present non-compliant with the Tunisian national standard (NT09.14) and the international guidelines (World Health Organization recommendations, WHO). The overtake cases are located essentially in southern Tu- nisian areas, i.e. Medenine, Gabes, Gafsa and Tataouine. One can highlight that groundwater, in these southern Tunisian areas, are naturally rich of fluoride. This is because of the aquifers geo- logical and fossil nature. However, commonly northern and central Tunisian areas are characte- rized by low fluoride concentration level below 0.1 mg∙L−1. These undertaken cases don’t meet the water quality requirement defined by WHO. Keywords Fluoride, Drinking Water, Health Risk Assessment, Adverse Effects, Hyper-Sensitive Population 1. Introduction The Tunisian Ministry of Health is devoted to controlling and monitoring the quality of drinking water su pplied by the Tunisian National Water Distribution Utility (SONEDE). A good bacteriological drinking waterquality has been translated by decreasing (from 5.8% in 1988 to 2.88% in 2006) diarrheal diseases. However, previous national authority’s work has not supported the drinking water chemical hazards, i.e. fluoride, for the health risks assessment. Many epidemiological studies of possible adverse effects of the long-term ingestion of fluoride via drinking-water have been carried out. These studies clearly estab lish that fluoride primarily produces effects on skeletal tissues (bones and teeth). Low concentrations provide protection against dental caries, especially in children. Moreover, Tunisian National Water Distribution Utility (SONEDE) has not adapted an efficient cor- *  W. Guissouma, J. Tarhouni rective action to meet the Tunisia dr inking water quality requir ements of fluoride. To prevent adverse effects re- lated to high daily intake level of fluoride, good water quality manage ment is crucial. This work presents a sam- pling campaign over 100 Tunisian water consumption points (tap) in order to assess the conformity of the Tuni- sian drinking water quality with respect to fluoride levels. Section 2 of this paper shows the sampling analysis results. Conformity assessment is presented in Section 3 by referring to the Tunisian national standard (NT09.14 2013) and the international guidelines [1]. Finally, Section 4 presents a risk characterization approach by adopt- ing a four-basic-step risk assessment process in order to identify the hyper-sensitive population of adverse effect like toot h de c ay, dental and skeletal fluorosis. 2. Materials and Methods 2.1. Sampling Process In this work, a sampling campaign has been done over 100 Tunisian water consumption points (tap). The sam- ples plan is defined by second degree survey with reasoned choice (mass of population served by networks wa- ter SONEDE). Laboratory analysis is used to quantitatively describe the fluoride levels in drinking tap water. 2.2. Conformity Assessment This overview aims to assess conformity of drinking water quality based on a comparative approach between laboratory analysis results and standards of drinking-water quality presented in Table 1. By referring the Tuni- sian nati ona l standa rd [2] and the international guidelin es [1] mentioned in Table 1. 2.3. Risk Assessment of Fluoride Content in Drinking Water in Tunisia As mentioned in the 2007 report edition of the French Institute for Public Health Surveillance [3], risk assess- ment process is typically structured in four basic steps: 1) Hazard identification , 2) Selection of toxicological reference values (TRV), 3) Exposure estimation, 4) Risk characterization. This section explains in detail this fo ur steps risk assessment. 2.3.1. Hazard Identification Excessive or deficient exposure to fluoride can have adverse effects on human health [4]: Tooth decay (caries) or enamel demineralization is caused by deficient exposure during tooth formation [5]. Dental fluorosis is caused by over fluoride exposure occurring during tooth mineralization, starting from third m ont h of in utero life (temporary teeth) ends at 12 years (permanent teeth) [6] [7]. Skeletal fluorosis can also lead In addition, long-term exposure to high fluoride levels [8] [9]. 2.3.2. Toxicity Reference Value (TRV) A toxicity reference value (TRV) presented in Table 2 is used to qualify or/and quantify a human health risk. Many toxicity reference values (TRV), specific to fluo ride, are used to assess fluoride risk; depending on expo- sure duration (acute, sub-chronic or chronic) and exposure route (oral, inhalation, etc.). The TRV used in this work are selected with resp ect to nation al and interna tional organizatio n s and institu tions like U S Environmental Protection Agency (US EPA), The Agency for Toxic Substances and Disease Registry (ATSDR), The French High Council for Public Health (FHCPH) and The French Agency for Food, Environmental and Occupational Health & Safety [10]. The TRV selected for adverse effects threshold by fluoride ingestion are summarized as follows: Table 1. Guideline for fluoride concentration in drinking water. NT 14.09 (2013) OMS (4éme éditi on , 2011) Directive Européenne 98/83/CE Recommandation Canadienne Normes Québécoise Nor me Américaine Fluorure mg/L 1.5 1.5 1.5 1.5 1.5 4  W. Guissouma, J. Tarhouni Levels fluoride higher than 0.5 mg∙L−1 is recomme nde d f or de ntal deca y pr e ve ntion [11], A daily fluoride intake of 122 mg ∙L−1 bw∙d−1, can occur dental fluorosis [12] [13], Fluoride intakes exceeding 200 mg∙L−1 bw∙d−1, may arise the skeletal fluorosis [12], A daily fluoride intake lower or equal to fluoride safety limit does not produce any harmful effect as estab- lished by CSHPF [14]. 2.3.3. Exposure Assessment The fluoride daily exposure in drinking water (Ew) is expressed by means of fluoride quantity in water in milli- grams (mg) over person body weight in kilograms (kg−1 b.w.) over exposure period in days (day−1). It is ex- pressed as: , where “Cf” is the fluoride concentration in drinking water (mg∙L−1), “C” is the daily water consumption (L∙d−1) and “Bw” is the average body weight (kg). The reference values used by the World Health Organization (W HO) for the daily water consumption and the corresponding average body weight are summarized in the Table 3. 2.3.4. Risk Character ization Risk characterization combines the information from the daily fluoride exposure by water and the adverse ef- fects on human health observed at higher exposure level than the TRV [15]. The most population exposed at risk is defined by comparing daily fluoride exposure levels in water for dif- ferent age groups (adult, child and infant). The comparative approach of the daily fluoride exposure level with the TRV, allows us to estimate some r isk indicators illuminating the health dimension of the situ ation inv estigated, such as the hazard quotient (QD). This is the ratio between the level of exposure and the toxicological reference value. Adverse effects may occur when the TRV exceeds the unitary value [3]. So, the calculation of this ratio is a tool for identifying areas affected by higher fluoride levels. 2.4. Comparison of Fluoride Daily Exposure and Safety Limit A comparative approach is adopted between the daily fluoride exposure and the safety limit established by the CSHPF in the aim to define the exceeding cases of safety limit in drinking water as it is presented in Figure 1. This appr oa c h is base d on: a) safety limit established by the CSHPF: 4 mg∙day−1 for adults, 0.7 mg∙day−1 for children and 0.4 mg∙day−1 for infants. Table 2. Toxicity reference values (TRV) used for fluoride adverse effects. Reference Work TRV Reference Value Population Adverse Effects Health Canada 1996 122 µg/kg bw/day 22 to 26 month Dental fluorosis US EPA (IRIS 2001) 1950 RfD 60 µg/kg bw/day children Dental fluorosis ATSDR 1994 MRL 60 µg/kg bw/day women non-vertebral fractures Health Canada LCPE 1993 200 µg/kg bw/day (12 mg/day) Adults Skeletal fluorosis dietary allowance 2001 Safety limit 0.4 to 4 mg/day Infants to adults WHO IPCS 2002 6 mg/day Adults Skeletal fluorosis Table 3. Daily water consumption and corresponding average body weight (adopted from [11]). Daily water consumption (L/day) Average body weight (kg b.w.) Infant 0.75 5 Children 1 10 Adults 2 60  W. Guissouma, J. Tarhouni Figure 1. Exceeding fluoride safety limit cases for infant (a), children (b) and adult (c).  W. Guissouma, J. Tarhouni b) water consumption defined by the WHO: 2 L∙day−1 for adults, 1 L∙day−1 for children and 0.75 L∙day−1 for infants. 3. Results and Discussion 3.1. Analysis Results Description In this subsection, analysis results will be explained. 3.1.1. Fluoride in the Drinking Tap Water and Related Geographical Variation Figure 2 shows that In Tunisia, fluoride levels in drinking tap water are highly changing from north area to south area. Laboratory analysis results shows that fluoride levels less than 0.1 mg∙L−1 are recorded in some northern areas; i.e. Beja and Jandouba but these levels are exceeding 2 mg∙L−1 in southern areas, i.e. Medenine, Gabes, Gafsa and Tataouine. In f act, drinking water supply in northern Tunisian areas is provided from surface water that has generally low contents of fluoride (less than 0.5 mg∙L−1). As drinking water supply, in southern Tunisia areas, is provided from groundwater, this can explain the high changing fluoride levels. Indeed, groundwater is naturally rich of fluoride by the fact that it is in contact with the rock aquifer and can react with it causing wa t e r e nri chme nt by flu oride [16]. 3.1.2. Intra-Regional Variation of Fluoride Levels in the Drinking Tap Water Figure 3 shows significant intra-regional variability in Gabes area, where fluoride levels fluctuate between minimum value of 0.29 mg∙L−1) in ElHamma and maximum value of 1.94 mg/L in Mareth. The various water supply systems can be the major cause of this intra-regional variability: from groundwater wells and water desa- lination plant [17]. Figure 2. Maximum fluoride level in drinking water in Tunis ia areas.  W. Guissouma, J. Tarhouni Figure 3. Intra-regional variability of fluoride level in tap water. 3.2. Conformity Assessment Results Over 7% of samples are non-compliantas it is shown in Table 4. Moreover, Figure 4 shows that the southern areas, i.e. Medenine, Gabes, Gafsa and Tataouine are considered to be the most areas affected by exceeding flu- oride standards in drinking water. 3.3. Risk Assessment Results 3.3.1. Identification of the Sensitive Population Fluoride exposure levels in different Tunisian areas and for different age groups (adult, child and infant) are calculated by using the WHO reference values for the average body weight and daily water consumption men- tioned in Table 3. Figure 5 shows a clear difference between the calculated daily exposure to fluoride in drink- ing water (Ew) for three different age groups; i.e., adult, child and infant. Figure 5 highlights that Infants and children have higher fluoride exposure levels than adults. Hence, infants and young children are the hy- per-sensitive age group to fluoride risk. The infant and children hyper-sensitivity is explained by the fact that the growth skeletal and the mineralization of tooth bud start up during this period. Moreover, a Canadian study [14] [18] considers that the highest deposition in calcified tissues (bone, teeth) was observed for children case.  W. Guissouma, J. Tarhouni Table 4. Fluoride analysis results. Total number of samples analyzed Percentage of noncompliance Sampling points Noncompliance cases based on NT09.14 based on l’WHO Number of noncompliance Levels of fluoride (mg / L ) Fluoride 100 7% 7% Monastir 1 1.55 Gafsa (Metlaoui) 1 2.22 Gabes (Mareth) 1 1.94 Mednine (Mednine south) 1 2.4 Mednine (Bengarden) 1 2.22 Mednine (Zarzis city) 1 1.53 Tataouine 1 2.08 Figure 4. Ratio of non-compliance fluoride levels in tap water.  W. Guissouma, J. Tarhouni Figure 5. Age depending fluoride levels exposure. 3.3.2. Tunisian Areas Affected by High Fluoride Levels in Drinking Water Levels of daily exposure to fluoride depend mainly on the geographical area. The long time exposure to recom- mended fluoride level does not produce any harmful effects to human. However, upper limit o f fluoride in water causes adverse effects. These effects can be classified as acute and chronic toxicity. 3.3.3. Acute Toxicity by Fluoride in Drinking Water in Tuni sia After calculating the fluoride exposure via drinking water, the highest exposition value is observed in Medenine area (0.08 mg∙kg−1 bw∙d−1). So that; there are no region exhibits a level of water exposure that exceeds the ref- erence value of acute intoxication set by the WHO (1 mg∙kg−1 bw∙d−1), thus we can estimate that the consumer is not exposed to fluoride acu te tox ic ity v ia drinking tap water. 3.3.4. Chronic Toxicity by Fluoride in Drinking Water in Tunisia The chronic toxicity is caused due to long-term ingestion of inadequate amounts of fluor i de in drinki ng water. a) Tooth decay risk in Tunisia A total of 18 from 24 Tunisian governorates (75% of regions) have fluoride concentrations below the mini- mum recommended concentration by WHO (0.5 mg∙L−1) for tooth decay prevention. These regions are located mainly in the northern Tunisia and especially in Beja and Jendouba. Hence, the fluoride supplementation in drinking water is required, can be done by the kitchen salt fluorinated whose real contributions are not known or in the form fluorinated drugs. In Gabes area two water types are observed: water fluoride levels of 0.29 mg∙L−1 in ElHamma area and water fluoride levels of 1.94 mg∙L−1 in Mareth area. So the mixture of these two water types of could be the solution to bring up the beneficial effect of fluoride and to prevent these adverse effects. b) Dental fluorosis risk in Tunisia  W. Guissouma, J. Tarhouni A total number of 6 from 24 Tunisia governorates (25% of regions) have fluoride exposure levels for children exceeding the TRV established by Health Canada (122 mg ∙kg−1 bw∙d−1) of occurrence dental fluorosis. As well drinking tap water contributes at 100% of TRV. So the excess of TRV can appear in another areas if we asso- ciate to water exposure, the food exposure and that provided by the drink (tea) and toothpastes. This step of risk characterization, allows estimating some risk indicators. Such as the hazard quotient (HQ), this is the ratio be- tween the exposure level and the TRV. When the QD exceeds unitary value an adverse effects may occur [18]. Figure 6 shows that 5 areas have HQ higher than the unity, in these areas the tap water consumer can be af- fected by dental fluorosis: e.g. in Medenine area the children have an exposure level is 2 times greater than TRV. c) Skeletal fluorosis risk in Tunisia A total number of 5 from 24 Tunisia governorates (20% of regions) have fluoride exposure levels for infants exceeding the TRV established by Health Canada (200 mg∙kg−1 bw∙d−1) of occurrence skeletal fluorosis [12]. Figure 7 shows that these areas are located in southern Tunisia (Medenine, Gab e s , Gafsa, Tataouine and Zidi- Bouzid) where the HQ is higher than the unity. 3.4. Exceeding Cases of the Safety Limit in Tunisia The percentages of exceeding cases of the safety limit are: 33% for infants; 20% for children; 3% for adults. This analysis pinpoints that infants and children are the most population exposed to fluoride risk. 4. Conclusions This study was the starting point for locating ar ea s with high s anitary risk attributed to drinking water. 75% of Tunisian areas present dental decay risk through tap water consumption, 25% of Tunisian areas present dental fluorosis risk through tap water consumption, 20% of Tunisian areas present skeletal fluorosis risk through tap water consumption. Figure 6. Evolution of hazard quotient in Tunisian areas.  W. Guissouma, J. Tarhouni Figure 7. Fluoridated areas with skeletal fluorosis risks. In Gabes ar ea two w ater types are ob serv ed: wa ter fluoride levels of 0.29 mg∙L−1 in ElHamma ar ea and water fluoride levels of 1.94 mg∙L−1 in Mareth area. So the mixture of these two water types could be the solution to bring up the beneficial effect of fluoride and to prevent these adverse effects. As well, this study concludes that young children and infants are considered as the hyper sensitive age group and they are the most population exposed to risk associated with excess and deficiency fluoride levels in water. Acknowledgements Authors thank the National Agency of Sanitary and Environmental Control Products (ANCSEP) for further dis- cussions and useful information. References [1] WHO (2011) Guidelines for Drinking-Water Quality. 4th Edition, World Health Organization, Geneva. [2] Mazet, P., Anne, C., Jean-luc, S., Monique, O. and Claudine, D. (2002) Les eaux souterraines riches en fluor dans le monde, Université des Sciences et Technologies Montpellier II DEA Sciences de l’eau dans l’environnement continental. [3] InVS (2007) Estimation de l’impact sanitaire d’une pollution environnementale et évaluation quantitative des risques sanitaires. [4] Dhar, V. and Bhatnagar, M. (2009) Physiology and Toxicity of Fluoride. Indian Journal of Dental Research, 20, 350- 355. http://dx.doi.org/10.4103/0970-9290.57379 [5] Warren, J.J., Levy, S.M. and Broffitt, B. (2009) Considerations on Optimal Fluoride Intake Using Dental Fluorosis and Dental Caries Outcomes—A Longitudinal Study. Journal of Public Health Dentistry, 69, 111-115. http://dx.doi.org/10.1111/j.1752-7325.2008.00108.x  W. Guissouma, J. Tarhouni [6] Verkerk, R.H. (2010) The Paradox of Overlapping Micronutrient Risks and Benefits Obligates Risk/Benefit Analysis. Toxicology, 278, 27-38. http://dx.doi.org/10.1016/j.tox.2010.02.011 [7] National Research Council (2006) Fluoride in Drinking Water: A Scientific Review of EPA’s Standards. National Academies Press, Washington DC, 530. [8] Barbier, O. , Arreola-Mendoza, L. and Del Razo, L.M. (2010) Molecular Mechanisms of Fluoride Toxicity. Chemico- Biological Interactions, 2, 319-333. http://dx.doi.org/10.1016/j.cbi.2010.07.011 [9] Mellberg, J.R. and Ripa, L.W. (1983) Fluorides in Preve ntive De nti stry —Theory and Clinical Applications. Quintessence Publishing Co, Chicago, 81-102. [10] Anses (2013) Évaluation des risques liés aux résidus de pesticides dans l’eau de distribution Contribution à l’exposition alimentaire totale, Rapport d’étude scientifique. [11] WHO (2003) Rapport sur la santé dans le monde—Façonner l’avenir. [12] Heath Canada (1997) Documentation pour la qualité de l’eau potable au Canada-Documentation à l’appui-Le fluorure. [13] US EPA (2003) United States Environmental Protection Agency EPA: Supplemental Guidance for Assessing Cancer Susceptibility from Early-Life Exposure t o Carcinogens, EPA/630/R-03/003. [14] CSHPF (1995) Avis sur les limites de sécurité dans les consommations alimentaires des vitamines et de certains minéraux. [15] Parent-Massin, D. (2002) Évaluation des risques toxicologiques et nutritionnels liés à l'utilisation des additifs et auxiliaires de fabrication. In: Additifs et auxiliaires de fabrication dans les industries agroalimentaires, Tec & Do c, Paris, 746 p. [16] NT09.14 (2013) Norme Tunisienne relative à la qualité des eaux destinées à la consommation humaine. [17] SONEDE (2014) Plan schématique simplifié du réseau d’alimentation en eau potable: Localité Gabes . [18] Afsset (2010) Valeurs toxicologiques de référence (VTR) rapport Guide d’élaboration de VTR.
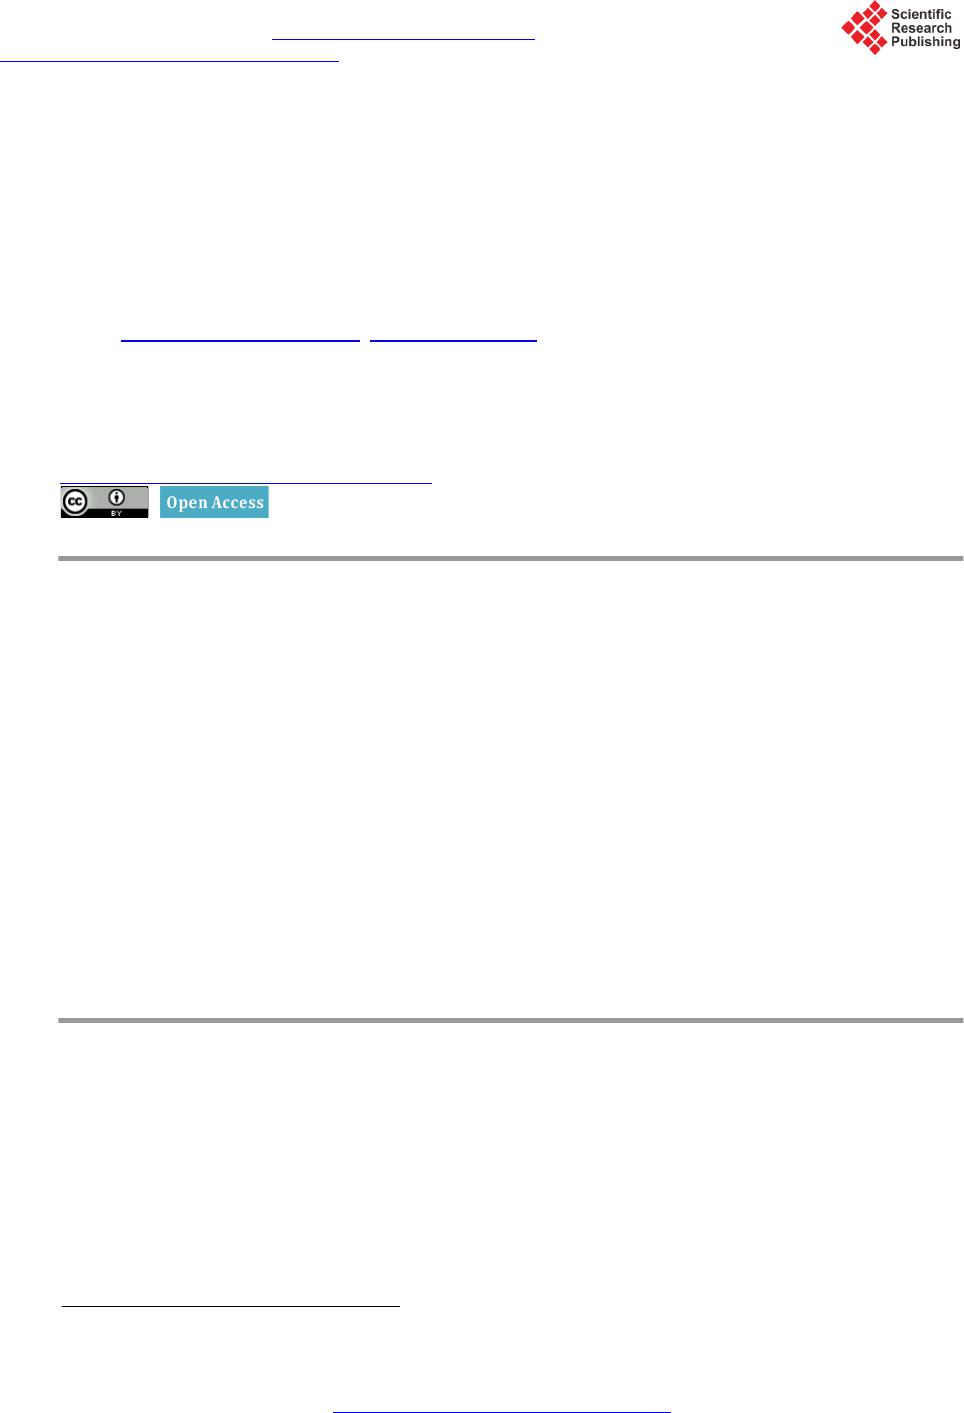
|