 America n Journal of Analy tic al Chemistry, 2011, 2, 303-313 doi:10.4236/ajac.2011.23038 Published Online July 2011 (http://www.scirp.org/journal/ajac) Copyright © 2011 SciRes. AJAC Determinati on of Asymm et ric Di m et hy larg inine and Symmetric D imethyl argi ni ne in Biological Samples of Mice Using LC/MS/MS Daisuke Saigusa1, Mai Takahashi1, Yoshitom i Kanemitsu1, Ayako Ishida1, Takaaki Abe2, Tohru Yamakuni3, Naoto Suzuki1, Yoshihisa Tomioka1* 1Laboratory of Oncology, Pharmacy Practice and Sciences, Graduate School of Pharmaceutical Sciences, Tohoku University, Sendai, Japan 2Division of Medical Sciences, Graduate School of Biomedical Engineering, Tohoku University, Sendai, Japan 3Department of Pharmacotherapy, Graduate School of Pharmaceutical Sciences, Tohok u Uni ve r s i ty , Sendai, Japan E-mail: ytomioka@mail.pharm.tohoku.ac.jp Received March 7, 2011; revised Apri l 2, 2011; accepted April 30, 2011 Abstract Here in, we present a novel method of asymmetric dimethylarginine (ADMA) and symmetric dimethylargi- nine (SDMA) determination within biological samples using protein precipitation and LC/MS/MS. Chroma- tographic separation of ADMA and SDMA was succe ssfully performed using a silica column with optimized elution, or mobile phase, of 10 mM ammonium acetate buffer H2O/methanol/acetonitrile (20/35/45, v/v) at pH 4. The calibration ranges were 0.50 - 50.0 µg·mL–1, and good linearities were obtained for all compounds ( > 0.99). The i nt ra- and inter-assay accuracies with recoveries and precisions at three concentration levels (i.e. 1.00, 5.00 and 25.0 µg·mL–1) were better than 86.9% and 7.36%, respectively. The analytical perfor- mance of the method was evaluated by determination of compounds in plasma, urine and tissues from male BALBc/J mice. For the first time, we were able to characterize the distribution of ADMA, SDMA and AD- MA/SDMA in plasma, urine, brain, heart, kidneys, liver, lungs, pancreas and spleen. Additionally, we dem- onstrated that the ADMA/SDMA r atio in the brain was approximately 10-fold lower than all the other bio- logical samples. Only 10 µL of plasma, 1 µL of urine and about 25 mg of tissues were required. These re- sults suggest that the developed methodology was useful in ADMA and SDMA determination within bio- logical samples. Keywords: Asymmetric Dimethylarginine, Symmetric Dimethylarginine, Creatin in e , Arginine, Tissue, Liquid Chromatography/Tandem Mass Spectrometry. 1. Introduction Asymmetric dimethylarginine (ADMA) and symmetric dimethylarginine (SDMA) are methylated by protein ar- ginine (Arg) methyltransferases (PRMTs) from Arg and metabolized by dimethylarginine dimethylaminohydro- lase (DDAH) (Figure 1) [1,2]. ADMA and SDMA are endogenous uremic toxins that are associated with chro- nic kidney disease (CKD) and renal inflammation [3-6]. In fact, Toyoh ara, et al. reported that ADMA was a bio- marker for CKD patients [7]. In previous studies, the biological reactions associated with these conditions have been primarily attributed to ADMA, whereas the role of SDMA has been overlooked. However, it has recently been reported that a ratio of Arg, ADMA and SDMA is impor tant in the pathophysiological analysis of cardiovascular diseases, reduced renal functions and ot h- er diseases [6,8 ,9]. Therefore, a methodology for detect- ing both ADMA and SDMA i s warranted. The analytical methods of ADMA and SDMA have been developed using several techniques. The enzyme-linked immuno- sorb ent assay (ELISA) method has been shown to detect cross-reacti vity with SDMA [10], albeit with low sensi- tivity. Given that ADMA and SDMA are structural iso- mers and the molecular weight is identical at 202.1, chromatographic separation using high performance liq- uid chromatography (HPLC) with ultra violet (UV), ra- dioimmunoassay and fluorescence (FL) detection was 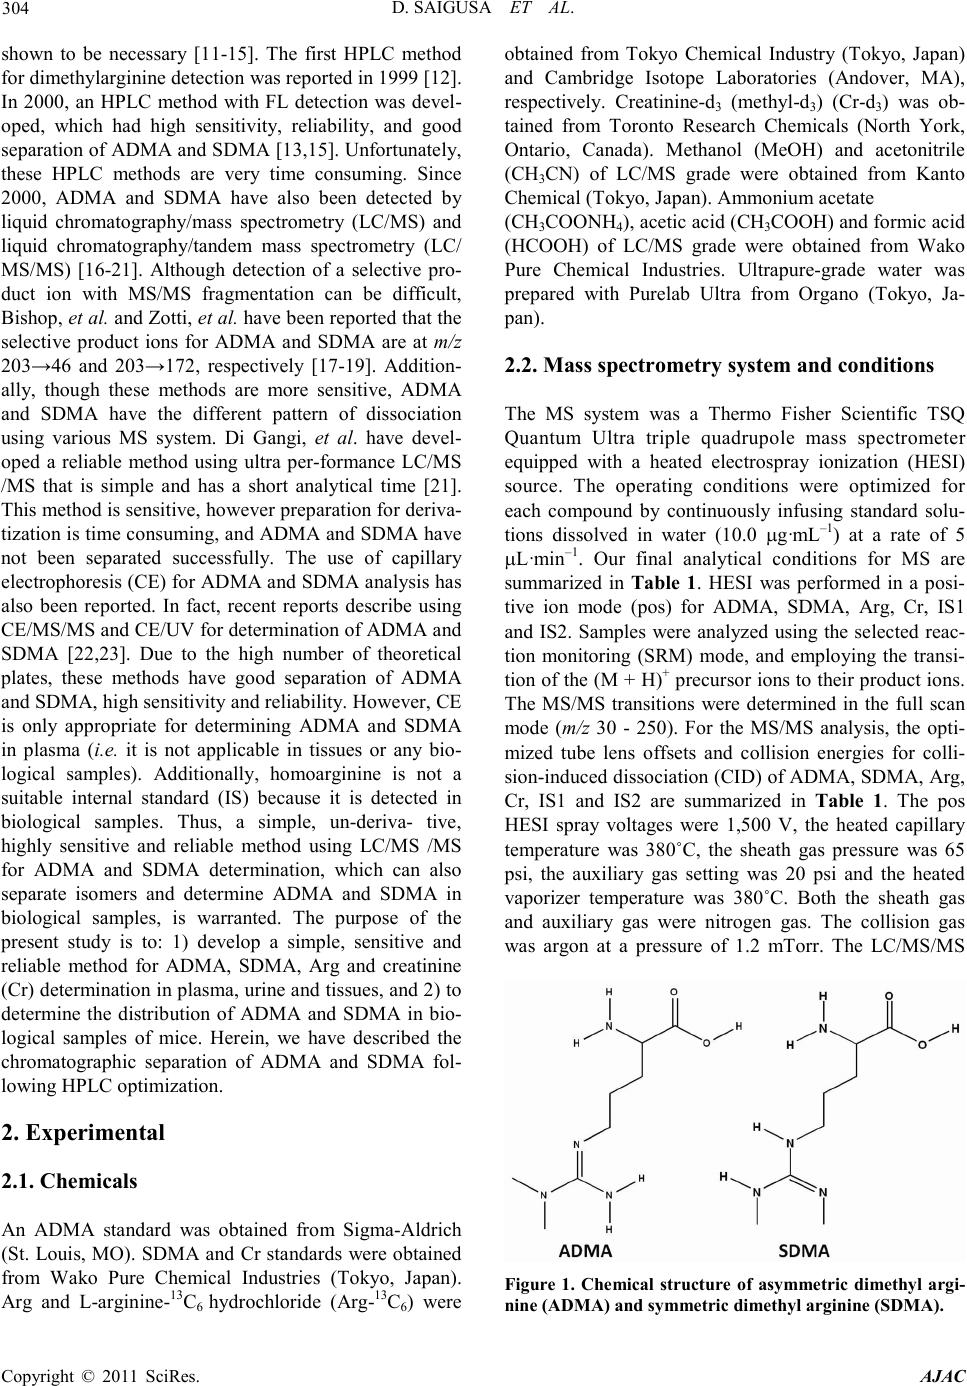 D. SAIGUSA ET AL. Copyright © 2011 SciRes. AJAC 304 shown to be necessary [11-15]. The first HPLC method for dimethylarginine detection was reported in 1999 [12]. In 2000, an HPLC method with FL detection was devel- oped, which had high sensitivity, reliability, and good separation of ADMA and SDMA [13 ,15]. Unfortunately, these HPLC methods are very time consuming. Since 2000, ADMA and SDMA have also been detected by liquid chromatography/mass spectrometry (LC/MS) and liquid chromatography/tandem mass spectrometry (LC/ MS/MS) [16-21]. Although detection of a selective pro- duct ion with MS/MS fragmenta tio n can be difficult, Bishop, et a l. and Zotti, et a l. have been reported that the selective product ions for ADMA and SDMA are at m/z 203→46 and 203→172, respectively [17-19]. Addition- ally, though these methods are more sensitive, ADMA and SDMA have the different pattern of dissociation using various MS system. Di Gangi, et al. have devel- oped a reliable method using ultra per-formance LC/MS /MS that is simple and has a short analytical time [21]. Thi s met ho d is sensitive, however preparation for deriva- tization is ti me consuming, and ADMA and SDMA ha ve not been separated successfully. The use of capillary electrophoresis (CE) for ADMA and SDMA analysis has also been reported. In fact, recent reports describe using CE/MS/MS and CE/U V for det erminat io n o f AD M A a nd SDMA [22,23]. Due to the high number of theoretical plates, these methods have good separation of ADMA and SDMA, high sensitivity and reliability. Ho wever, CE is only appropriate for determining ADMA and SDMA in plasma (i.e . it is not applicable in tissues or any bio- logical samples). Additionally, homoarginine is not a suitable internal standard (IS) because it is detected in biological samples. Thus, a simple, un-deriva- tive, highly sensitive and reliable method using LC/MS /MS for ADMA and SDMA determination, which can also separate isomers and determine ADMA and SDMA in biological samples, is warranted. The purpose of the present study is to: 1) develop a simple, sensitive and reliable method for ADMA, SDMA, Arg and creatinine (Cr) determination in plas ma, urine a nd tis sues, and 2) to determine the distribution of ADMA and SDMA in bio- logical samples of mice. Herein, we have described the chromatographic separation of ADMA and SDMA fol- lowing HP LC optimization. 2. Experimental 2.1. Chemicals An ADMA standard was obtained from Sigma-Aldrich (St. Louis, MO). SDM A and Cr standards were obtained from Wako Pure Chemical Industries (Tokyo, Japan). Arg and L-arginine-13C6 hydrochloride (Arg-13C6) were obtained from Tokyo Chemical Industry (Tokyo, Japan) and Cambridge Isotope Laboratories (Andover, MA), respectively. Creatinine-d3 (methyl-d3) (Cr-d3) was ob- tained from Toronto Research Chemicals (North York, Ontario, Canada). Methanol (MeOH) and acetonitrile (CH3CN) of LC/MS grade were obtained from Kanto Chemical (Tokyo, Japan). Ammonium acetate (CH3COONH4), acetic acid (CH3COOH) and for mic acid (HCOOH) of LC/MS grade were obtained from Wako Pure Chemical Industries. Ultrapure-grade water was prepared with Purelab Ultra from Organo (Tokyo, Ja- pan). 2.2. Mass spectrometry system and conditi ons The MS system was a Thermo Fisher Scientific TSQ Quantum Ultra triple quadrupole mass spectrometer equipped with a heated electrospray ionization (HESI) source. The operating conditions were optimized for each compound by continuously infusing standard solu- tions dissolved in water (10.0 µg·mL–1) at a rate of 5 µL·min–1. Our final analytical conditions for MS are summarized in Table 1. HESI was performed in a posi- tive ion mode (pos) for ADMA, SDMA, Arg, Cr, IS1 and IS2. Samples were analyzed using the selected reac- tion monitoring (SRM) mode, and employing the transi- tion of the (M + H)+ precursor ions to their product ions. The MS/MS transitions were determined in the full scan mode (m/z 30 - 250). For the MS/MS analysis, the opti- mized tube lens offsets and collision energies for colli- sion-induced dissociation (CID) of ADM A, SDM A, Ar g, Cr, IS1 and IS2 are summarized in Table 1. The pos HESI spray voltages were 1,500 V, the heated capillary temperature was 380˚C, the sheath gas pressure was 65 psi, the auxiliary gas setting was 20 psi and the heated vaporizer temperature was 380˚C. Both the sheath gas and auxiliary gas were nitrogen gas. The collision gas was argon at a pressure of 1.2 mTorr. The LC/MS/MS Figure 1. Chemical structure of asymmetric di me thyl argi- nine (ADMA) and symmetric dime thyl arginine (SDMA) . 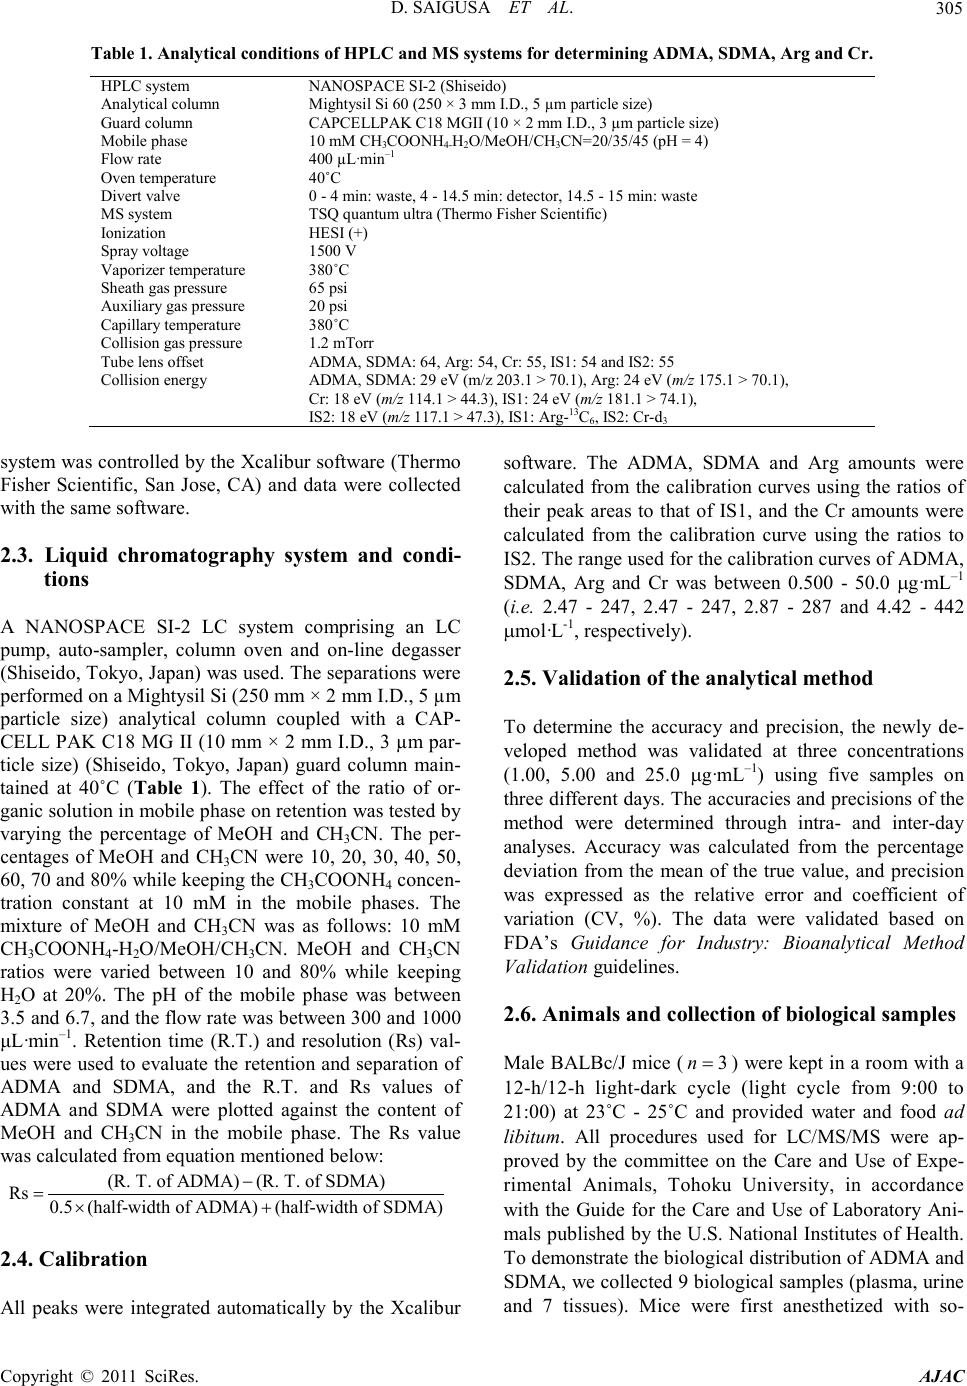 D. SAIGUSA ET AL. Copyright © 2011 SciRes. AJAC 305 Table 1. Analy t i cal co nditions of HPLC and MS systems for determining ADMA, SDMA, Arg and Cr. Analytical column Guard column Mobile phase Flow rate Oven temperat ure Divert va lve MS system Ionization Spray voltage Vaporizer temperature She at h gas pr essure Auxiliary gas pressure Cap illary temp er ature Collision gas pressure Tub e lens of f set Collision energy NANOSPACE SI-2 (Shiseido) Mightysil Si 60 (250 × 3 mm I.D., 5 µm par ticle size) CA P CEL LPA K C18 MGII (10 × 2 mm I.D., 3 µm particl e size) 10 mM CH3COONH4-H2O/MeOH/CH3CN=20/ 35/45 (pH = 4) 400 µL·min–1 40˚C 0 - 4 min: waste, 4 - 14.5 min: detector, 14.5 - 15 min: waste TSQ quantum ultra (Thermo Fisher Scientific) HESI (+) 1500 V 380˚C 65 psi 20 psi 380˚C 1.2 mTorr ADMA, SDMA: 64, Arg: 54, Cr: 55, IS1: 54 and IS2: 55 ADMA, SDM A: 2 9 e V (m/ z 203.1 > 70.1), Arg: 24 eV ( m/z 175.1 > 70.1), Cr: 18 eV (m/ z 114.1 > 44. 3) , IS1: 24 eV (m/z 181.1 > 74.1), IS2: 18 eV (m/z 117.1 > 47. 3) , IS 1 : Arg -13C6, IS2: Cr -d3 syste m was c ontro lled by the Xcalibur software (Thermo Fisher Scientific, San Jose, CA) and data were collected with the same software. 2.3. Liquid chromatography system and condi- tions A NANOSPACE SI-2 LC system comprising an LC pump, auto-sampl er, column oven and on-line degasser (Shiseido, T okyo, Japan) wa s used. T he separations were performed on a Mightysil Si (250 mm × 2 mm I.D., 5 µm particle size) analytical column coupled with a CAP- CELL PAK C18 MG II (10 mm × 2 mm I.D., 3 µ m pa r- ticle size) (Shiseido, Tokyo, Japan) guard column main- tained at 40˚C (Ta b le 1). The effect of the ratio of or- ganic solutio n in mobile phase o n retention was tested b y varying the percentage of MeOH and CH3CN. The per- centages of MeOH and CH3CN were 10, 20, 30, 40, 50, 60, 70 and 80% while keeping the CH3COONH4 concen- tration constant at 10 mM in the mobile phases. The mixture of MeOH and CH3CN was as follows: 10 mM CH3COONH4-H2O/MeOH/CH3CN. MeOH and CH3CN ratios were varied between 10 and 80% while keeping H2O at 20%. The pH of the mobile phase was between 3.5 and 6.7, and the flow rate was between 300 and 1000 μL·min–1. Retention time (R.T.) and resolution (Rs) val- ues were used to evaluate the retention and separation of ADMA and SDMA, and the R.T. and Rs values of ADMA and SDMA were plotted against the content of MeOH and CH3CN in the mobile phase. The Rs value was calculated from equation mentioned below: (R. T. of ADMA)(R. T. of SDMA) Rs0.5(half-width of ADMA)(half-width of SDMA) − =×+ 2.4. Calibration All peaks were integrated automatically by the Xcalibur software. The ADMA, SDMA and Arg amounts were calculated fro m the calibration curves using the ratios of their peak areas to that of IS1, and the Cr amounts were calculated from the calibration curve using the ratios to IS2. T he range used for the calibratio n c urves o f ADMA, SDMA, Arg and Cr was between 0.500 - 50.0 µg·mL–1 (i.e. 2.47 - 247, 2.47 - 247, 2.87 - 287 and 4.42 - 442 µmol·L-1, resp ectively). 2.5. Validation of the analytical method To determine the accuracy and precision, the newly de- veloped method was validated at three concentrations (1.00, 5.00 and 25.0 µg·mL–1) using fiv e samples on three different days. The accuracies and precisions of the method were determined through intra- and inter-day analyses. Accuracy was calculated from the percentage deviation from the mean of the true value, and precision was expressed as the relative error and coefficient of variation (CV, %). The data were validated based on FDA’s Guidance for Industry: Bioanalytical Method Validation guidelines. 2.6. Animals and collection of biological samples Male BALBc/J mice ( ) were kept in a r oom wit h a 12-h/12-h light-dark cycle (light cycle from 9:00 to 21:00) at 23˚C - 25˚C and provided water and food ad libitum. All procedures used for LC/MS/MS were ap- proved by the committee on the Care and Use of Expe- rimental Animals, Tohoku University, in accordance with the Guide for the Care and Use of Laboratory Ani- mals publis hed by the U.S. N ational Institutes of Healt h. To demonstrate the bio logical distr ibutio n of ADM A and SDMA, we collected 9 biological sa mples (plasma, urine and 7 tissues). Mice were first anesthetized with so-  D. SAIGUSA ET AL. Copyright © 2011 SciRes. AJAC 306 Figure 2. Precursor ion mass spectra of ADMA (a) and SDMA (b), and product ion mass spectra of ADMA (c) and SDMA (d). dium pentobarbital. Blood was then collected via retro- orbital bleeding, transferred into a 1.5-mL plastic tube with 30 µL of 10 mM ethylenediaminetetraacetic acid, immediately centrifuged at 16,400 × g for 10 min, and the supernatant was transferred into a new plastic tube. Mice were then rapidly perfused transcardially with cold saline through the left ventricle and thereby sacrificed. Subsequently, urine and tissues (brain, liver, kidneys, lungs, pancreas, spleen and he art ) were q uic kl y r e mo ve d. All plasma, urine and pulverized tissues were stored at –80˚C. 2.7. Sample preparation of plasma and urine Sample preparation of plasma and urine for LC/MS/MS was performed as follows. Plasma (10 µL) and urine (1 µL) were transferred into a 1.5-mL plasti c t ub e . Then, 5 0 µL of internal standard 1 (IS1; Arg-13C6 at 10 µg·mL–1) and IS2 (Cr-d3 at 1 µg·mL–1), and 250 µL of 0.1% HCOOH/CH3CN were added. The resulting mixture was homogenized for 30 s in an ultrasonic bath. After centri- fugation at 16,400 × g for 10 min, the supernatant was transferred into a new p lastic t ube a nd evaporated at 60˚C until dry under nitrogen gas stream. The residue was re- constituted in 50 µL of mobile phase, vortexed for 30 s, and passed through a filter (pore size: 0.2 µm, YMC). Subsequently, 1 µL of the filtered solution was injected into the LC/MS/MS system for analysis. The concentra- tions of the individual compounds were calculated from a regression of the calibration curves. The values were calculated as the mean ± stand ar d d eviation (SD). Cr was used as a biomarker to correct for different volumes or urine produced per day [24]. The corrected values of ADM A, SDM A and Arg in urine were calculated by the concentration ratios of the individual compounds (µg·mL –1) to the Cr concentration in ur ine (µg·mL–1). 2.8. Sample preparation of tissues For LC/MS/MS analysis, tissue preparation based on previously described methodology [25]. Approximately 25 mg of each tissue was transferred into a 2-mL plastic tube, and 1000 µL of 0.1% HCOOH/CH3CN, 50 µL of internal standard 1 (IS1; Arg-13C6 at 10 µg·mL–1) and IS2 (Cr-d3 at 1 µg·mL–1) were added. The resulting mixture was homogenized for 30 s by a soni cator. After centrifu-  D. SAIGUSA ET AL. Copyright © 2011 SciRes. AJAC 307 Figure 3. Effect of MeOH percentage in mobile phase (H2O/MeOH) on retention time (R.T.) and resolution (Rs) (a, b) for ADMA and SDMA. Effect of CH3CN percentag e in mobile ph ase ( H2O/MeOH/CH3CN) on R.T. and Rs (c, d). Effect of pH on R.T. and Rs (e, f). Effect of flow rate on R.T. and Rs (g, h). gation at 16,400 × g for 10 min, the supernatant was transferred into a new plastic tube and the preparations were following as described above. 2.9. Statistical analyses For statistical analysis, we use Micro soft Office Excel 2007 software. The values were calculated as the me an ± SD. 3. Resul t s and discussions 3.1. MS/MS and LC optimization The ionization of ADMA, SDMA, Arg and Cr was per- formed in positive ion mode. The optimized HESI of ADMA, SDMA, Arg, Cr, IS1 and IS2 produced abun- dant [M + H]+ ions at m/z 203.1, 203.1, 175.1, 114.1, 181.1 and 117.1, respectively. The conditions for MS/ MS detection were optimized for maximum product ion formation through infusion analyses. The precursor and product ion mass spectra of ADMA and SDMA in a product ion scan mode were shown in Figure 2. The selective product ion of ADMA and SDMA that has the highest intensity from the precursor ion was the same at m/z 203.1→70.1. Martens-Lobenhoffer et al. reported the collision induced dissociation (CID) process of ADMA and SDMA [26], and some pervious methods selected different product ion [18,19]. In o ur MS system, the product ions were as follows: m/z 40.1 for ADMA and m/z 129.1 for SDMA. However, these ions were not selective and not the highest i ons for ADMA and SDMA determination. Consequently, a chromatographic separa- tion of ADMA and SDMA was necessary in our study. Quantification analyses were performed in the SRM mode owing to the high selectivity and sensitivity of SRM data acquisition, in which transitions from the pre- cursor ion into the product ion were monitored at: m/z 203.1→70.1 for ADMA and SDMA; m/z 175.1→70.1 for Arg; m/z 114.1→44.3 for Cr; m /z 181.1→74.1 for IS1; and m/z 117.1→47.3 for IS2. The results of retention and chromatographic separa- tion are shown in Fig ure 3. Previously, Paglia, et al. described chromatographic separation tech n iques for  D. SAIGUSA ET AL. Copyright © 2011 SciRes. AJAC 308 Table 2. Linearity and correlation c oefficients of A DMA, SDMA, Arg and Cr. ADMA SDMA Arg Cr 0.50 - 50.0 µg·mL–1 (2.86 – 286 μm ol ·L–1) 0.50 - 50.0µg·mL–1 (4.27 – 427 μ mol·L–1) 0.50 - 50.0 µg mL–1 (2.87 – 287 μmol·L–1) 0.50 - 50.0 µg·mL–1 (4.42 – 442 μm o l·L–1) y = 0.30x + 0.040 y = 0.67x + 0.014 y = 0.12x – 0.013 y = 0.82x + 0.018 r = 0.998 r = 0.996 r = 0.999 r = 0.999 a. x, analyte concentration (μmol·L–1); y, peak area ratio Table 3. Accuracy of determination method f o r ADMA, SDMA, Arg and Cr. Added per sample (µg·mL–1) Intr a-da y (n = 5) Inter-day (n = 3) Day 1 Day 2 Day 3 ADMA SDMA Arg Cr 1.00 5.00 25.0 1.00 5.00 25.0 1.00 5.00 25.0 1.00 5.00 25.0 1.05 ± 0.01 5.45 ± 0.05 27.0 ± 0.20 1.10 ± 0.01 5.65 ± 0.05 27.1 ± 0.20 0.90 ± 0.49 4.75 ± 0.06 25.2 ± 0.26 1.00 ± 0.04 5.05 ± 0.15 22.1 ± 0.15 0.95 ± 0.01 5.45 ± 0.04 25.3 ± 0.20 0.95 ± 0.02 5.60 ± 0.05 25.5 ± 0.20 0.90 ± 0.32 4.90 ± 0.09 25.1 ± 0.35 1.00 ± 0.06 5.10 ± 0.14 23.3 ± 0.43 0.95 ± 0.01 5.15 ± 0.05 24.9 ± 0.25 0.95 ± 0.01 5.85 ± 0.05 25.9 ± 0.25 0.90 ± 0.30 4.55 ± 0.06 24.3 ± 0.48 1.05 ± 0.04 4.90 ± 0.15 23.1 ± 0.60 0.98 ± 0.06 5.35 ± 0.17 25.7 ± 1.12 1.00 ± 0.09 5.70 ± 0.13 26.1 ± 0.83 0.90 ± 0.01 4.73 ± 0.18 24.9 ± 0.49 1.02 ± 0.03 5.02 ± 0.10 22.8 ± 0.64 Table 4. Precision of determination method for ADMA, SDM A, Arg and Cr. Added per sample (µg·mL–1) Intr a-da y (n = 5) Inter-day (n = 3) Day 1 Day 2 Day 3 ADMA SDMA Arg Cr 1.00 5.00 25.0 1.00 5.00 25.0 1.00 5.00 25.0 1.00 5.00 25.0 0.19% 0.88% 0.69% 0.28% 1.00% 0.79% 5.84% 1.22% 0.97% 3.53% 3.40% 1.10% 1.02% 0.66% 0.80% 1.36% 0.82% 0.86% 3.08% 1.85% 1.35% 6.16% 2.58% 1.86% 0.87% 0.86% 0.93% 1.11% 0.99% 1.09% 3.30% 1.02% 1.99% 3.52% 3.02% 2.52% 6.32% 2.98% 4.20% 7.36% 2.86% 4.02% 1.66% 0.43% 0.49% 1.43% 0.43% 0.74% ADMA and SDMA using a silica column [20]. Thus, additional conditions of the mobile phase were tested to obtain better retention and separation of ADMA and SDMA. Using either MeOH or CH3CN as the mobile phase did not result in a good separation of ADMA and SDMA.  D. SAIGUSA ET AL. Copyright © 2011 SciRes. AJAC 309 Table 5. Value of ADMA, SDMA, Arg, Cr and ADMA/SDMA in biological samples (n=3). Biolo gica l samples ADMA SDMA Arg Cr ADMA/SDMA plasma (µg·mL–1) urine (µg·mL–1) (mg/mgCr) brain (µg·mL–1) hea r t (µg·mL–1) kidney (µg·mL–1) liver (µg·mL–1) lung (µg·mL–1) pancreas (µg·mL–1) spleen (µg·mL–1) 0.289 ± 0.031 43.0 ± 8.4 0.085 ± 0.012 0.207 ± 0.026 1.17 ± 0.83 10.4 ± 0.3 7.50 ± 1.3 0.977 ± 0.256 3.14 ± 0.91 33.3 ± 4.71 0.047 ± 0.004 12.4 ± 1.8 0.023 ± 0.007 0.113 ± 0.011 0.069 ± 0.047 0.485 ± 0.122 0.596 ± 0.224 0.047 ± 0.016 0.237 ± 0.088 1.30 ± 0.36 15.4 ± 0.3 27.2 ± 20.7 0.046 ± 0.03 39.9 ± 0.4 34.6 ± 0.4 142 ± 9 3.91 ± 1.27 22.6 ± 6.8 129 ±116 168 ± 14 0.795 ± 0.060 553 ± 109 96.7 ± 2.4 110 ± 30 9.27 ± 1.96 4.04 ± 0.27 4.92 ± 1.56 37.8 ± 6.9 7.48 ± 1.26 6.13 ± 0.11 3.48 ± 0.63 1.86 ± 0.40 17.6 ± 0.16 22.3 ± 5.5 13.4 ± 3.8 21.4 ± 2.9 13.6 ± 1.5 26.1 ± 3.4 Retention in MeOH was much shorter than in CH3CN because of interactions of ADMA and SDMA with the silica column was stronger in MeOH than in CH3CN. Although the Rs value increased depending on the per- centage of MeOH, all of the peaks had poor shapes due to tailing (data not shown). On the other hand, using a mixture of MeOH and CH3CN rather than MeOH or CH3CN alone resulted in better separation, retention and peak shapes. In fact, 45% of CH3CN produced the best retention and Rs value (Rs = 1.62). Because of hydro- philic interac tions, the d istr ibutio n o f ADMA and SDMA between the silica column and MeOH was too weak and CH3CN was too strong. Thus, a mixture of MeOH and CH3CN results in the best retention and separation of ADMA and SDMA. Furthermore, retention time is im- portant for high-throughput analysis. In 45% of CH3CN, retention time was significantly increased for both AD- MA and SDMA due to the strong hydrophobicity of CH3CN, which retained the targeted compounds on the silica column. Additionally, pH dramatically affected the retention, separation and peak shapes. ADMA and SDMA were strongly retained at pH 5 and over. The Rs value at pH 3.5 was very low (Rs = 1.03) and the peak shapes and intensity were worse at pH 4.5 and over. The flow rate was determined from the Rs value of ADMA and SDMA. The optimal Rs value was 1.5 at a flow rate of 400 µL·min –1. The best retention, separation and peak shapes were achieved at pH 4 and a flow rate of 400 µL·min–1. These results indicate that the optimal mobile phase consists of 10 mM CH3COONH4 H2O/MeOH/CH3CN (20/35/45, v/v) adjusted to pH 4 using CH3COOH. Separations were performed on a Mightysil Si (250 mm × 2 mm I.D., 5 µm particle size) analytical column coupled with a CAPCELL PAK C18 MG II (10 mm × 2 mm I.D., 3 µm particle size) (Shisei- do, Tokyo, Japan) guard column maintained at 40˚C. A valve was used to divert the LC effluent to waste during the first 4 min and last 0.5 min of the chromatographic run. Typical chromatograms of aqueous standard solu- tions are shown in Figure 4. The retention times of ADMA, SDMA, Arg, Cr, IS1 and IS2 were 13.1, 12.0, 9.2, 5.1, 9.2 and 5.1 min, respectively. 3.2. Limit of quantification (LLOQ) and lower limit of detection (LLOD) The lower limit of quantification (LLOQ) was consi- dered as the lowest concentration that was measurable with a CV of >20 and a signal-to-noise (S/N) ratio of >10. The lower limit of detec tion (LLOD) was defined as the concentration with an S/N of 3. The analytical pro- cedure was sensitive with LLOQ and LLOD values for ADM A, SD M A, Ar g and Cr of 2.47, 2.47, 2.87 and 4.42 µmol·L–1 and 0.742, 0.742, 0.862 and 1.33 µmol·L-1, respectively. The LLOD values obtained using our me- thodology were similar to those previously reported for ADMA and SDMA determination in biological samples [23]. However, the previously reported methodology required 100 µL of plasma, whereas our methodology required only 10 µL of plasma and 1 µL of urine. These results suggest that the sensitivity of our novel met ho- dology was 10-fold greater than the previously reported met hodology. 3.3. Linearity The linearity of the calibration curves was evaluated us- ing seven concentrations (0.250, 0.500, 1.00, 2.50, 5.00, 25.0 and 50.0 µg·mL–1). The calibration curves of AD- MA, SDMA, Arg and Cr were all linear over a range of 0.500 - 50.0 µg·mL–1 (2.47 - 247, 2.47 - 247, 2.87 - 287 and 4.42 - 442 µmol·L–1, respectively) (Table 2). A li- near regression analysis was performed on these portions  D. SAIGUSA ET AL. Copyright © 2011 SciRes. AJAC 310 of the curves, and it was found that the correlation coef- ficient was grea te r than 0.99 9 for all analytes. 3.4. Accuracy and precision The results for the accuracy and precision are shown in Tables 3 and 4, respectively. The intra- and inter-day accuracies ranged from 86.9% to 112% for the three concentrations used with all of the compounds. The in- tra- and inter-day precisions ranged from 0.19% to 7.36% for the three concentrations used with all of the compounds. These results indicate that our methodology has good re liability and repeatability. Validation was de - termined by spiking the standard compounds in plasma. Generally, validation of analytical met hods is necessary, since the effects of ion suppression are variable in dif- ferent types of tissues, and this is achieved by spiking each tissue sample. In our methodology, matrix effects could be avoided by using a silica column and the opti- mal mobile phase, which allows for chromatographic se- paration of ADMA and SDMA in several biological Figure 4. SRM chromatograms of m/z 114.1→44.3 for Cr, m/z 117.1→47.3 for Cr-d3, m/z 175.1→70.1 for Arg, m/z 181.1→74.1 for Arg-13C6 and m/z 203.1→70.1 for ADMA and SDMA from s tandard compounds. samples. 3.5. Tissue distribution of ADMA and SDMA in BALBc/J mice ADMA, SDMA, Arg and Cr levels determined from various tissue samples of mice are shown in Table 5. Although, all compounds were detected, some samples contained analytes at concentration levels outside the linear working range. These samples were adjusted into the working range of the calib ration and were reana- lyzed. The SRM c hromatograms o f biolo gical sa mple are sho wn in Figure 5. ADMA and S DMA levels were high in urine, kidneys, liver, pancreas and spleen. With the exception of low liver levels, Arg had similar urine and tissue levels as ADMA and SDMA. Cr levels were high in plasma, urine, brain, heart and pancreas. In previous studies, Arg/ADMA or ADMA + SDMA/ monome t hy- larginine (MMA) ratios were described to have an im- portant role evaluating disease progression [27]. There- for e, we calculated ADMA/SDMA ratios for tiss ue com- parisons (Table 5). ADMA/SDMA ratios in the brain Figure 5. SRM chromatograms of m/z 114.1→44.3 for Cr, m/z 117.1→47.3 for Cr-d3, m/z 175.1→70.1 for Arg, m/z 181.1→74.1 for Arg-13C6 and m/z 203.1→70.1 for ADMA and SDMA from a biological sample (plasma).  D. SAIGUSA ET AL. Copyright © 2011 SciRes. AJAC 311 and plasma were lower than in the other tissues. The present study is the first to demonstrate lower level of ADMA/SDMA in t he brain. DDAH is an enzyme that is known to metabolize endogenous nitric oxide synthase (NOS) inhibitors such as MMA and ADMA to citrulline [28]. The gene expression of DDAH I and II has been reported by Tra et a l., and D DAH I have been more dis- tributed in the brain than the other organs [29]. In addi- tion, DDAH I and NOS were up-regulated in neurons following nerve injury [30]. These reports indicated that ADMA might be expeditiously metabolized by DDAH I in the b rain, a nd the central nerves system might be p ro- tected by the low concentration of ADMA from the af- fection of NOx via the inhibition with NOS. Although the reason and mechanism for these findings cannot be elucidated in the present study, the data suggests that the brain a nd pl as ma ma y ha ve high levels of SDMA in rela- tion to ADMA. It has been suggested that the relative value is just as important as the absolute value for re- vealing the mechanisms of ADMA and SDMA. Thus, our novel methodology proved to be useful in detecting ADMA and SDMA in various biological samples with high sensiti vity and selectivity . 4. Concluding remarks We have developed a methodology for ADMA and SDMA determination in biological samples using LC/ MS/MS. Furthermore, it was validated that this metho- dology can determine ADMA and SDMA levels with high sensitivity and reliability. This metho dology is the first of its kind that can determine tissue distribution of ADMA and SDMA with good separation. Additionally, this methodology requires small sample sizes, specifi- cally only 10 µL of plasma, 1 µL of urine and about 25 mg of tissues were required in the present study. Fur- thermore, the ADMA/SDMA ratio was found to be lower in the brain than in any other tissues. Although the me- chanism for this finding is unclear, the developed me- thodology was use ful in determining ADMA a nd SDM A levels in biolo gical samples. 5. References [1] A. J. Pope, K. Karuppiah and A. J. Cardounel, “Role of the PRMT-DDAH-ADMA axis in the Regulation of En- dothelial Nitric Oxide Production,” Pharmacological Re- serch, Vol. 60, No. 6, 2009, pp. 461-465. doi:10.1016/j.phrs.2009.07.016 [2] C. Y. Ivashchenko, B. T. Bradley, Z. H. Ao, J . Leiper, P. Vallance and D. G. Johns, “Regulation of the ADMA- DDAH System in Endothelial Cells: A Novel Mechanism for the Sterol Response Element Binding Proteins, SREBP 1c and-2,” American Journal of Physiology-Heart and Circulatory Physiology, Vol. 298, 2010, pp. 251-258. doi:10.1152/ajpheart.00195.2009 [3] F. Kronenberg, “Emerging Risk Factors and Markers of Chronic Kidney Disease Progression,” Nature Reviews Nephrology, Vol. 5, 2009, pp. 677-689. doi:10.1038/nrneph.2009.173 [4] J. T. Kielstein, D. Fliser and H. Veldink, “Asymmetric Dimethylarginine and Symmetric Dimethylarginine: Axis of Evil or Useful Alliance?” Seminars in Dialysis, Vol. 22, No. 5, 2009, pp . 346-350. doi:10.1038/nrneph.2009.173 [5] L. Tarnow, P. Hovind, T. Teerlink, C. D. A. Stehouwer and H. H. Parving, “Elevated Plasma Asymmetric Dime- thylarginine as a Marker of Cardiovascular Morbidity in Early Diabetic Nephropathy in Type 1 Diabetes,” Di- abetes Care, Vol. 27, No. 3, 20 04, pp. 765-769. doi:10.2337/diacare.27.3.765 [6] S. Abhary, N. Kasmeridis, K. P. Burdon, A. Kuot, M. J. Whiting, W. P. Yew, N. Petrovsky and J. E. Craig, “Di- abetic Retinopathy is Associated With Elevated Serum Asymmetric and Symmetric Dimethylarginines,” Di- abetes Care, Vol. 32, No. 11, 2009, pp. 2084-2086. doi:10.2337/dc09-0816 [7] T. Toyohara, T. Suzuki, R. Morimoto, Y. Akiyama, T. Souma, H. O. Shiwaku, Y. Takeuchi, E. Mishima, M. Abe, M. Tanemoto, S. Masuda, H. Kawano, K . Maernura, M. Nakayama, H. Sato, T. Mikkaichi, H. Yamaguchi, S. Fukui, Y. Fukumoto, H. Shimokawa, K. Inui, T. Terasaki, J. Goto, S. Ito, T. Hishinuma, I. Rubera, M. Tauc, Y. Fu- jii-Kuriyama, H. Yabuuchi, Y. Moriyama, T. Soga and T. Abe, “SLCO4C1 Transporter Eliminates Uremic Toxins and Attenuates Hypertension and Renal Inflammation,” Journal of the American Society of Nephrology, Vol. 20, 2009, pp. 2546-2555. doi:10.1681/ASN.2009070696 [8] J. T. Kielstein, R. H. Boger, S. M. Bode-Boger, J. Scha- ffer, M. Barbey, K. M. Koch and J. C. Frolich, “Asym- metric Dimethylarginine Plasma Concentrations Differ in Patients with End-Stage Renal Disease: Relationship to Treatment Method and Atherosclerotic Disease,” Journal of the American Society of Nephrology, Vol. 10, 1999, pp. 594-600. [9] E. Schwedhelm, R. Maas, J. Tan-Andresen, F. Schulze, U. Riederer and R. H. Boger, “High-Throughput Liquid Chromatographic-Tandem Mass Spectrometric Det ermi- nation of Arginine and Dimethylated Arginine Deriva- tives in Human and Mouse Plasma,” Journal of Chroma- tography B-Analytical Technologies in the Biomedical and Life Sciences, Vol. 851, No. 1-2, 2007, pp. 211-219. doi:10.1016/j.jchromb.2006.11.052 [10] F. Schulze, R. Wesemann, E. Schwedhelm, K. Sydow, J. Albsmeier, J. P. Cooke and R. H. Boger, “Determination of Asymmetric Dimethylarginine (ADMA) Using a Nov- el ELISA Assay,” Clinical Chemistry and Laboratory Medicine, Vol. 42, No. 12, 2004, pp. 1377-1383. doi:10.1515/CCLM.2004.257 [11] A. Zinellu, S. Sotgia, E. Zinellu, A. Pinna, F. Carta, L. Gaspa, L. Deiana and C. Carru, “High-Throughput CZE- UV Determination of Airginine and Dimethylated Argi-  D. SAIGUSA ET AL. Copyright © 2011 SciRes. AJAC 312 nines in Human Plasma,” Electropho r es is, Vol. 28, No. 12, 2007, pp. 1942-1948. doi:10.1002/elps.200600534 [12] N. Rawal, Y. J. Lee, J. N. Whitaker, J. O. Park, W. K. Paik and S. Kim, “Urinary-Excretion of N-G-Dimethylarginines in Multiple-Sclerosis Pa- tients-Preliminary-Ob- servations,” Journal of the Neu- rological Sciences, Vol. 129, No. 2, 1995, pp. 186-191. doi:10.1016/0022-510X(94)00277-U [13] S. Sotgia, A. Zinellu, G. A. P inna, L. Deiana and C. Car- ru, “A New Selective Pre-Column Ninhydrin-Based De- rivatization for a RP-HPLC Determination of Plasma Asymmetric Dimet hyl-L-Arginine (ADMA) by Fluores- cence Detection,” Amino Acids, Vol. 34, No. 4, 2008, pp. 677-682. doi:10.1007/s00726-007-0001-x [14] Y. Ohike, K. Kozaki, K. Iijima, M. Eto, T. Kojima, E. Ohga, T. Santa, K. Imai, M. Hashimoto, M. Yoshizumi and Y. Ouchi, “Amelioration of Vascular Endothelial Dysfunction in Obstructive Sleep Apnea Syndrome by Nasal Continuous Positive Airway Pressure-Possible In- volvement of Nitric Oxide and Asymmetric NG, NG- Dimethylarginine,” Ci rculation Journal, Vol. 69, No. 2, 2005, pp. 221-226. doi:10.1253/circj.69.221 [15] Y. Dobashi, T. Santa, K. Nakagomi and K. Imai, “An Automated Analyzer for Methylated Arginines in Rat Plasma by High-Performance Liquid Chromatography with Po st column Fluorescence Reaction,” Analyst, Vol. 127, No. 1, 2002, pp. 54-59. doi:10.1039/b106828h [16] K. Vishwanathan, R. L. Tackett, J. T. Stewart and M. G. Bartlett, “Determination of Arginine and Methylated Ar- ginines in Human Plasma by Liquid ChromAtogra- phy-Tandem Mass Spectrometry,” Journal of Chromato- graphy B, Vol. 748, No. 1, 2000, pp. 157-166. doi:10.1016/S0378-4347(00)00399-6 [17] R. Maas, J. Tan-Andreesen, E. Schwedlhelm, F. Schulze and R. H. Boger, “A Stable-Isotope Based Technique for the Determination of Dimethylarginine Dimethylamino- Hydrolase (DDAH) Activity in Mouse Tissue,” Journal of Chromatography B, Vol. 851, No. 1-2, 2007, pp. 693- 701. doi:10.1016/j.jchromb.2007.01.020 [18] M. J. Bishop, B. Crow, D. Nor ton, E . Pali akov, J . George and J. A. Bralley, “Direct Analysis of Un-Derivatized A- symmetric Dimethylarginine (ADMA) and L-Arginine from Plasma Using Mixed-Mode Ion-Exchange Liquid Chromatography-Tandem Mass Spectrometr y,” Journal of Chromatography B-Analytical Technologies in the Biomed ical and Life Sci ences, Vol. 859, No. 2, 2007, pp. 164-169. doi:10.1016/j.jchromb.2007.09.024 [19] M. Zotti, S. Schiavone, F. Tricarico, M. Colaianna, O. D'Apolito, G. Paglia, G. Corso and L. Trabace, “Deter- mination of Dimethylarginine Levels in Rats Using HILIC- MS/MS: An in Vivo Microdialysis Study,” Jou r- nal of Sep ar at i on Science, Vol. 31, 2008, pp. 2511-2515. doi:10.1002/jssc.200800147 [20] G. Paglia, O. D'Apolito, F. Tricarico, D. Garofalo and G. Corso, “Evaluation of Mobile Phase, Ion Pairing, and Temperature Influence on an HILIC-MS/MS Method for L-Arginine and its Dimethylated Derivatives Detect ion,” Journal of Separation Science, Vol. 31, No. 13, 2008, pp. 2424-2429. doi:10.1002/jssc.200800142 [21] I. M. Di Gangi, L. Chiandetti, A. Gucciardi, V. Moret, M. Natural e and G. Giordano, “Simultaneous Quantitative Determination of N-G,N-G-Dimethyl-L-Arginine or Asy- mmetric Dimethylarginine and Related Pathway's Meta- bolites in Biological Fluids by Ultrahigh-Performance Liquid Chromatography/Electrospray Ionization-Tandem Mass Spectrometry,” Analytica Chimica Acta, Vol. 677, No. 2, 2010, pp. 140-148. doi:10.1016/j.aca.2010.08.011 [22] C. Desiderio , D. V. Rosset ti, I. Messana, B. Giardina and M. Castagnola, “Analysis of Arginine and Methylated Metabolites in Human Plasma by Field Amplified Sample Injection Capillary Electrophoresis Tandem Mass Spec- trometry,” Electrophoresis, Vol. 31, No. 11, 2010, pp. 1894-1902. doi:10.1002/elps.200900690 [23] A. Zinellu, S. Sotgia, M. F. Usai, G. Pintus, L. Deiana and C. Carru, “Improved Method for Plasma ADMA, SDMA, and Arginine Quantification by Field-Amplified Sample Injection Capillary Electrophoresis UV Detec- tion,” Analytical and Bioanalytical Chemistry, Vol. 23, 2010. [24] D. Saigusa, N. Suzuki, M. Takahashi, K. Shiba, S. Tana- ka, T. Abe, T. Hishinuma and Y. Tomioka, “Simultane- ous Determination of Guanidinosuccinic Acid and Gua- nidinoacetic Acid in Urine Using High Performance Liq- uid Chromatography/Tandem Mass Spect rometry,” Ana- lytica Chimica Acta, Vol. 677, No. 2, 2010, pp. 169- 175. doi:10.1016/j.aca.2010.08.005 [25] A. Nakajima, D. Saigusa, N. Tetsu, T. Yamakuni, Y. Tomioka and T. Hishinuma, “Neurobehavioral effects of tetrabromobisphenol A, a brominated flame retardant, in mice,” Toxicology Letters, Vol. 189, No. 1, 2009, pp. 78- 83. doi:10.1016/j.toxlet.2009.05.003 [26] J. Martens-Lobenhoffer, E. Schwedhelm and D. Tsikas, “Quantification of Arginine and its Mono- and Dimethy- lated Analogs NMMA, ADMA and SDMA in Biological Fluids by LC-MS/MS: Is LC superfluous?” Journal of chromatography B, Analytical technologies in the bio- medica l and life sciences, Vol. 877, No. 27, 2009, pp. 3261-3266. doi:10.1016/j.jchromb.2009.07.003 [27] Z. Ajtay, A. Nemeth, E. Sulyok, A. Cziraki, S. Szabados, J. Martens-Lobenhoffer, F. Awiszus, C. Szabo an d S. M. Bode-Boger, “E ffect s of Stent Implementation on Plasma Levels of Asymmetric Dimethylarginine in Patients with or without ST-Segment Elevation Acute Myocardial In- farction,” International Journal of Molecular Medicine, Vol. 25, No. 4, 2010, pp. 617-624. [28] M. Kimoto, G. S. Whitley, H. Tsuji and T. Ogawa, “Detection of NG, NG-Dimethylarginine Dimethylami- nohidrolase in Human Tissues Us ing a Monoclonal Anti- body,” Journal of Biochamistry, Vol. 117, No. 2, 1995, pp. 237-238. doi:10.1093/jb/117.2.237 [29] C.T.L. Tran, M.F. Fox, P. Vallance, and J. M. Leiper, “Chromosomal Localozation, Gene Structure, and Ex- pression Pattern of DDAH1: Comparison with DDAH2 and Implications for Evolutionary Origins,” Genomics, Vol. 68, No. 1, 2000, pp. 101-105. doi:10.1006/geno.2000.6262  D. SAIGUSA ET AL. Copyright © 2011 SciRes. AJAC 313 [30] S. Nakagomi, S. Kiryu-Seo, M. Kimoto, P. C. Emson and H. Kiyama, “Dimethylarginine Dimethylaminohidrolase (DDAH) as a Nerve-Injury-Associated Mol ecule: mRNA Localozation with Neuronal NO Synthase (nNOS) in Axotomizwd Motoneurons,” European Journal of Neuro- science, Vol. 11, No. 6, 1999, pp. 2160-2166. doi:10.1046/j.1460-9568.1999.00634.x
|