Journal of Power and Energy Engineering
Vol.03 No.07(2015), Article ID:58088,7 pages
10.4236/jpee.2015.37002
Validation of the Actuator Line Model for Simulating Flows past Yawed Wind Turbine Rotors
Wen Zhong Shen1, Wei Jun Zhu1, Hua Yang2
1Department of Wind Energy, Technical University of Denmark, Lyngby, Denmark
2School of Hydraulic, Energy and Power Engineering, Yangzhou University, Yangzhou, China
Email: wzsh@dtu.dk


Received 26 March 2015; accepted 10 July 2015; published 17 July 2015

ABSTRACT
The Actuator Line/Navier-Stokes model is validated against wind tunnel measurements for flows past the yawed MEXICO rotor and past the yawed NREL Phase VI rotor. The MEXICO rotor is operated at a rotational speed of 424 rpm, a pitch angle of −2.3˚, wind speeds of 10, 15, 24 m/s and yaw angles of 15˚, 30˚ and 45˚. The computed loads as well as the velocity field behind the yawed MEXICO rotor are compared to the detailed pressure and PIV measurements which were carried out in the EU funded MEXICO project. For the NREL Phase VI rotor, computations were carried out at a rotational speed of 90.2 rpm, a pitch angle of 3˚, a wind speed of 5 m/s and yaw angles of 10˚ and 30˚. The computed loads are compared to the loads measured from pressure measurement.
Keywords:
Actuator Line Model, MEXICO Rotor, NREL Phase VI Rotor, Yawed Wind Turbine Rotor

1. Introduction
In order to precisely predict the performance of wind turbines in wind farms, it is required to have a detailed knowledge on the inflow conditions in front of the turbines which are usually created by the atmospheric turbulence, the ground and the upstream turbines. To compute such complex flows, using a standard CFD code, which solves both the boundary layer on the blades and the wake, is too expensive. In order to reduce computational costs, the Actuator Line/Navier-Stokes (AL/NS) technique [1] was developed at the Technical University of Denmark (DTU) such that the procedure of solving the boundary layer is skipped and the loading on the rotor blades is represented by using rotating body forces. This enables more mesh points to be used in the wake region or in the flow regions between the turbines. The Actuator Line (AL) model has been further developed by including the atmospheric turbulence and the wind shear by using the immersed boundary technique for flows past two wind turbines [2] [3]. In order to include the influence of landscape, a hybrid Actuator Line/Navier-Stokes model has been developed where the rotor is solved with the Actuator Line model and the ground is solved with a standard Navier-Stokes solver for Very Large Eddy Simulation (VLES). The flow past a wind turbine on a Gaussian hill was simulated in [4].
An important check is whether the AL/NS technique can predict the loads on the blades and the wake behind the turbines correctly. In the first part of the MexNext project [5], the AL/NS technique has been validated against detailed measurements for the MEXICO rotor in standard axial conditions [6] [7]. Results showed that the model can predict the loading and the wake with good accuracy.
In this paper, the AL/NS technique is validated against wind tunnel measurements for wind turbine rotors in yaw. Both measurements for the MEXICO and NREL Phase VI rotors in yaw are used.
2. Numerical Methods
The numerical method used in the paper is the Actuator Line/Navier-Stokes model which was developed in [1]-[4] [6] [7]. The principle of the model is summarized here.
The EllipSys3D code [8] [9] is used as the Navier-Stokes solver of the AL/NS model. The EllipSys3D code was developed at the Department of Wind Energy, Technical University of Denmark (DTU). The code is based on a multi-block/cell-centered finite volume discretization of the steady/unsteady incompressible Navier-Stokes equations in primitive variables (pressure-velocity). The predictor-corrector method is used. In the predictor step, the momentum equations are discretized using a second-order backward differentiation scheme in time and second-order central differences in space, except for the convective terms that are discretized by the QUICK upwind scheme. In the corrector step, the improved Rhie-Chow interpolation [10] is used in order to avoid numerical oscillations from velocity-pressure decoupling. In order to make it more consistent, the improved SIMPLEC scheme for collocated grids [11] is used. Using the scheme the solution is in-dependent of relaxation parameter and time-step. The obtained Poisson pressure equation is solved by a five-level multi-grid technique. Since the EllipSys3D code is programmed using a multi-block topology, it can be parallelized relatively easily using Message Passing Interface (MPI). The turbulence model used for Large Eddy Simulation is the mixed scale turbulence model developed at LIMSI [12] [13].
To determine the body forces on the rotor blades, we use a blade-element approach combined with airfoil characteristics. The computational domain is chosen to be fixed with the ground and three rotating blades are represented with a rotating body force. At each time step, the flow solver gives a Cartesian velocity field. The velocity at a given blade position is calculated by identifying the index of blade position and performing a tri-linear interpolation. In order to find the loading, the obtained Cartesian velocity (u, v, w) is transformed into the local velocity of the blades,
 (1)
(1)
 (2)
(2)
where (Vn, Vt) are the velocity in the normal and tangential directions of the rotor, respective, g is the yaw angle, q is the azimuth angle. Since the rotor is rotating with an angular velocity W, the flow angle is determined as
 (3)
(3)
The angle of attack at each cross section is defined as  where b is the sum of local twist and pitch angles on the rotor. The relative velocity is
 (4)
(4)
The force per spanwise unit length is
 (5)
(5)
where  and
and  are the lift and drag coefficients, respectively. The airfoil data
obtained directly from 2D measurements or computations need to be corrected for rotational effects caused by Coriolis and centrifugal forces, especially for cross-sections near the root. At the same time, airfoil cross-sec- tions near the blade tip are influenced from the fact of pressure equalization from the pressure and suction sides at the tip such that the tip flow is different from the corresponding 2D flow at the same angle of attack. To take into account tip effects, a function F1 is applied on the 2D airfoil data [14]-[16]. The function is
 (7)
(7)
where B is number of blades, the function g is
 (8)
(8)
 (9)
(9)
and c is blade chord.
The g function adjusts the influence of the tip vortices on the pressure distribution in the blade tip region. The number of blades, B, determines the distance between the tip vortices at a fixed tip speed ratio whereas the tip speed ratio, WR/U∞, determines both the distance between the tip vortices at a fixed number of blades, and the pitch of the vortex structure. Their influences on the pressure distribution on the blade are similar and thus are considered together in the g function. Finally, the obtained 2D force is put into a Cartesian regularized volume force.
To take into account the dynamic effects for yawed rotors, the Beddoes-Leishman type dynamic stall model [17] has been implemented in the code.
3. Results
AL/NS computations are carried for both yawed MEXICO and NREL Phase VI rotors. The obtained results are presented in the following two subsections.
3.1. MEXICO Rotor in Yaw
Computations for flows past the MEXICO rotor at a rotational speed of 424 rpm, a pitch angle of −2.3˚, wind speeds of 10, 15, 24 m/s and yaw angle of 15˚, 30˚ and 45˚ were carried out by employing the AL/NS model on a Cartesian mesh consisting of 11.8 M mesh points in a domain of [−16R, 16R] × [−16R, 16R] × [−16R, 16R], with the finest mesh size of R/30 where R is the rotor radius. Two sets of airfoil data: original airfoil data (OAD) and modified airfoil data (MAD) are used for flows past the yawed MEXICO rotor. For more information about the airfoil data, the reader is referred to [6]. To validate the computations (with MAD), the force distributions during one revolution are compared to the DNW measurements in Figure 1 and Figure 2. Figure 1 shows the loading at a wind speed of 10 m/s and a yaw angle of 30˚. The normal force at radial positions of 35%, 60%, 82% r/R follows quite well the experiments while at 92% r/R a phase shift occurs between the computations and the experiments. The variation of the computed tangential force agrees in general with the measurements with slight over-predictions of the mean tangential force. In Figure 2, the force distribution at a wind speed of 15 m/s and a
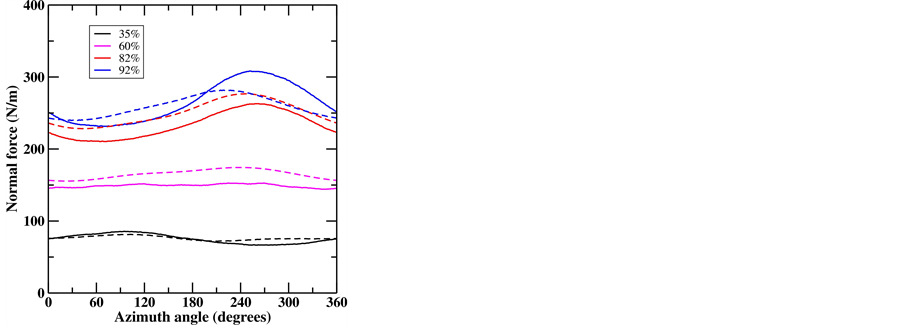
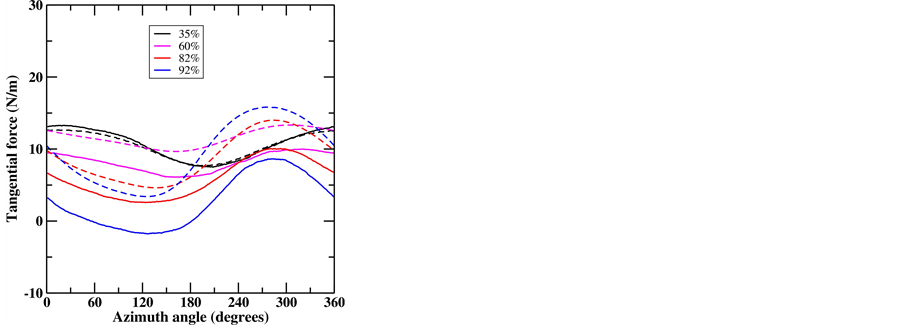
Figure 1. Comparison between computations and experimental data for flows past the MEXICO 25 kW rotor at a wind speed of 10 m/s and a yaw angle of 30o (solid line: experiment; dashed line: computation with MAD).
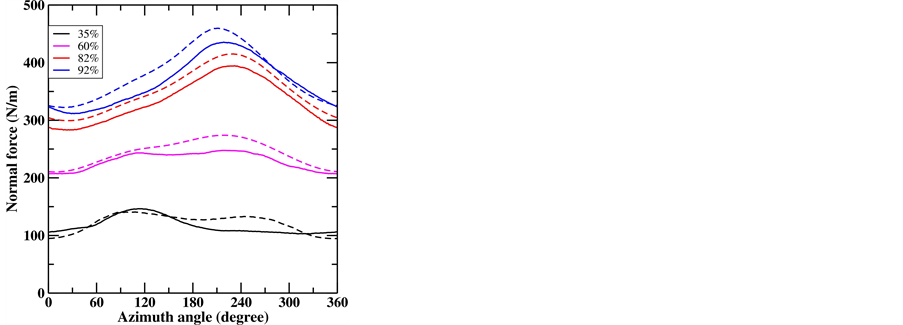
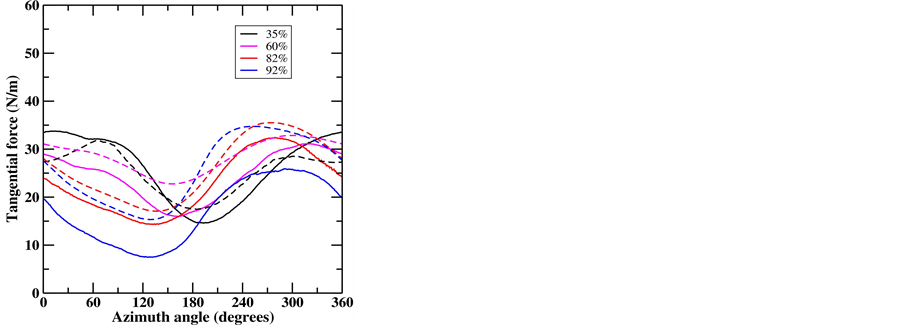
Figure 2. Comparison between computations and experimental data for flows past the MEXICO 25 kW rotor at a wind speed of 15 m/s and a yaw angle of 45˚ (solid line: experiment; dashed line: computation with MAD).
yaw angle of 45˚ is plotted. From the figure, good agreements for both normal and tangential force are seen between the computations and measurements.
The radial, tangential and axial velocity components in the rotor coordinates are also plotted. In Figure 3, the velocity at 0.15 m before the rotor is compared to measurement. From the figure, good agreements are seen. The velocity at 0.15 m after the rotor is also plotted and compared to experiment in Figure 4. Excellent agreements are seen. It is worth noting that in the tip region big velocity variations are seen in the experiments where a smooth transition occurs in the computations. This is probably caused by the too coarse mesh used in the computations.
In order to show the structure behind a yawed rotor, iso-vorticity is plotted in Figure 5. The structure shows that the wake develops first in the axial direction, and then bends to a direction with an angle which is slightly negative (below the wind direction).
3.2. NREL Phase VI in Yaw
Computations for flows past the NREL Phase VI rotor [18] at a rotational speed of 90.2 rpm, a pitch angle of 3˚, a wind speed of 5 m/s and yaw angle of 10˚ and 30˚ were carried out by employing the AL/NS model on a Cartesian mesh consisting of 11.8 M mesh points in a domain of [−16R, 16R] × [−16R, 16R] × [−16R, 16R], with the finest mesh size of R/30 where R is the rotor radius. The airfoil data used in the computations are that described in [15]. To validate the computations, the force distributions during one revolution are compared to the measurements in Figure 6 and Figure 7. Figure 6 shows the loading at a wind speed of 5 m/s and a yaw angle of 10˚. The normal force at radial positions of 30%, 47%, 63%, 80% r/R follows quite well the experiments while at 95% r/R computation over-predicts the normal force which has something to do about tip loss correction. The variation of the computed tangential force follows in general with the measurements but the values are under-predicted. In Figure 7, the force distribution at a wind speed of 5 m/s and a yaw angle of 30˚ is plotted. From the figure, good agreements for both normal and tangential force are seen between the computations and measurements.
4. Conclusion
The Actuator Line/Navier-Stokes model has been validated for both loading and velocity field against measurements for flows past the yawed MEXICO rotor, and for loading for the yawed NREL Phase VI rotor. In general, the model can predict correctly the force changes during a revolution. The velocity behind the rotor can also be predicted correctly in the near field. From the study we can conclude that the AL/NS model is ready to simulate flows past a wind turbine in yaw and to simulate complex flows in wind farms.
Acknowledgements
This work was supported by the Energy-Technological Development and Demonstration Program under the
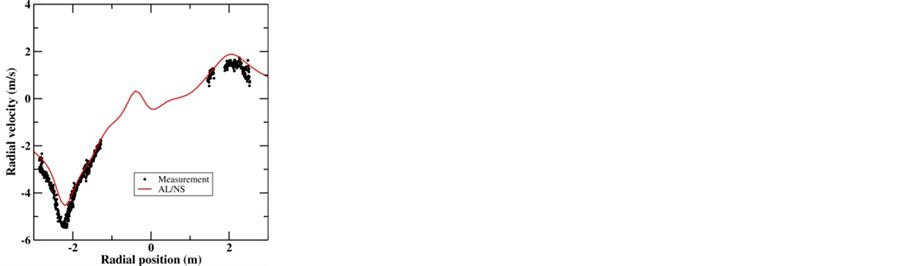
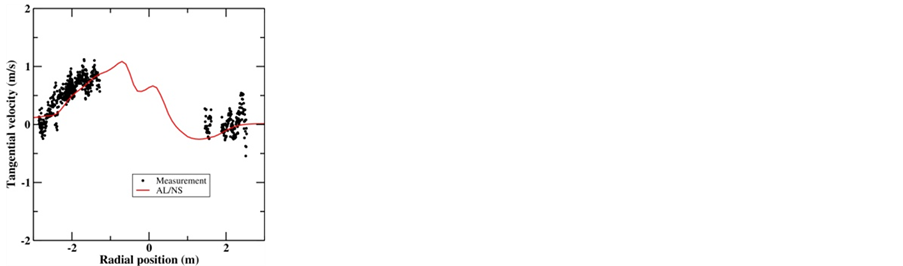
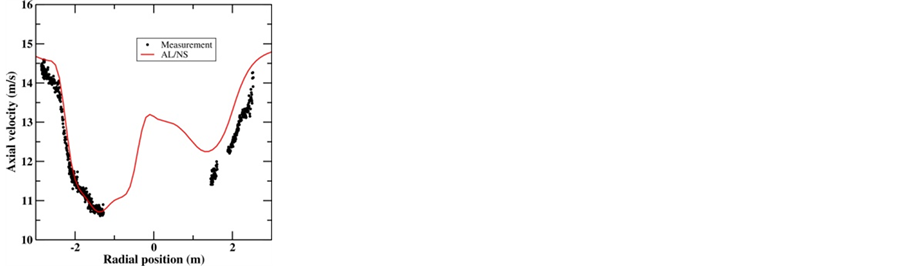
Figure 3. Radial, tangential and axial velocity at 0.15 m before the rotor for flows past the MEXICO rotor at a wind speed of 15 m/s and a yaw angle of 30˚.
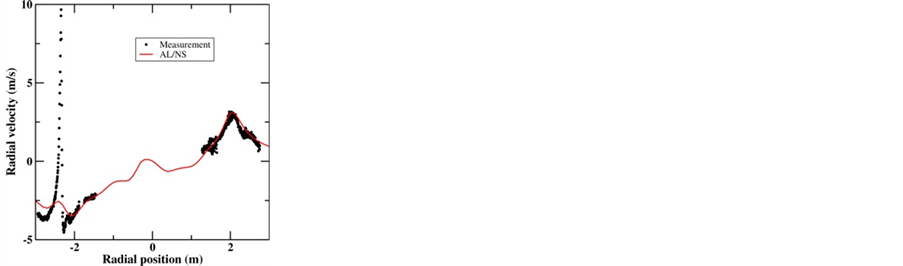
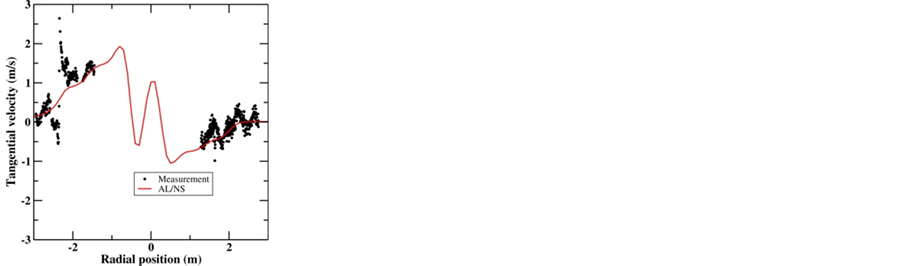
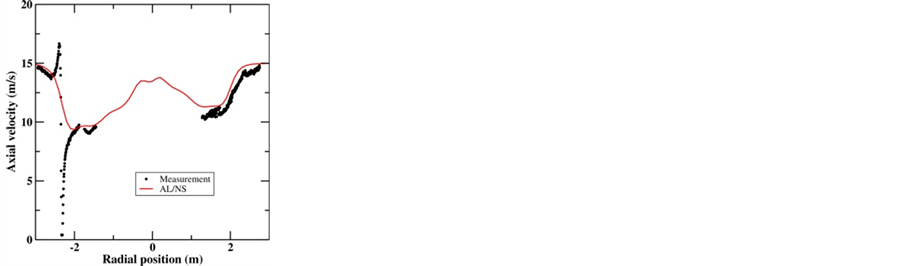
Figure 4. Radial, tangential and axial velocity at 0.15 m after the rotor for flows past the MEXICO rotor at a wind speed of 15 m/s and a yaw angle of 30˚.

Figure 5. Iso-vorticity surface plot for flows past the MEXICO rotor at a wind speed of 15 m/s and a yaw angle of 30˚.


Figure 6. Comparison between computations and experimental data for flows past the NREL Phase VI rotor at a wind speed of 5 m/s and a yaw angle of 10˚ (solid line: experiment; dashed line: computation).
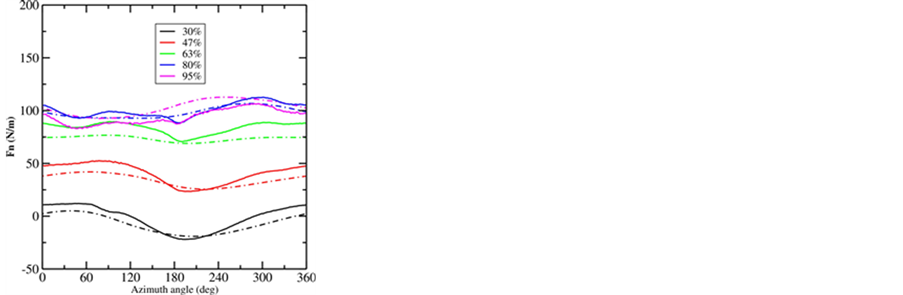
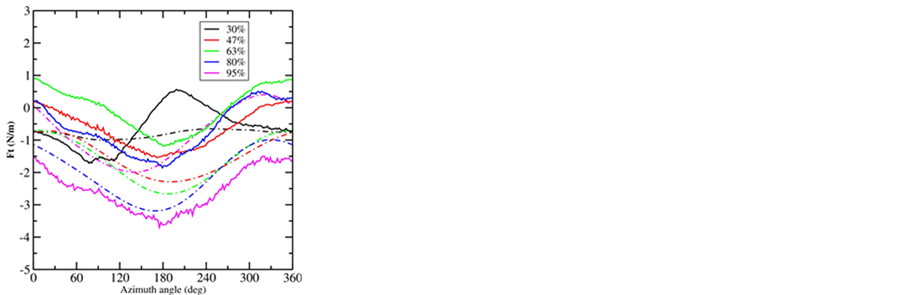
Figure 7. Comparison between computations and experimental data for flows past the NREL Phase VI rotor at a wind speed of 5 m/s and a yaw angle of 30˚ (solid line: experiment; dashed line: computation).
project (J.nr. 64012-0146) and the Danish Council for Strategic Research under the project (Sags nr. 0603- 00506B). The authors wish to give thanks to the international partners for their collaborations in the Mex Next II project within the framework of IEA Wind Annex 29.
Cite this paper
Wen Zhong Shen,Wei Jun Zhu,Hua Yang, (2015) Validation of the Actuator Line Model for Simulating Flows past Yawed Wind Turbine Rotors. Journal of Power and Energy Engineering,03,7-13. doi: 10.4236/jpee.2015.37002
References
- 1. Sorensen, J.N. and Shen, W.Z. (2002) Numerical Modeling of Wind Turbine Wakes. Journal of Fluids Engineering, 124, 393-399. http://dx.doi.org/10.1115/1.1471361
- 2. Troldborg, N., Sorensen, J.N. and Mikkelsen, R. (2010) Numerical Simulations of Wake Characteristics of a Wind Turbine in Uniform Inflow. Wind Energy, 13, 86-99. http://dx.doi.org/10.1002/we.345
- 3. Troldborg, N., Larsen, G.C., Madsen, H.A., Hansen, K.S., Sorensen, J.N. and Mikkelsen, R. (2011) Numerical Simulations of Wake Interaction between Two Wind Turbines at Various Inflow Conditions. Wind Energy, 14, 859-876. http://dx.doi.org/10.1002/we.433
- 4. Shen, W.Z., Sorensen, J.N. and Mikkelsen, R. (2009) Simulation of Flow past Wind Turbines Located on a Hill by a Hybrid Actuator/Navier-Stokes Method. Proceedings of EWEC 2009, 10 pages, Marseille, France.
- 5. Schepers, J.G., Boorsma, K., Cho, T., Gomez-Iradi, S., Schaffarczyk, P., Jeromin, A., Shen, W.Z., Lutz, T., Meister, K., Stoevesandt, B., Schreck, S., Micallef, D., Pereira, R., Sant, T., Madsen, H. and Sorensen, N. (2012) Final Report of IEA Task 29, Mexnext (Phase 1): Analysis of Mexico Wind Tunnel Measurements. 2012, Published by ECN Wind Energy.
- 6. Shen, W.Z., Zhu, W.J. and Sorensen, J.N. (2012) Actuator Line/Navier-Stokes Computations for the MEXICO Rotor: Comparison with Detailed Measurements. Wind Energy, 15, 811-825. http://dx.doi.org/10.1002/we.510
- 7. Nilsson, K., Shen, W.Z., Sorensen, J.N., Breton, S.P. and Ivanell, S. (2015) Validation of the Actuator Line Method Using Near Wake Measurements of W.Z. the MEXICO Rotor. Wind Energy, 18, 449-467. http://dx.doi.org/10.1002/we.1714
- 8. Michelsen, J.A. (1992) Basis 3D—A Platform for Development of Multiblock PDE Solvers. Technical Report, AFM 92-05, Technical University of Denmark, Denmark.
- 9. Sorensen, N.N. (1995) General Purpose Flow Solver Applied to Flow over Hills. Riso-R-827-(EN), Riso National Laboratory, Roskilde, Denmark.
- 10. Shen, W.Z., Michelsen, J.A. and Sorensen, J.N. (2001) An Improved Rhie-Chow Interpolation for Un-steady Flow Computations. AIAA Journal, 39, 2406-2409. http://dx.doi.org/10.2514/2.1252
- 11. Shen, W.Z., Michelsen, J.A., Sorensen, N.N. and Sorensen, J.N. (2003) An Improved SIMPLEC Method on Collocated Grids for Steady and Unsteady Flow Computations. Numerical Heat Transfer, Part B, 43, 221-239. http://dx.doi.org/10.1080/713836202
- 12. Ta Phuoc, L. (1994) Modèles de Sous Maille Appliqués aux Ecoulements Instationnaires Décollés. Proceedings of the DRET Conference: Aérodynamique Instationnaire Turbulente-Aspects Numériques et Expérimentaux, Paris, France, DGA/DRET editors.
- 13. Shen, W.Z., Zhu, W.J. and Sorensen, J.N. (2009) Aero-Acoustic Computations for Turbulent Airfoil Flows. AIAA Journal, 47, 1518-1527. http://dx.doi.org/10.2514/1.40399
- 14. Shen, W.Z., Sorensen, J.N. and Mikkelsen, R. (2005) Tip Loss Corrections for Actuator/Navier-Stokes Computations. Journal of Solar Energy Engineering, 127, 209-213. http://dx.doi.org/10.1115/1.1850488
- 15. Shen, W.Z., Mikkelsen, R., Sorensen, J.N. and Bak, C. (2005) Tip Loss Correction for Wind Turbine Computations. Wind Energy, 8, 457-475. http://dx.doi.org/10.1002/we.153
- 16. Shen, W.Z., Zhu, W.J. and Sorensen, J.N. (2014) Study of Tip Loss Corrections Using CFD Rotor Computations. Journal of Physics: Conference Series, 555, 012094. http://dx.doi.org/10.1088/1742-6596/555/1/012094
- 17. Leishman, J.G. and Beddoes, T.S. (1989) A Semi-Empirical Model for Dynamic Stall. Journal of American Helicopter Society, 34, 3-17.
- 18. Schreck, S. (2001) The NREL Full-Scale Wind Tunnel Experiment-Introduction to the Special Issue. Wind Energy, 5, 77-84. http://dx.doi.org/10.1002/we.72