 American Journal of Plant Sciences, 2011, 2, 93-110 doi:10.4236/ajps.2011.22012 Published Online June 2011 (http://www.SciRP.org/journal/ajps) Copyright © 2011 SciRes. AJPS 93 An Extended Genetic Linkage Map for Watermelon Based on a Testcross and a BC2F2 Population Amnon Levi1, Patrick Wechter1, Laura Massey1, Lo u is a Car te r 2, Donald Hopkins3 1USDA, ARS, U.S. Vegetable Laboratory, Charleston, USA; 2Department of Genetics, University of Georgia, Athens, USA; 3University of Florida, Mid-Florida Research and Education Center, Apopka, USA. Email: amnon.levi@ars.usda.gov Received October 1st, 2010; revised February 15th, 2011; accepted February 28th, 2011. ABSTRACT There is limited genetic mapping data useful for breeding programs of watermelon. Introgression lines should be a use- ful tool for genetic studies and genetic enhancement of watermelon cultivars. In this study, we used an advanced re- combinant population (BC2F2) to identify and map chro mosoma l segments of the wild watermelon Citru llus lan a tus var. citroides that were inco rporated in the genome of the watermelon cultivar Crimson Sweet (Citrullus lana tus var. lana- tus). An advanced recombinant population (BC2F2) was constructed using a United States Plant Introduction (PI) 494817 (C. lana tus var. citroides) (known to have moderate resistance to bacterial fruit blotch) as a donor parent, and the elite watermelon cultivar Crimson Sweet (C. lanatus var. lan atus) as the recurrent parent. The genetic linkage map consists of 272 markers, including 89 sequence-related amp lified polymorphism (SRAP), 72 targeted region amplifica - tion polymorphism (TRAP), and 111 high frequency oligonucleotide-targeting active gene (HFO-TAG) markers. The 272 markers were assembled into 51 linkage groups, covering a total genetic distance of 2162 cM, with an average genetic distance of 7.9 cM between markers. Also, we expended the genetic linkage map for watermelon derived from a testcross population {Griffin 14113 [C. lanatus var. citroide (L.H. Bailey) Mansf.] x watermelon cultivar New Hamp- shire Midget (C. lanatus var. lanatu s)} x PI 386015 [C. colocynth is (L.) Schrad.]. The genetic linkage map based on the test cross population consists of 558 markers that cover a genetic distance of 2760.8 cM. This linkage map consists of 41 linkage group, includi ng 10 large linkage groups (ranging from102 - 240 cM), nine intermediate size linkage groups (ranging from 62 - 93 cM), and 22 small linkage groups (rang ing from 2 - 5 6 cM). Comparative mapping between these two linkage maps identified high consensus in 25 HFO-TAG markers and one TRAP marker that represent 8 linkage groups in the BC2F2 population and 9 linkage groups in the testcross population. These results indicate that HFO-TAG markers should be useful in comparative mapping. The extended genetic maps and the genetic population in this study should be useful in breeding programs using marker assisted selection and should serve as a platform for further de- velopment of introgression lines for watermelon. Keywords: Testcross, Recombinant Population, SRAP, TRAP, HFO-TAG, DNA Markers, Genetic Diversity, Comparative Ma pping 1. Introduction Watermelon is an important vegetable crop worldwide. It belongs to the xerophytes genus Citrullus Schrad. ex Eckl. et Zeyh. Diverse populations of this genus grow freely in southern Africa which is considered to be its centre of origin. The genus Citrullus comprises four known diploid (n = 11) species. Among them is the annual Citrullus lanatus (Thunb.) Matsum et Nakai. This species is in- digenous to the arid sandy regions of southern Africa [1]. It is cons ide red t he pr og enit or of the red, s weet cultivated watermelon (C. lanatus var. lanatus) and the Tsamma watermelon (C. lanatus var. citroides) (also known as th e citron or cow melon) [2,3]. Previous studies [4] indicated that North American heirloom cultivars share a narrow genetic base, while a wide genetic distance exists between the heirlooms (C. lanatus var. lanatus) and the related subspecies C. lana- tus var. citroides, sharing less than 60% of their alleles [5]. A major objective of the watermelon industry is to develop breeding lines and cultivars with enhanced re-  An Extended Genetic Linkage Map for Watermelon Based on a Testcross and a BCF Population 94 2 2 sistance to diseases and pests. A number of PIs of C. lanatus var. citroides have been shown to contain resis- tance to major diseases and pests of watermelon, includ- ing resistance to gummy stem blight [6], Fusarium wilt [7], and root-knot nematodes [8]. Also, many of the C. lanatus var. citroides PIs have more plant vigor and a larger crown size and plant density than watermelon cul- tivars. Although the C. lanatus var. citroides fruits have white or green flesh and thick rind, they shou ld serv e as a useful source for alleles that have been lost during many years of domestication of the red, sweet cultivated wa- termelon. It is easy to make crosses between watermelon cultivars (C. lanatus var. lanatus) and C. lanatus var. citroides PIs. However, introgression of favorable alleles from the wild watermelon into cultivars is difficult be- cause many favorable alleles are closely linked to unde- sired fruit traits. Because of this wide genetic distance[4,5,9], F2 ge- netic populations derived from crosses between water- melon cultivars (C. lanatus var. lanatus) and C. lanatus var. citroides PIs showed strong segregation distortion for most alleles [9-13]. Segregation distortion is common in wide crosses due to differences in chromosome struc- ture (meiotic drive) [11], and may produce quasi (non- representative) genetic linkage among molecular-based markers [12-14]. Thus, classical genetic models in F2 populations derived from a cross between C. lanatus var. citroides PIs and cultivated watermelon (C. lanatus var. lanatus) may need further evaluation because of possible segregation distor tion for most alleles. The genetic linkage maps that we have constructed for waterm elon are deri ved from a backcross [ 9] or a t estcross population [12,13]. These maps have been useful in iden- tifying and mapping disease or pest resistance genes [15-17]. Howe ver, because of the distorted segregation for a large number of alleles, they have limited use in con- ventional breeding programs and in identifying quantita- tive trait loci (QTLs). We have recently begun a study to identify markers for resistance to bacterial fruit blotch, an important seed- borne bacterial disease in watermelon. Bacterial fruit blotch, caused by the phytopathogenic bacterium Acido- vorax avenae subsp. citrulli has been documented in many countries world-wide. This seed-borne pathogen can infect plants at any growth stage, but is typically seen at the seedling stage or at the mature fruit stage [18]. The first reported outbreak in the United States was in a commercial watermelon field in Florida in 1989 [18,19]. In addition to watermelon, this pathogen can cause se- vere disease on most cucurbits [18,20]. In recent years there have been several reports of new outbreaks of bac- terial fruit blotch in the U.S., many of which are associ- ated with watermelon [21]. Only limited chemical options exist fo r addressing this disease, none of which are very effective [20,21]. With such limitations in management of this disease, a source of genetic resistance (currently no cucurbit cultivar has resistance to this disease) in watermelon would be ex- tremely beneficial to th e industry. A screen of over 1,300 Citrullus spp. and Praecitrullus fistulosa accessions from the U.S. germplasm collection yielded 5 PIs with moder- ate levels of resistance to this disease. One of these PIs was a C. lanat us va r. citroides PI 494817 [22]. To date, PI 494817 is the only known source of resistance to this disease. Studies indicate that this resistance might be a result of a complex mode of inheritance that involved several genes [23]. In order to better understand this re- sistance at the genetic level, we developed a F2 population of C. lanatus var. citroides PI 494817 × C. lanatus var. lanatus watermelon cultivar Crimson Sweet for a map- ping and marker study. The results of that study were inconclusive due to the wide genetic distance between PI 494817 and Crimson Sweet [4,5,9] and possibly due to distorted segregation in such wide crosses [13]. Further germplasm evaluation and genetic studies are needed to determine the mode of inheritance of resistance to bacte- rial fruit blotch in watermelon. To overcome these limitations in genetic mapping we generated advanced recombinant populations (BC2F2 or BC3F2) for mapping of genetic regions that are being incorporated from C. lanatus var. citroides PIs into wa- termelon cultivars. These populations should exhibit normal segregation ratios for a large number of markers, as was suggested in genetic improvement studies of bar- ley [24 ] . These advan ced recombinant populations can be useful for genetic mapping and the identification of chro- mosomal segments that were introgressed from the ge- nome of a C. lanatus var. citroides PI into the genome of a watermelon cultivar. Eshed and Za mir [25, 26] sh owed that introgressi on line populations can be useful for genetic mapping of quanti- tative trait loci (QTLs) and for enhancing elite varieties with exotic alleles that were lost during domestication. They proposed to develop introgression lines (ILs) by repeated backcrossing, thus introgressing chromosomal segments from an exotic wild accession into the back- ground of an el it e variet y (rec urrent pare nt) . The result ing introgression lines should facilitate the dissection of quantitative traits into Mendelian factors [27]. Sets of introgression lines have been developed for different crops, including tomato [28], lettuce [29], wheat [30], soybean [31], and Brassica oleracea [32]. However, there is no report on the development of introgression lines in wa- termelon. Our long term objective is to expand the genetic d iver- sity in cultivated watermelon by establishing a set of lines Copyright © 2011 SciRes. AJPS  An Extended Genetic Linkage Map for Watermelon Based on a Testcross and a BCF Population95 2 2 into which chromosomal segments containing useful disease resistance from C. la natus var. citroides have been introgressed into the genome of watermelon cultivars (C. lanatus var. lanatus). These populations will be used in future studies of both phenotypic traits associated with the wild watermelons as well as with disease and pest resistance transferred from the wild watermelons into watermelon cultivars. In this study, we examined 1) an advanced recom binant genetic population (BC2F2) for genetic mapping of wa- termelon, 2) if chromosomal segments of C. la natus var. citroides PI 494817 (known to have moderate resistance to bacterial fruit blotch) [20,22,23] that were incorpo- rated into the genomic background of the watermelon cultivar Crimson Sweet (C. lanatus var. lanatus) could be mapped and be used for construction of introgression lines. Also, we expanded the genetic linkage map for water- melon derived from a testcross population {plant acces- sion Griffin 14113 [C. lanatus var. citroide (L. H. Bailey) Mansf.] x watermelon cultivar New Hampshire Midget (C. lanatus var. lanatus)} x PI 386015 [C. colocynthis (L.) Schrad.] [12,13] and performed comparative map- ping between the two maps using high frequency oli- gonucleotide-targ eting active genes (HFO-TAG) markers [33] and targeted region amplified polymorphism (TRAP) markers [34]. 2. Materials and Methods Watermelon cv. Crimson Sweet and plant introduction PI 494817 were used to create a BC2F2 population at the Mid-Florida Research and Education Center, Apopka, FL. Hopkins and Thompson [22] determined that PI 494817 (C. lanatus var. citroides) contains resistance to bacterial fruit blotch (BFB). The most resistant PI 494817 plant was self-pollinated and the progen y were re-evaluated for resistance to BFB in two successive generations. An F3 plant containing resistance to BFB was selected and was crossed with ‘Crimson Sweet’, from which an F2 p opula- tion was produced, progen y were evaluated and the most resistant plant was backcrossed to the cultivar. A BC1F2 population was produced by self-pollination of one plant and was evaluated for BFB resistance. The most resistant plant was selected and ba ckcrossed wi th ‘Crims on Sweet’. A similar scheme was applied in subsequent generations to produce BC2F2 and BC3F2 populations (as shown in Figure 1). Plant material: Young leaves (10 g) were collected from each BC2F2 plant, and st ored at –80˚C. Isolation of DNA: To avoid co-isolation of polysac- charides, polyphenols, and other secondary compounds that damage DNA, we used an improved procedure for isolation of DNA from young leaves of watermelon [35]. SRAP and TRAP analysis: Ninety-eight SRAP primer Figure 1. Breeding sche me for producing the BC2F2 popula- tion used for genetic mapping in this study. combinations (Table 1) were tested with the donor par- ent PI 494817, the recurrent parent ‘Crimson Sweet’ and the 94 BC2F2 progeny. Fr agment analysis was performed on capillary system CEQ8800 DNA Genetic Fragment Analysis System (Beckman Coulter, Fullerton, CA). The forward primers were labeled with one of 3 WellRED dyes (D2, D3, or D4) (Proligo, Boulder, CO). To confirm correct dye balance, the amount of dye-labeled primer added to the PCR cocktail was optimized for each primer. Each 10 L reaction contained 1X PCR buffer (Promega, Madison, Wis.), 2.5 mM MgCl2, 200 M dNTPs (Sigma, St. Louis, MO), 30 ng of reverse primer (IDT, Coraville, IA), 0.25 U Taq DNA polymerase (Promega, Madison, Wis.) and 25 ng of DNA. In addition, WellRED dye- abeled forward primers were added in the following amounts: 0.1 M for a D4 primer; 0.2 M for a D3 primer; or 0.2 M for a D2 primer. Samples were sub- jected to the following thermal profile for amplification in a PCR thermocycler (PTC 200, MJ Research): 5 min of DNA denaturizing at 94˚C, five cycles of three steps: 1 min of denaturing at 94˚C, 1 min of annealing at 35˚C and 2 min of elongation at 72˚C. In the following 30 cy- cles the annealing temperature was increased to 50˚C, with a final elongation step of 5 min at 72˚C [13,33]. The PCR products were analyzed using the CEQ8800 (Beckman Coulter, Fullerton, CA ) by pooling 0.35 L of the D4 reaction, 0.45 L of the D3 reaction, 0.55 L of the D2 reaction, 0.28 L of D1 size standard, and 30 L of de-ionized formamide in a 96 well PCR plate. Sam- ples were run on the CEQ8800 using the fragment 3 pa- rameters and analyzed using the built-in fragment analy- sis software provided with the system. Fragments that ranged in size of 75 - 400 bp could be scored with high Copyright © 2011 SciRes. AJPS  An Extended Genetic Linkage Map for Watermelon Based on a Testcross and a BC2F2 Population Copyright © 2011 SciRes. AJPS 96 confidence. HFO-TAG Analysis: Thirty-six HFO-TAG primers (Ta- ble 2) were used in this study were previously described [33]. Table 1. Sequence related amplified poly mor phism (SRAP) forward (F P) and reverse primers (RP) use d in this study. FLP Primer sequence 5' to 3' RUP Primer sequence 5' to 3' Me1 TGAGTCCAAACCGGATA ba1 GTCGAGCTGCCAATTATA Me2 TGAGTCCAAACCGGAGC ba2 GTCGAGCTGCCAATTAAT Me3 TGAGTCCAAACCGGAAT ba3 GTCGAGCTGCCAATTTGC Me4 TGAGTCCAAACCGGACC ba4 GTCGAGCTGCCAATTTTT Me5 TGAGTCCAAACCGGAAG ba5 GTCGAGCTGCCAATTAAA Ab1 AGTGATTCAACCGGAGA ba6 GTCGAGCTGCCAATTAAC Ab2 AGTGATTCAACCGGATA ba7 GTCGAGCTGCCAATTAAG Ab3 AGTGATTCAACCGGAGC ba8 GTCGAGCTGCCAATTATT Wm1 ATTTTAGCAGCCGGGTA ba9 GTCGAGCTGCCAATTATC Wm2 ATTTTAGCAGCCGGAGC ba10 GTCGAGCTGCCAATTATG Wm3 ATTTTAGCAGCCGGGTT ba11 GTCGAGCTGCCAATTTGA Wm4 ATTTTAGCAGCCGGGCA ba12 GTCGAGCTGCCAATTTGT Wm5 ATTTTAGCAGCCGGGCA em1 GACTGCGTACGAATTAAT Cl1 ATAGATACGCCCGGATA em2 GACTGCGTACGAATTTGC Cl2 ATAGATACGCCCGGAGC em3 GACTGCGTACGAATTGAC Cl3 ATAGATACGCCCGGACA em4 GACTGCGTACGAATTTGA Cl4 ATAGATACGCCCGGATG em5 GACTGCGTACGAATTAAC Cl5 ATAGATACGCCCGGAGT em6 GACTGCGTACGAATTGCA mw1 GGAGG TCGAAAATTGTA mw2 GGAGGTCGAAAATTGTC mw3 GGAGGTCGAAAATTGTT mw4 GGAGGTCGAAAATTGAG mw5 GGAGGTCGAAAATTGCT lc1 CCATCTAGGCAATTCGA lc2 CCATCTAGGCAATTGGT lc3 CCATCTAGGCAATTTGG lc4 CCATCTAGGCAATTAGG lc5 CCATCTAGGCAATTTGC nw1 ACAATGGCGGAATTGGT nw2 ACAATGGCGGAATTCGA nw3 ACAATGGCGGAATTTGG nw4 ACAATGGCGGAATTAGG nw5 ACAATGGCGGAATTTGC aw1 TGAAAGAGGGAATTGGC aw2 TGAAAGAGGGAATTGGG aw3 TGAAAGAGGGAATTCGA aw4 TGAAAGAGGGAATTGGT aw5 TGAAAGAGGGAATTCGG se1 GAGAGAGAGAAATTGGC se2 GAGAGAGAGAAATTCCG se3 GAGAGAGAGAAATTGCG re1 CTCTCTCTCTAATTGGG re2 CTCTCTCTCTAATTGGC re3 CTCTCTCTCTAATTGCC  An Extended Genetic Linkage Map for Watermelon Based on a Testcross and a BCF Population97 2 2 Table 2. The 36 HFO-TAG (high frequency oligonucleotides-targeting active genes) primers used in this study. The number of nucleotide bases for each primer (B), the GC content (0.875 = 87.5% and 1 = 100%) for each primer, the melting tempera- ture (Tm) (˚C), and the annealing temperature (Ta) (˚C) used in PCR. In addition, the total number of fragments (TF) that were produced by each of the HFO-TAG primers and the number of fragments (MF) that could be mapped with BC2F2 population. Tm Ta TF MF Primer Oligos B (no.) GC Content (˚C) (˚C) (no.) (no.) HFO-14 GCGGCGGA 8 0.875 38.4 45 6 4 HFO-20 GGCGGCGA 8 0.875 38.4 45 9 9 HFO-23 ACGGCGGC 8 0.875 39.1 45 16 12 HFO-31 CGCCGCCA 8 0.875 39.1 45 5 3 HFO-37 CGGCGCCG 8 1 40.9 45 1 1 HFO-44 CGCCGGCG 8 1 40.9 45 5 5 HFO-49 GCGGCGGT 8 0.875 39.1 45 7 2 HFO-50 ACCGCCGC 8 0.875 39.1 45 2 1 HFO-55 CCGCCGCT 8 0.875 38.3 45 2 2 HFO-56 AGCGGCGG 8 0.875 38.3 45 8 7 HFO-60 TCGGCGGC 8 0.875 38.4 45 10 7 HFO-61 GCCGCCGA 8 0.875 38.4 45 1 1 HFO-66 CCGCCGGA 8 0.875 36.7 45 4 1 HFO-67 GCCGCTGC 8 0.875 36.8 45 9 4 HFO-68 GCAGCGGC 8 0.875 36.8 45 3 0 HFO-71 CCACCGCCG 9 0.889 42.4 45 5 3 HFO-72 CGGCGGTGG 9 0.889 42.4 45 2 1 HFO-75 CCGCCGGC 8 1 41.9 45 2 0 HFO-76 GCCGGCGG 8 1 41.9 45 1 1 HFO-77 CCTCCGCCG 9 0.889 41.2 45 3 1 HFO-78 CGGCGGAGG 9 0.889 41.2 45 5 3 HFO-100 CGGCGGCT 8 0.875 38.3 45 1 0 HFO-105 AGCCGCCG 8 0.875 38.3 45 10 3 HFO-117 TGCGGCGG 8 0.875 39.1 45 4 2 HFO-116 CCGCCGCA 8 0.875 39.1 45 2 2 HFO-120 AGGCGGCG 8 0.875 38.3 45 10 9 HFO-132 GGCCGCCG 8 1 41.9 45 4 2 HFO-152 TCCACCGCC 9 0.778 38.2 45 6 3 HFO-153 GGCGGTGGA 9 0.778 38.2 45 3 2 HFO-154 TGCCGCCG 8 0.875 39.1 45 9 3 HFO-158 CGGCGGCA 8 0.875 39.1 45 4 3 HFO-175 CCACCGCCA 9 0.778 38.9 45 3 2 HFO-179 ACGCCGCC 8 0.875 39.1 45 6 1 HFO-182 GGCGGCGT 8 0.875 39.1 45 13 7 HFO-184 CGGCAGCG 8 0.875 36.3 45 5 2 HFO-187 GGGCGGCG 8 1 41.9 45 9 8 Copyright © 2011 SciRes. AJPS 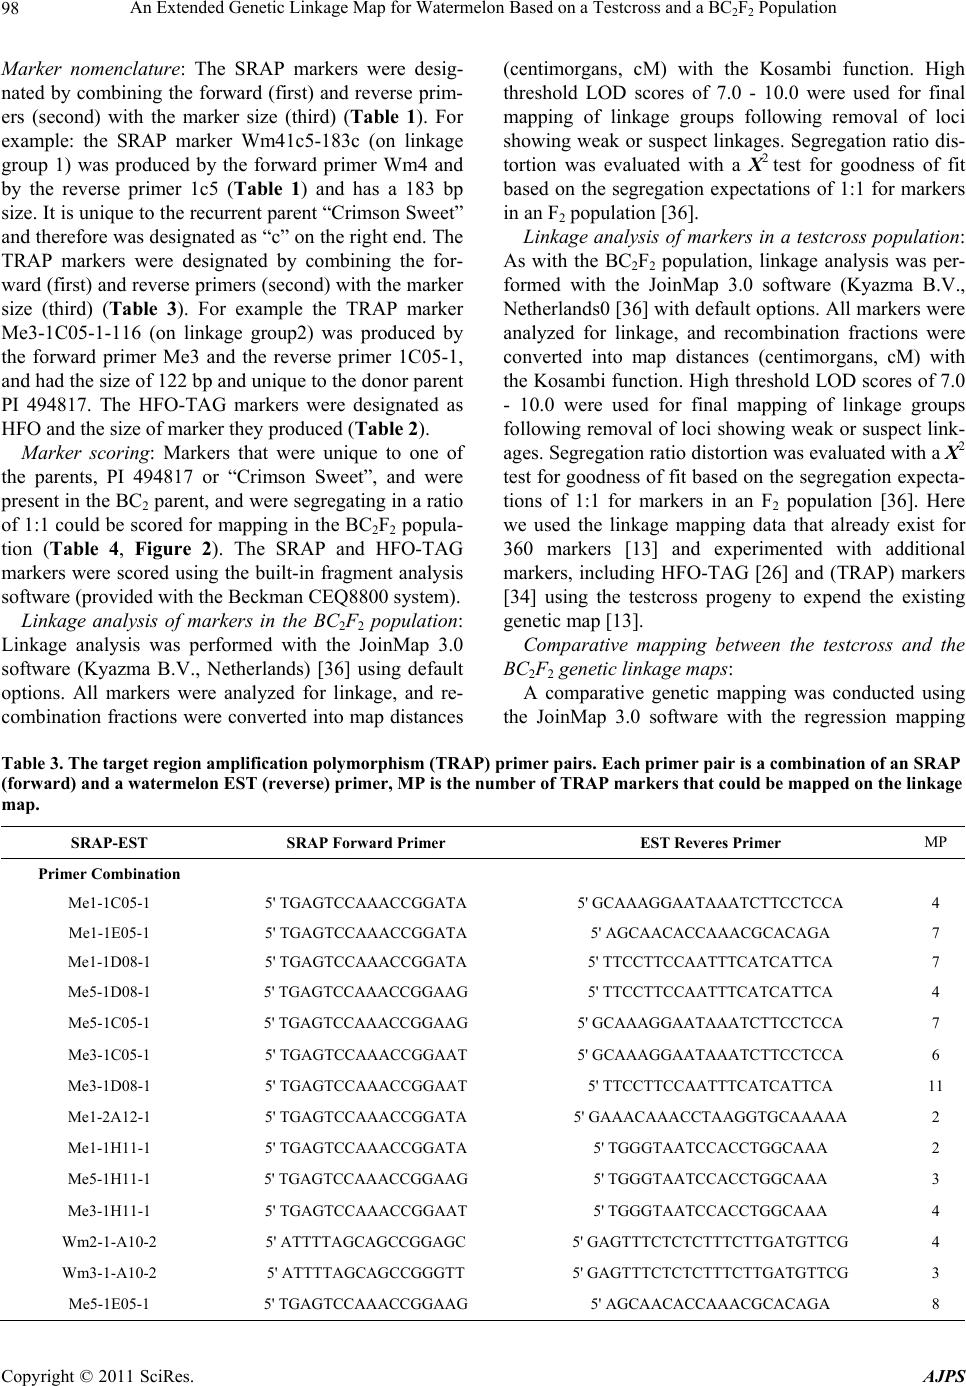 An Extended Genetic Linkage Map for Watermelon Based on a Testcross and a BC2F2 Population Copyright © 2011 SciRes. AJPS 98 Marker nomenclature: The SRAP markers were desig- nated by combining the forward (first) and reverse prim- ers (second) with the marker size (third) (Table 1). For example: the SRAP marker Wm41c5-183c (on linkage group 1) was produced by the forward primer Wm4 and by the reverse primer 1c5 (Table 1) and has a 183 bp size. It is unique to the recurrent parent “Crimson Sweet” and therefore was designated as “c” on the right end. The TRAP markers were designated by combining the for- ward (first) and reverse pr imers (second) with the marker size (third) (Table 3). For example the TRAP marker Me3-1C05-1-116 (on linkage group2) was produced by the forward primer Me3 and the reverse primer 1C05-1, and had the size of 122 bp and unique to the donor parent PI 494817. The HFO-TAG markers were designated as HFO and the size of marker they produced (Table 2). Marker scoring: Markers that were unique to one of the parents, PI 494817 or “Crimson Sweet”, and were present in the BC2 parent, and were segregating in a ratio of 1:1 could be scored for mapping in the BC2F2 popula- tion (Table 4, Figure 2). The SRAP and HFO-TAG markers were scored using the built-in fragment analysis software (provided with the Beckman CEQ8800 system). Linkage analysis of markers in the BC2F2 population: Linkage analysis was performed with the JoinMap 3.0 software (Kyazma B.V., Netherlands) [36] using default options. All markers were analyzed for linkage, and re- combination fractions were converted into map distances (centimorgans, cM) with the Kosambi function. High threshold LOD scores of 7.0 - 10.0 were used for final mapping of linkage groups following removal of loci showing weak or suspect linkages. Segregation ratio dis- tortion was evaluated with a X2 test for goodness of fit based on the segregation expectations of 1:1 for markers in an F2 popula tion [36]. Linkage analysis of markers in a testcross population: As with the BC2F2 population, linkage analysis was per- formed with the JoinMap 3.0 software (Kyazma B.V., Netherlands0 [36] with default options. All markers were analyzed for linkage, and recombination fractions were converted into map distances (centimorgans, cM) with the Kosambi function. High threshold LOD scores of 7.0 - 10.0 were used for final mapping of linkage groups following removal of loci showing weak or suspect link- ages. Segregation ratio distortion was evaluated with a X2 test for goodness of fit based on the segregation expecta- tions of 1:1 for markers in an F2 population [36]. Here we used the linkage mapping data that already exist for 360 markers [13] and experimented with additional markers, including HFO-TAG [26] and (TRAP) markers [34] using the testcross progeny to expend the existing genetic map [13]. Comparative mapping between the testcross and the BC2F2 genetic linkage maps: A comparative genetic mapping was conducted using the JoinMap 3.0 software with the regression mapping Table 3. The target region amplification polymorphism (TRAP) primer pairs. Each primer pair is a combination of an SRAP (forward) and a watermelon EST (reverse) primer, MP is the number of TRAP markers that could be mapped on the linkage map. SRAP-EST SRAP Forward Primer EST Reveres Primer MP Primer Combination Me1-1C05-1 5' TGAGTCCAAACCGGATA 5' GCAAAGGAATAAATCTTCCTCCA 4 Me1-1E05-1 5' TGAGTCCAAACCGGATA 5' AGCAACACCAAACGCACAGA 7 Me1-1D08-1 5' TGAGTCCAAACCGGATA 5' TTCCTTCCAATTTCATCATTCA 7 Me5-1D08-1 5' TGAGTCCAAACCGGAAG 5' TTCCTTCCAATTTCATCATTCA 4 Me5-1C05-1 5' TGAGTCCAAACCGGAAG 5' GCAAAGGAATAAATCTTCCTCCA 7 Me3-1C05-1 5' TGAGTCCAAACCGGAAT 5' GCAAAGGAATAAATCTTCCTCCA 6 Me3-1D08-1 5' TGAGTCCAAACCGGAAT 5' TTCCTTCCAATTTCATCATTCA 11 Me1-2A12-1 5' TGAGTCCAAACCGGATA 5' GAAACAAACCTAAGGTGCAAAAA 2 Me1-1H11-1 5' TGAGTCCAAACCGGATA 5' TGGGTAATCCACCTGGCAAA 2 Me5-1H11-1 5' TGAGTCCAAACCGGAAG 5' TGGGTAATCCACCTGGCAAA 3 Me3-1H11-1 5' TGAGTCCAAACCGGAAT 5' TGGGTAATCCACCTGGCAAA 4 Wm2-1-A10-2 5' ATTTTAGCAGCCGGAGC 5' GAGTTTCTCTCTTTCTTGATGTTCG 4 Wm3-1-A10-2 5' ATTTTAGCAGCCGGGTT 5' GAGTTTCTCTCTTTCTTGATGTTCG 3 Me5-1E05-1 5' TGAGTCCAAACCGGAAG 5' AGCAACACCAAACGCACAGA 8 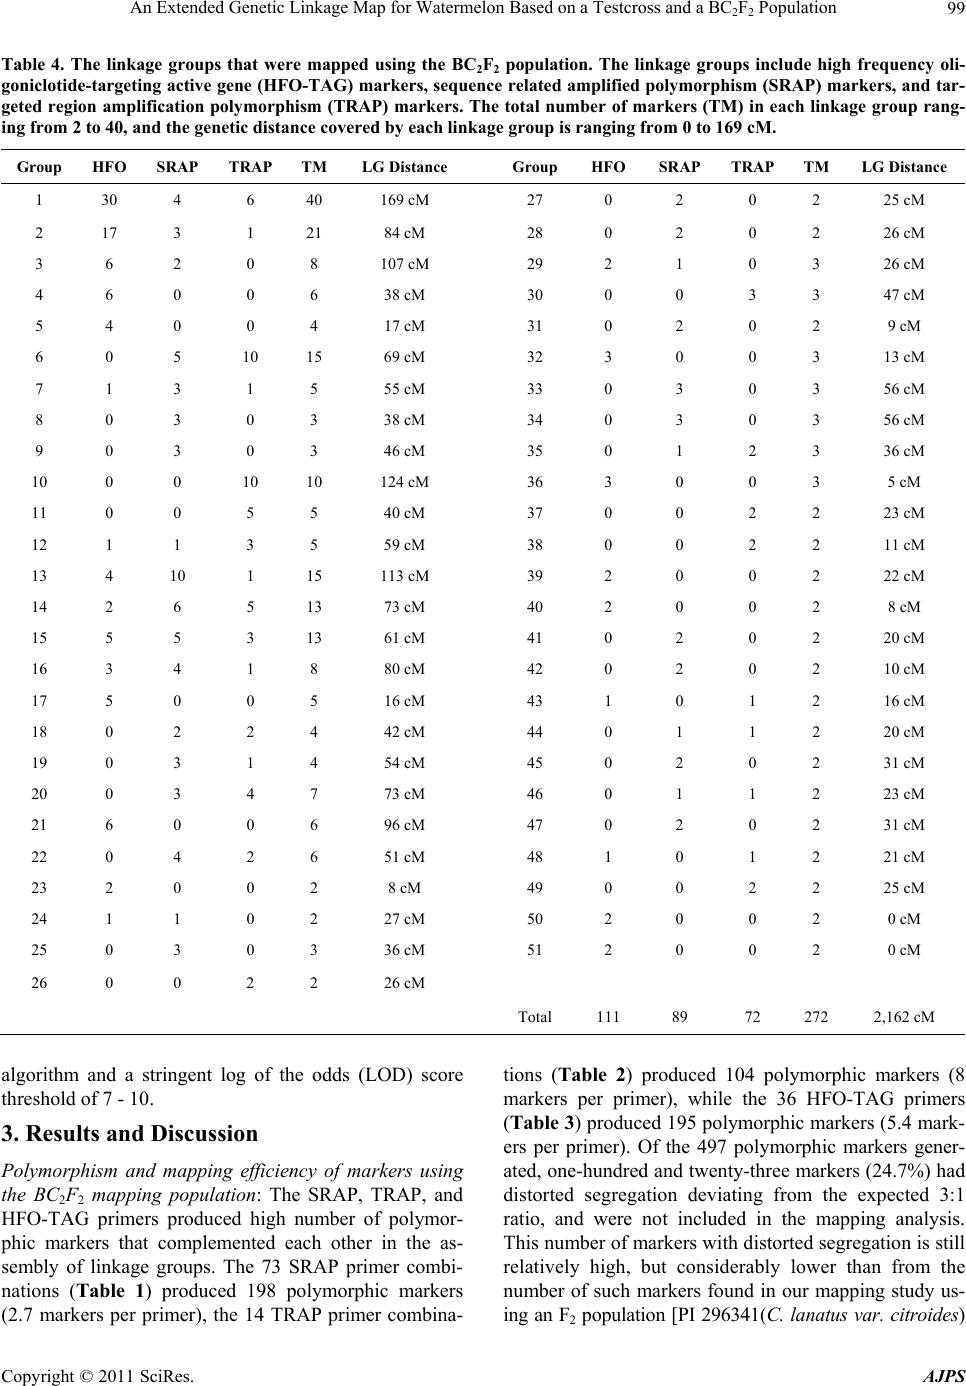 An Extended Genetic Linkage Map for Watermelon Based on a Testcross and a BCF Population99 2 2 Table 4. The linkage groups that were mapped using the BC2F2 population. The linkage groups include high frequency oli- goniclotide-targeting active gene (HFO-TAG) markers, sequence related amplified polymorphism (SRAP) markers, and tar- geted region amplification polymorphism (TRAP) markers. The total number of markers (TM) in each linkage group rang- ing from 2 to 40, and the genetic distance covered by each linkage group is ranging from 0 to 169 cM. Group HFO SRAP TRAP TM LG Distance GroupHFO SRAPTRAP TM LG Distance 1 30 4 6 40 169 cM 27 0 2 0 2 25 cM 2 17 3 1 21 84 cM 28 0 2 0 2 26 cM 3 6 2 0 8 107 cM 29 2 1 0 3 26 cM 4 6 0 0 6 38 cM 30 0 0 3 3 47 cM 5 4 0 0 4 17 cM 31 0 2 0 2 9 cM 6 0 5 10 15 69 cM 32 3 0 0 3 13 cM 7 1 3 1 5 55 cM 33 0 3 0 3 56 cM 8 0 3 0 3 38 cM 34 0 3 0 3 56 cM 9 0 3 0 3 46 cM 35 0 1 2 3 36 cM 10 0 0 10 10 124 cM 36 3 0 0 3 5 cM 11 0 0 5 5 40 cM 37 0 0 2 2 23 cM 12 1 1 3 5 59 cM 38 0 0 2 2 11 cM 13 4 10 1 15 113 cM 39 2 0 0 2 22 cM 14 2 6 5 13 73 cM 40 2 0 0 2 8 cM 15 5 5 3 13 61 cM 41 0 2 0 2 20 cM 16 3 4 1 8 80 cM 42 0 2 0 2 10 cM 17 5 0 0 5 16 cM 43 1 0 1 2 16 cM 18 0 2 2 4 42 cM 44 0 1 1 2 20 cM 19 0 3 1 4 54 cM 45 0 2 0 2 31 cM 20 0 3 4 7 73 cM 46 0 1 1 2 23 cM 21 6 0 0 6 96 cM 47 0 2 0 2 31 cM 22 0 4 2 6 51 cM 48 1 0 1 2 21 cM 23 2 0 0 2 8 cM 49 0 0 2 2 25 cM 24 1 1 0 2 27 cM 50 2 0 0 2 0 cM 25 0 3 0 3 36 cM 51 2 0 0 2 0 cM 26 0 0 2 2 26 cM Total 111 89 72 272 2,162 cM algorithm and a stringent log of the odds (LOD) score threshold of 7 - 10. 3. Results and Discussion Polymorphism and mapping efficiency of markers using the BC2F2 mapping population: The SRAP, TRAP, and HFO-TAG primers produced high number of polymor- phic markers that complemented each other in the as- sembly of linkage groups. The 73 SRAP primer combi- nations (Table 1) produced 198 polymorphic markers (2.7 markers per primer), the 14 TRAP primer combina- tions (Table 2) produced 104 polymorphic markers (8 markers per primer), while the 36 HFO-TAG primers (Table 3) produced 195 polymorphic markers (5.4 mark- ers per primer). Of the 497 polymorphic markers gener- ated, one-hundred and twenty-thr ee markers (24.7%) had distorted segregation deviating from the expected 3:1 ratio, and were not included in the mapping analysis. This number of markers with distorted segregation is still relatively high, but considerably lower than from the number of such markers found in our mapping study us- ing an F2 population [PI 296341(C. lanatus var. citroides) Copyright © 2011 SciRes. AJPS 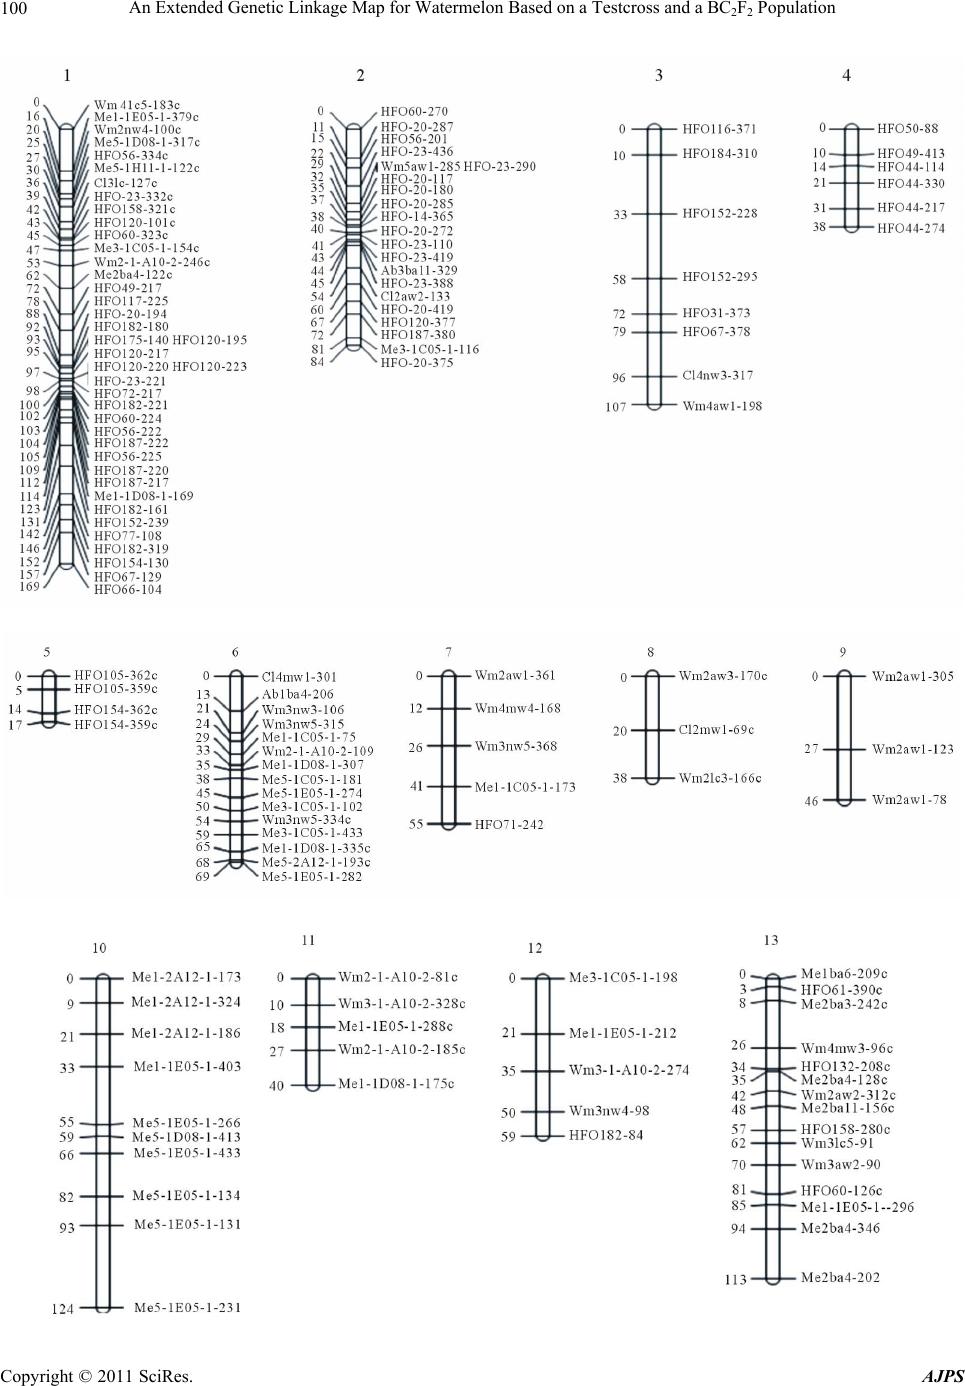 An Extended Genetic Linkage Map for Watermelon Based on a Testcross and a BCF Population 100 2 2 Copyright © 2011 SciRes. AJPS 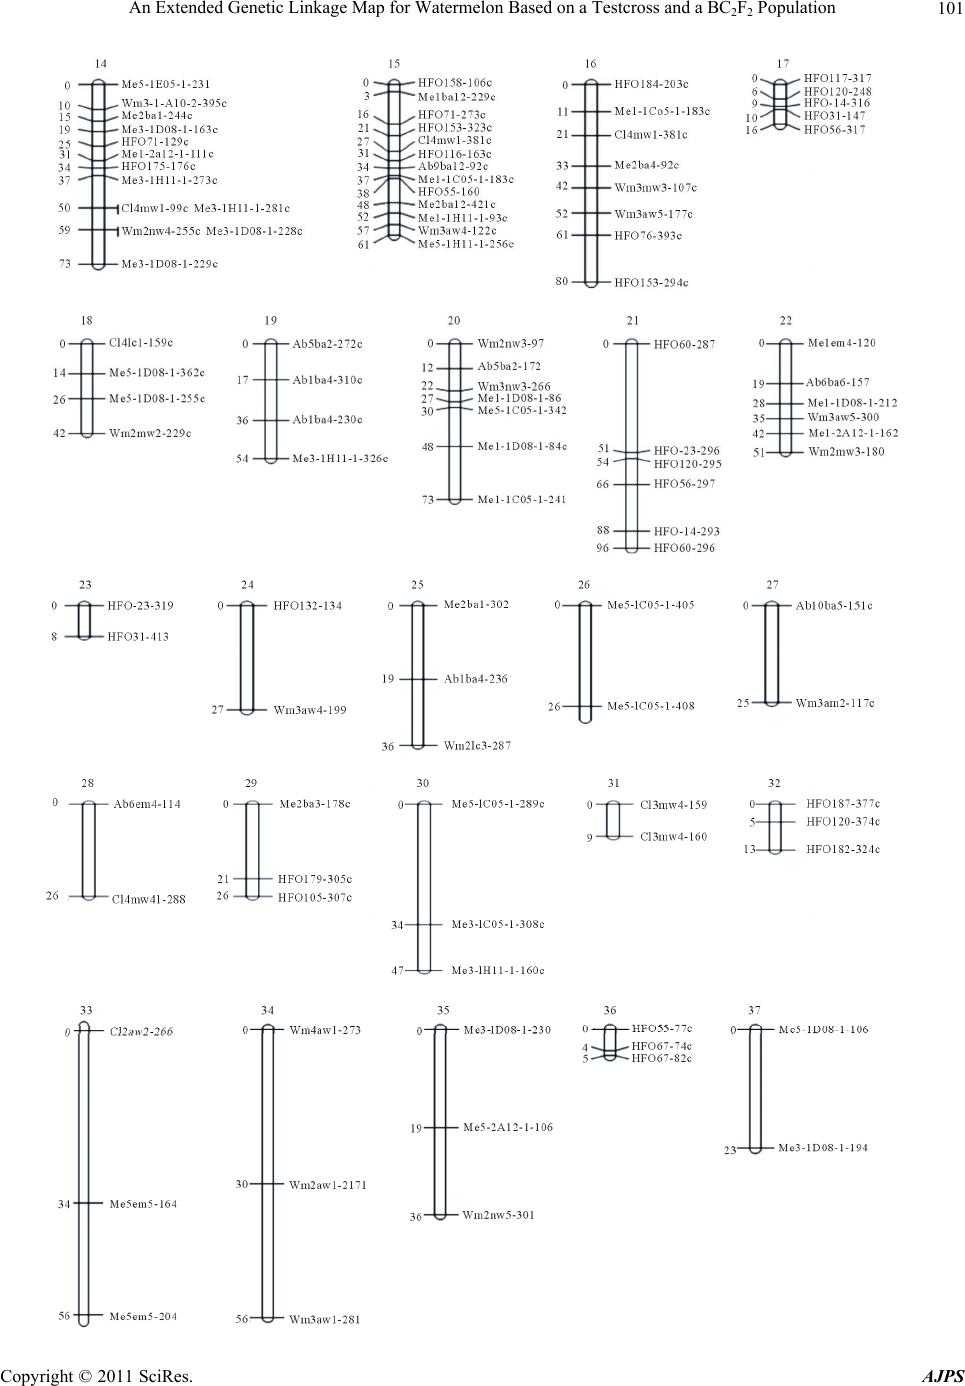 An Extended Genetic Linkage Map for Watermelon Based on a Testcross and a BCF Population101 2 2 Copyright © 2011 SciRes. AJPS 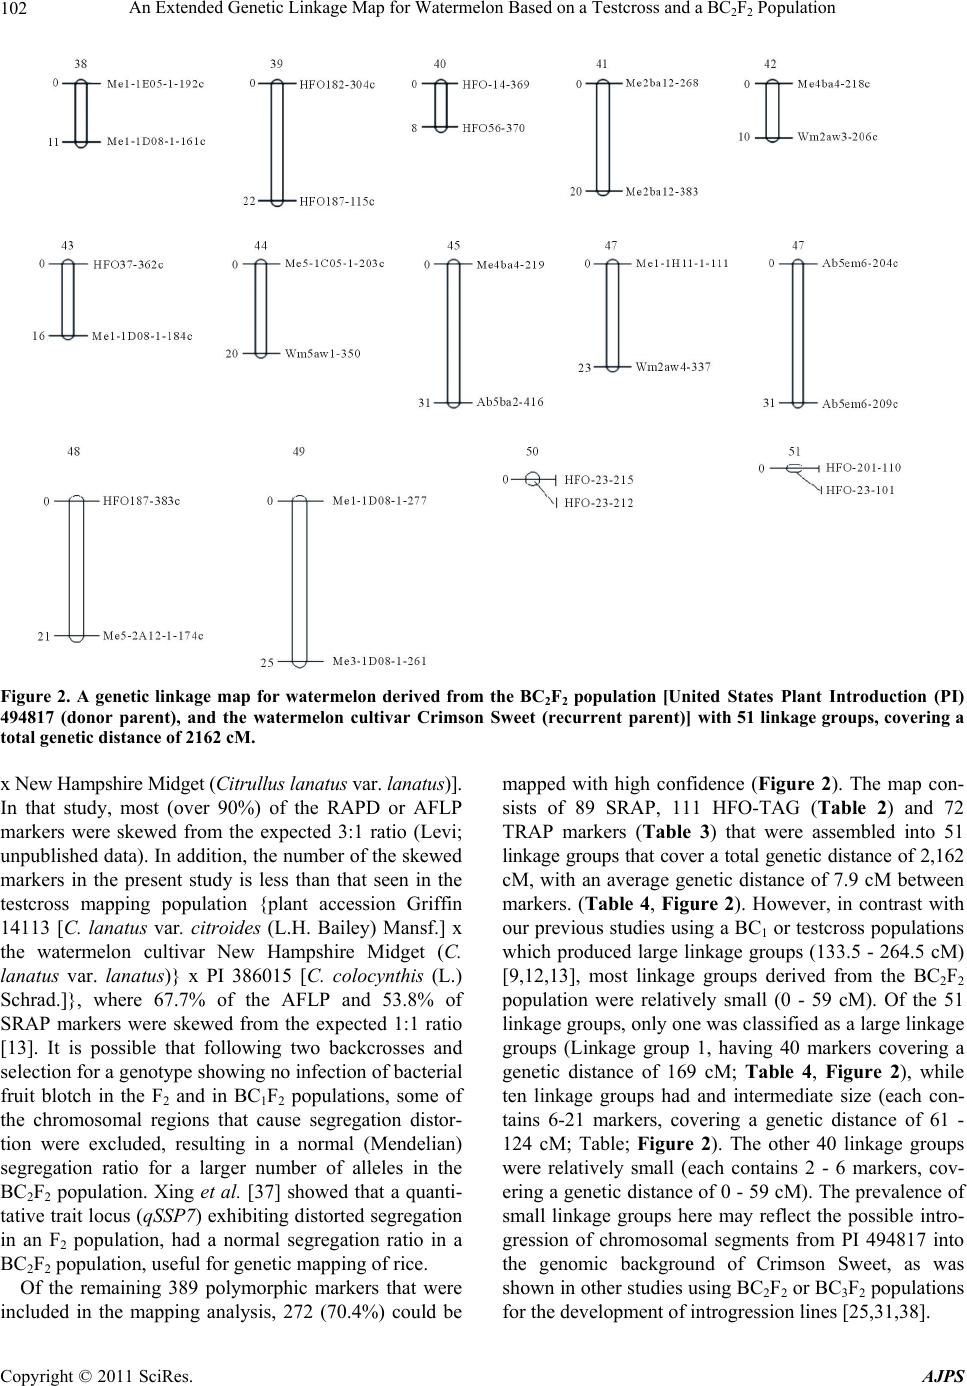 An Extended Genetic Linkage Map for Watermelon Based on a Testcross and a BC2F2 Population Copyright © 2011 SciRes. AJPS 102 Figure 2. A genetic linkage map for watermelon derived from the BC2F2 population [United States Plant Introduction (PI) 494817 (donor parent), and the watermelon cultivar Crimson Sweet (recurrent parent)] with 51 linkage groups, covering a total genetic distance of 2162 cM. x New Hampshire Midget (Citrull us l anat us var. lanatus)]. In that study, most (over 90%) of the RAPD or AFLP markers were skewed from the expected 3:1 ratio (Levi; unpublished d ata). In addition, the nu mber of the skewed markers in the present study is less than that seen in the testcross mapping population {plant accession Griffin 14113 [C. lanatus var. citroides (L.H. Bailey) Mansf.] x the watermelon cultivar New Hampshire Midget (C. lanatus var. lanatus)} x PI 386015 [C. colocynthis (L.) Schrad.]}, where 67.7% of the AFLP and 53.8% of SRAP markers were skewed from the expected 1:1 ratio [13]. It is possible that following two backcrosses and selection for a genotype showing no infection of bacterial fruit blotch in the F2 and in BC1F2 populations, some of the chromosomal regions that cause segregation distor- tion were excluded, resulting in a normal (Mendelian) segregation ratio for a larger number of alleles in the BC2F2 population. Xing et al. [37] showed that a quanti- tative trait locus (qSSP7) exhibiting distorted segregation in an F2 population, had a normal segregation ratio in a BC2F2 population, useful for genetic mapping of rice. Of the remaining 389 polymorphic markers that were included in the mapping analysis, 272 (70.4%) could be mapped with high confidence (Figure 2). The map con- sists of 89 SRAP, 111 HFO-TAG (Table 2) and 72 TRAP markers (Table 3) that were assembled into 51 linkage groups that cover a total genetic distance of 2,162 cM, with an average genetic distance of 7.9 cM between markers. (Table 4, Figure 2). However, in contrast with our previous studies using a BC1 or testcross populations which produced large linkage groups (133.5 - 264.5 cM) [9,12,13], most linkage groups derived from the BC2F2 population were relatively small (0 - 59 cM). Of the 51 linkage groups, only one was classified as a large linkage groups (Linkage group 1, having 40 markers covering a genetic distance of 169 cM; Table 4, Figure 2), while ten linkage groups had and intermediate size (each con- tains 6-21 markers, covering a genetic distance of 61 - 124 cM; Table; Figure 2). The other 40 linkage groups were relatively small (each contains 2 - 6 markers, cov- ering a genetic distance of 0 - 59 cM). The prevalence of small linkage groups here may reflect the possible intro- gression of chromosomal segments from PI 494817 into the genomic background of Crimson Sweet, as was shown in other studies using BC2F2 or BC3F2 populations fothe development of introgression lines [25,31,38]. r 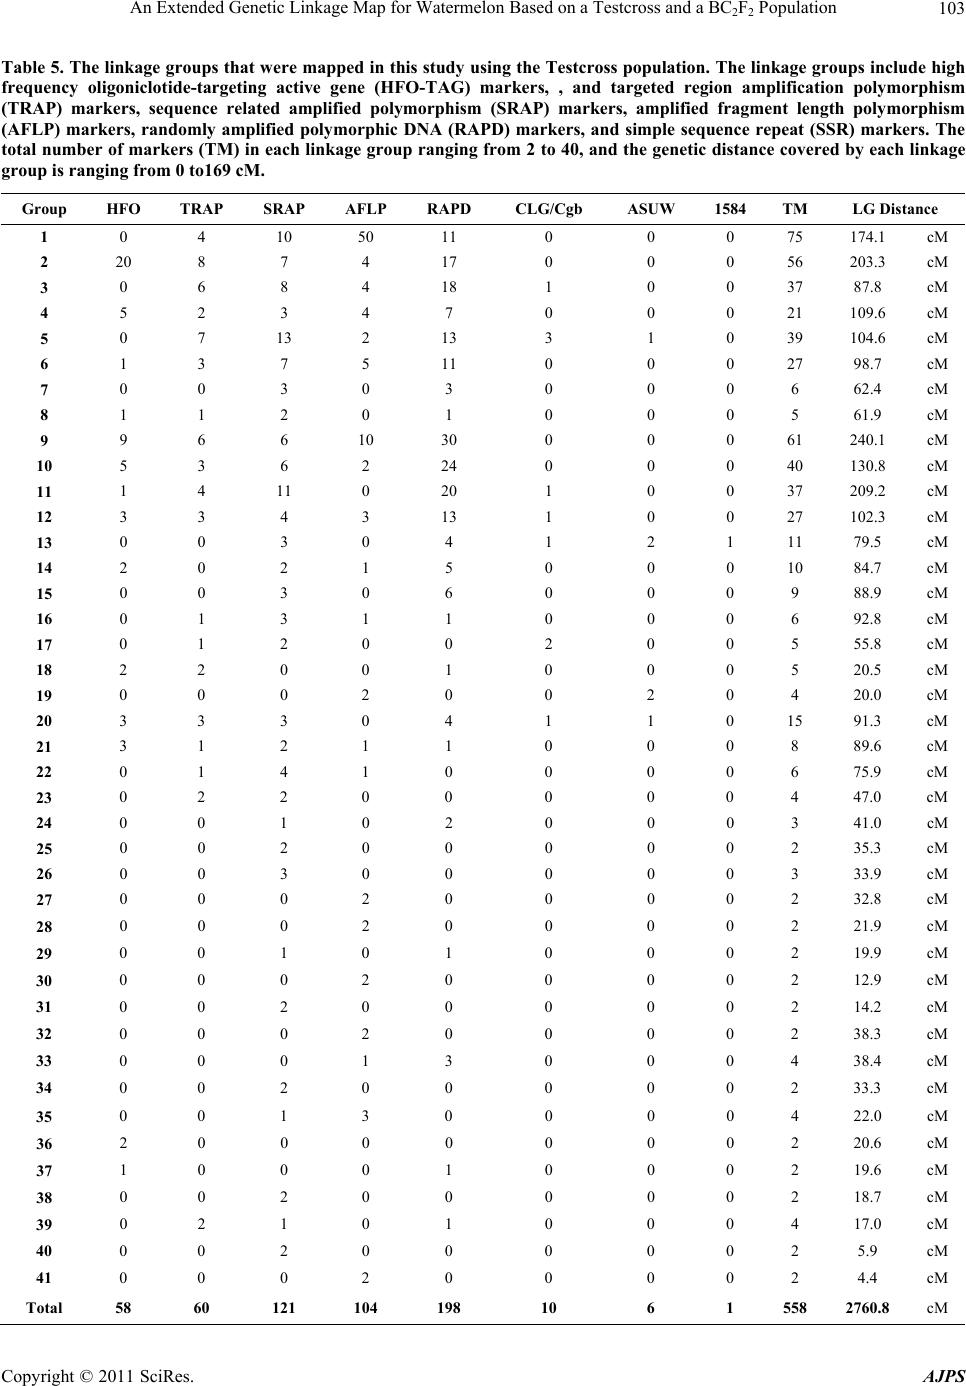 An Extended Genetic Linkage Map for Watermelon Based on a Testcross and a BCF Population103 2 2 Table 5. The linkage groups that were mapped in this study using the Testcross population. The linkage groups incl ude high frequency oligoniclotide-targeting active gene (HFO-TAG) markers, , and targeted region amplification polymorphism (TRAP) markers, sequence related amplified polymorphism (SRAP) markers, amplified fragment length polymorphism (AFLP) markers, randomly amplified polymorphic DNA (RAPD) markers, and simple sequence repeat (SSR) markers. The total number of markers (TM) in each linkage group ranging from 2 to 40, and the genetic distance covered by each linkage group is ranging from 0 to169 cM. Group HFO TRAP SRAP AFLP RAPD CLG/Cgb ASUW 1584 TM LG Distance 1 0 4 10 50 11 0 0 0 75 174.1 cM 2 20 8 7 4 17 0 0 0 56 203.3 cM 3 0 6 8 4 18 1 0 0 37 87.8 cM 4 5 2 3 4 7 0 0 0 21 109.6 cM 5 0 7 13 2 13 3 1 0 39 104.6 cM 6 1 3 7 5 11 0 0 0 27 98.7 cM 7 0 0 3 0 3 0 0 0 6 62.4 cM 8 1 1 2 0 1 0 0 0 5 61.9 cM 9 9 6 6 10 30 0 0 0 61 240.1 cM 10 5 3 6 2 24 0 0 0 40 130.8 cM 11 1 4 11 0 20 1 0 0 37 209.2 cM 12 3 3 4 3 13 1 0 0 27 102.3 cM 13 0 0 3 0 4 1 2 1 11 79.5 cM 14 2 0 2 1 5 0 0 0 10 84.7 cM 15 0 0 3 0 6 0 0 0 9 88.9 cM 16 0 1 3 1 1 0 0 0 6 92.8 cM 17 0 1 2 0 0 2 0 0 5 55.8 cM 18 2 2 0 0 1 0 0 0 5 20.5 cM 19 0 0 0 2 0 0 2 0 4 20.0 cM 20 3 3 3 0 4 1 1 0 15 91.3 cM 21 3 1 2 1 1 0 0 0 8 89.6 cM 22 0 1 4 1 0 0 0 0 6 75.9 cM 23 0 2 2 0 0 0 0 0 4 47.0 cM 24 0 0 1 0 2 0 0 0 3 41.0 cM 25 0 0 2 0 0 0 0 0 2 35.3 cM 26 0 0 3 0 0 0 0 0 3 33.9 cM 27 0 0 0 2 0 0 0 0 2 32.8 cM 28 0 0 0 2 0 0 0 0 2 21.9 cM 29 0 0 1 0 1 0 0 0 2 19.9 cM 30 0 0 0 2 0 0 0 0 2 12.9 cM 31 0 0 2 0 0 0 0 0 2 14.2 cM 32 0 0 0 2 0 0 0 0 2 38.3 cM 33 0 0 0 1 3 0 0 0 4 38.4 cM 34 0 0 2 0 0 0 0 0 2 33.3 cM 35 0 0 1 3 0 0 0 0 4 22.0 cM 36 2 0 0 0 0 0 0 0 2 20.6 cM 37 1 0 0 0 1 0 0 0 2 19.6 cM 38 0 0 2 0 0 0 0 0 2 18.7 cM 39 0 2 1 0 1 0 0 0 4 17.0 cM 40 0 0 2 0 0 0 0 0 2 5.9 cM 41 0 0 0 2 0 0 0 0 2 4.4 cM Total 58 60 121 104 198 10 6 1 558 2760.8 cM Copyright © 2011 SciRes. AJPS 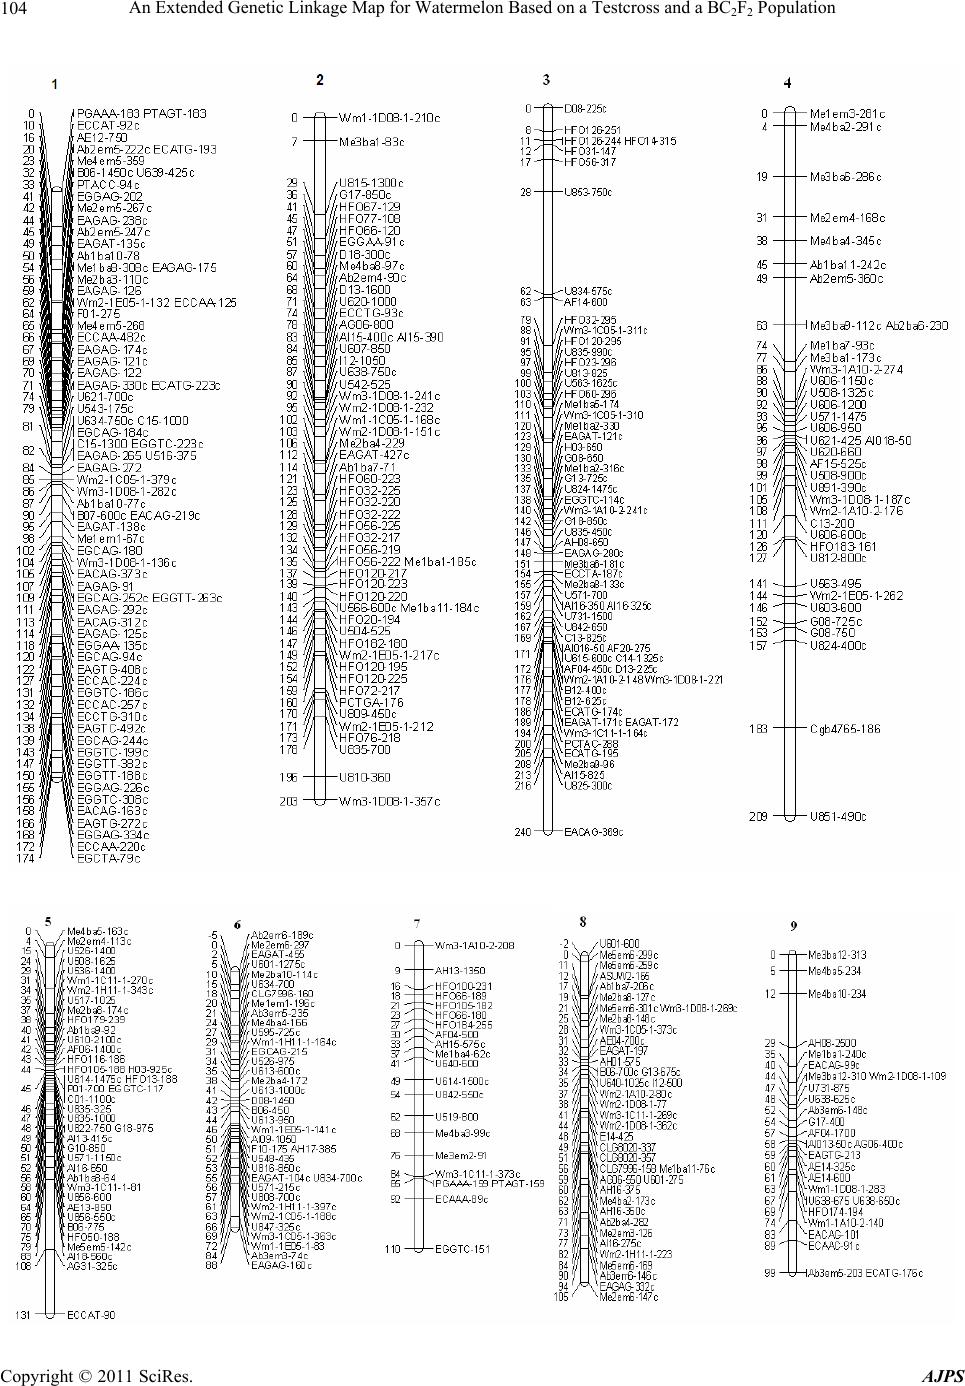 An Extended Genetic Linkage Map for Watermelon Based on a Testcross and a BCF Population 104 2 2 Copyright © 2011 SciRes. AJPS 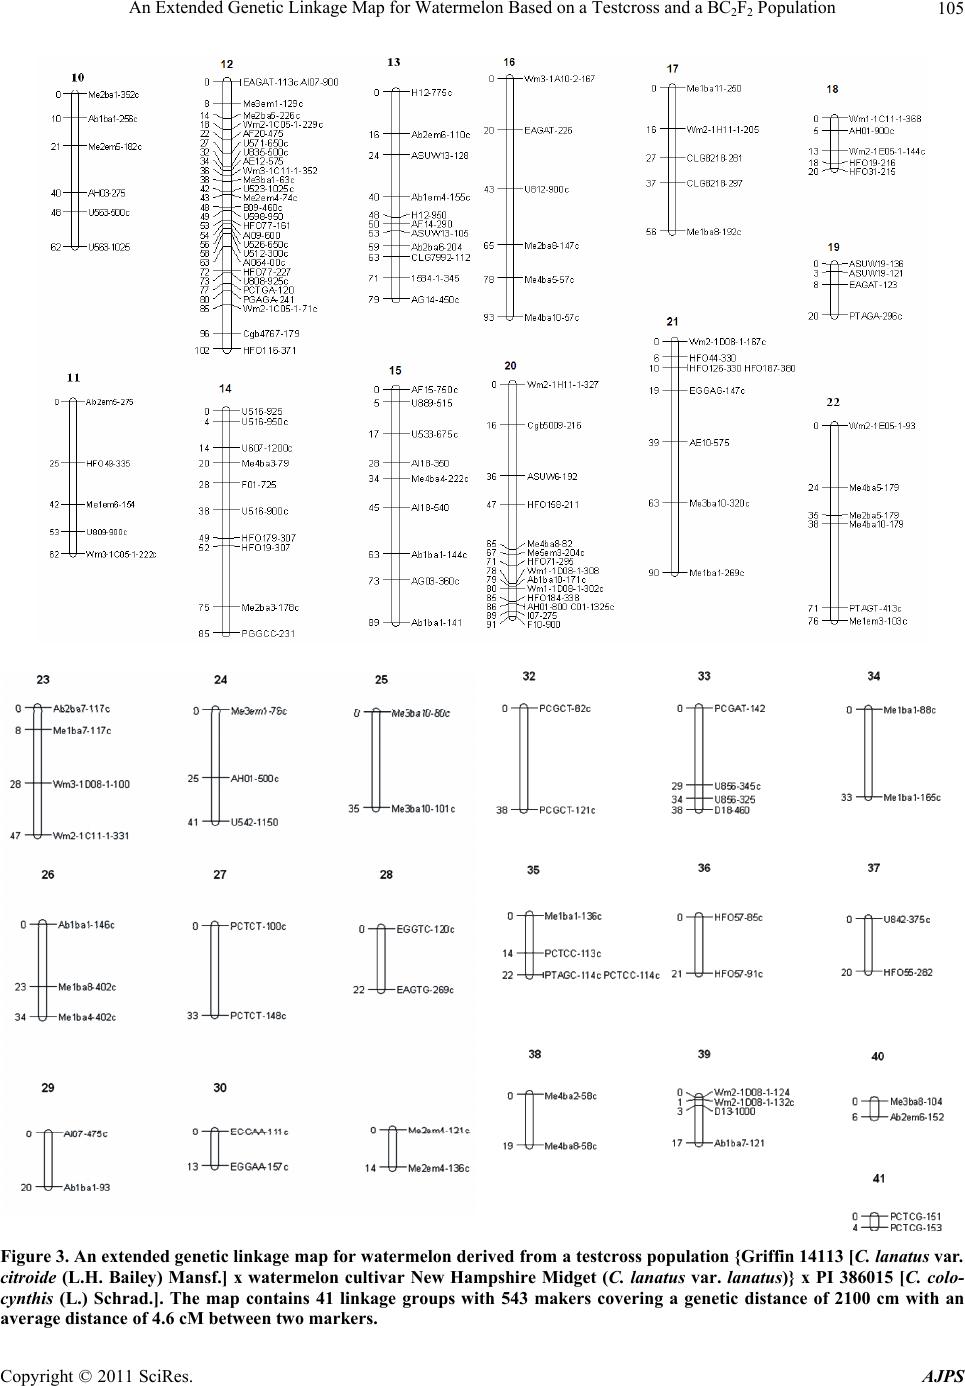 An Extended Genetic Linkage Map for Watermelon Based on a Testcross and a BCF Population105 2 2 Figure 3. An extended genetic linkage map for wa terme lon deri ved fro m a testcr oss population {Griffin 14113 [C. lanatus var. citroide (L.H. Bailey) Mansf.] x watermelon cultivar New Hampshire Midget (C. lanatus var. lanatus)} x PI 386015 [C. colo- cynthis (L.) Schrad.]. The map contains 41 linkage groups with 543 makers covering a genetic distance of 2100 cm with an average distance of 4.6 cM between two markers. Copyright © 2011 SciRes. AJPS  An Extended Genetic Linkage Map for Watermelon Based on a Testcross and a BC2F2 Population Copyright © 2011 SciRes. AJPS 106 Of the 274 markers that were mapped here, 176 were from the donor parent PI 494817, while the other 98 markers were from the recurrent parent “Crimson Sweet”. Most linkage groups contained markers representing one parent, but not the other. Linkage groups 2, 3, 4, 7, 9, 10, 12, 17, 20, 21, 22, 23, 24, 25, 26, 28, 31, 33, 34, 35, 37, 40, 41, 45, 46, 49, 50 and 51 contained markers that rep- resent the donor parent (PI 494817) only (Figure 2). On the other hand, linkage groups 5, 8, 11, 13, 14, 15, 16, 18, 19, 27, 29, 30, 32, 36, 38, 39, 42, 43, 47, and 48 contain markers that represent the recurrent parent (Crimson Sweet) only (Figure 2). Linkage groups 1, 6, and 44 con- tain markers from both the donor and recurrent parent. The markers from the donor parent tended to group to- gether, separated from those of the recurrent parent (as shown for lin kage groups 1 an d 6) (Figure 2). This clus- tering pattern, where markers from each individual par- ent tend to group unto themselves, indicates introgres- sion of chromosomal segments from the donor into the recurrent parent (as indicated by Eshed and Zamir) [25,31]. Expanding the genetic linkage map based on a test- cross population: 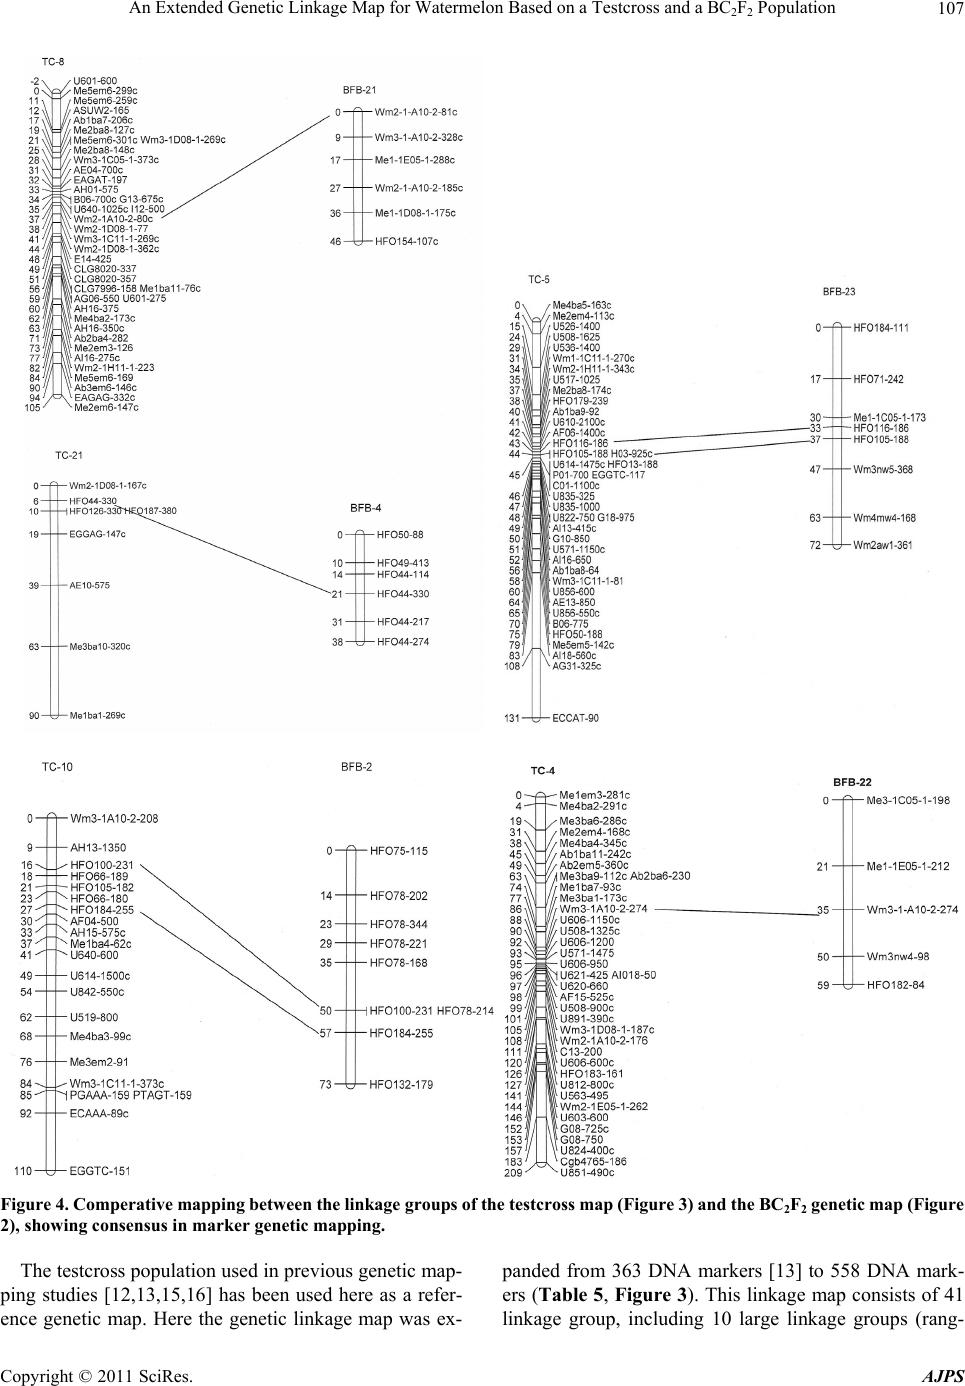 An Extended Genetic Linkage Map for Watermelon Based on a Testcross and a BCF Population107 2 2 Figure 4. Comperative mapping between the linkage groups of the testcross map (Figure 3) and the BC2F2 genetic map (Figure 2), showing consensus in marker genetic mapping. The testcross popu latio n us ed in p r ev ious g enetic map- ping studies [12,13,15,16] has been used here as a refer- ence genetic map. Here the genetic linkage map was ex- panded from 363 DNA markers [13] to 558 DNA mark- ers (Table 5, Figure 3). This linkage map consists of 41 linkage group, including 10 large linkage groups (rang- Copyright © 2011 SciRes. AJPS  An Extended Genetic Linkage Map for Watermelon Based on a Testcross and a BCF Population 108 2 2 ing from102 - 240 cM), nine intermediate size linkage groups (ranging from 62 - 93 cM), and 22 small linkage groups (ranging from 2 - 56 cM). It should be noted that a relatively large genetic distance exists between markers among most of the small linkage groups (Table 5, Fig- ure 3). Thus, the linkage groups may represent chromo- somal regions wi th hi g h recombination frequencies. Comparative mapping between the testcross and the BC2F2 genetic maps: The testcross and the BC2F2 popu- lation are derived from different genotypes representing wide genotypic and phenotypic diversity [13]. Here, the analysis identified 26 markers shared between the genetic maps derived from the testcross and the BC2F2 popula- tions. These markers represent 9 linkage groups in the testcross and 8 linkage groups in the BC2F2 map (Figure 4). It is notable that 25 of the 26 markers shared between the two linkage maps are HFO-TAG markers and one is a TRAP marker (Figure 4). These results indicate that the HFO-TAG markers which represent conserved re- gions associated with active genes [33] should be useful in comparative mapping using genetic populations de- rived from different genotypes. There are several linkage maps for watermelon in- cluding a map based on an F2 population (both parents are cultivated accessions; C. lanatus var. lanatus), con- structed by Hashizume et al. [39] in Japan, and a map based on a testcross population that consists of 363 DNA markers (including RAPD, AFLP, SRAP and SSR mark- ers) [33]. Xu et al. [40] constructed a dense genetic link- age map for watermelon that consists mostly of SSR and EST-SSR markers. This map is derived from an F2S8 recombinant inbred line (RIL) population of PI 296341 (C. lanatus var. citroides) x Chinese elite line 97103 (C. lanatus var. lanatus) [41]. Additional studies are needed to merge between the genetic maps constructed for wa- termelon. Although our results with the advanced recombinant BC2F2 population for identifying genes that confer mod- erate resistance to bacterial fruit blotch are not conclu- sive, this population should be useful for further devel- opment of introgression lines for watermelon. This BC2F2 population should also prove useful for identifying and incorporating resistance genes that exist in wild wa- termelon [15,16] into cu ltiv ated watermelon. Plant breed - ing programs for different crop plants have been using introgression lines for incorporating resistance genes from wild progenitors into cultivated typ e s [38 ]. The linkage groups identified in this study should serve as a platform for further genetic mapping and de- velopment of introgression lines for watermelon. Several genetic populations (BC1F2; BC2F2; BC2F2 and BC3F3) derived from a cross between PI 494817 and ‘Crimson Sweet’ were developed in this project. These po pulations are being used for further analysis and for development of introgression lines. These lines should be useful for expanding the narrow genetic base that exists among North American watermelon cultivars, and facilitate fur- ther analysis and identification of genes that confer dis- ease resistance or control fruit quality in watermelon [15,16,42]. REFERENCES [1] D. M. Bates and R. W. Robinson, “Cucumbers Melon and Watermelons,” In: J. Smart and N. W. Simmonds, Eds., Evolution of Crop Plants, 2nd Edition, Longman, London, 1995, pp. 89-96. [2] R. L. Jarret, L. C. Merrick, T. Holms, J. Evans and M. K. Aradhya, “Simple Sequence Repeats in Watermelon [Citrullus lanatus (Thunb.) Matsum & Nakai],” Genome, Vol. 40, 1997, pp. 433-441. doi:10.1139/g97-058 [3] C. Mujaju, J. Sehic, G. Werlemark, L. Garkava-Gus- tavsson, M. Faith and H. Nybom, “Genetic Diversity in Watermelon (Citrullus lanatus) Landraces from Zim- babwe Revealed by RAPD and SSR Markers,” Hereditas, Vol. 147, No. 4, 2010, pp. 142-153. doi:10.1111/j.1601-5223.2010.02165.x [4] A. Levi, C. E. Thomas, T. C. Wehner and X. Zhang, “Low Genetic Diversity Indicates the Need to Broaden the Genetic Base of Cultivated Watermelon,” HortScience, Vol. 36, 2001, pp. 1096-1101. [5] A. Levi, C. E. Thomas, A. P. Keinath and T. C. Wehner, “Genetic Diversity among Watermelon (Citrullus lanatus and Citrullus colocynthis) Accessions,” Genetic Re- sources and Crop Evolution, Vol. 48, No. 6, 2001, pp. 559-566. doi:10.1023/A:1013888418442 [6] G. Gusmini, R. Song and T. C. Wehner, “New Sources of Resistance to Gummy Stem Blight in Waterme lon,” Crop Science, Vol. 45, No. 2, 2005, pp. 582-588. doi:10.2135/cropsci2005.0582 [7] R. D. Martyn and D. Netzer, “Resistance to Races 0, 1 and 2 of Fusarium Wilt of Watermelon in Citrullus sp. PI-296341-FR,” HortScience, Vol. 26, 1991, pp. 429-432. [8] J. A. Thies and A. Levi, “Cha racterization of Watermelon (Citrullus lanatus var. citroides) Germplasm for Resis- tance to Root-Knot Nematodes,” Journal of Nematology, Vol. 42, 2007, pp. 1530-1533. [9] A. Levi, C. E. Thomas, X. Zhang, T. Joobeur, R. A. Dean, T. C. Wehner and B. R. Carle, “A Genetic Linkage Map for Watermelon Based on Randomly Amplified Poly- morphic DNA (RAPD) Markers,” Journal of American Society for Horticultural Science, Vol. 126, 2001, pp. 730-737. [10] L. K. Hawkins, F. Dane, T. L. Kubisiak, B. B. Rhodes and R. L. Jarret, “Linkage Mapping in a Watermelon Population Segregating for Fusarium Wilt Resistance,” Journal of American Society for Horticultural Science, Vol. 126, 2001, pp. 344-350. [11] E. S. Buckler IV, T. L. Phelps-Durr, C. S. K. Buckler, R. Copyright © 2011 SciRes. AJPS  An Extended Genetic Linkage Map for Watermelon Based on a Testcross and a BCF Population109 2 2 K. Dawe, J. F. Doebley and T. P. Holtsford, “Meiotic Drive of Chromosomal Knobs Reshaped the Maize Ge- nome,” Genetics, Vol.153, No. 1, 1999, pp. 415-426. [12] A. Levi, C. E. Thomas, T. Joobeur, X. Zhang and A. Davis, “A Genetic Linkage Map for Watermelon Derived from a Testcross Population: (Citrullus lanatus var. citroides × C. lanatus var. lanatus) × C. colocynthis,” Theoretical and Applied Genetics, Vol. 105, 2002, pp. 555-563. [13] A. Levi, C. E. Thomas, T. Trebitsh, A. Salman, J. King, J. Karalius, M. Newman, O. U. K Reddy, Y. Xu and Z. Zhang, “An Extended Linkage Map for Watermelon Based on SRAP, AFLP, SSR, ISSR, and RAPD Mark- ers,” Journal of American Society for Horticultural Sci- ence, Vol. 131, 2006, pp. 393-402. [14] J. Peng, A. B. Korol, T. Fahima, M. S. Röder, Y. I. Ronin, Y. C. Li and E. Nevo, “Molecular Genetic Maps in Wild Emmer Wheat, Triticum dicoccoides: Genome-Wide Coverage, Massive Negative Interference, and Putative Quasi-Linkage,” Genome Research, Vol. 10, 2000, pp. 1509-1531. doi:10.1101/gr.150300 [15] K. R. Harris, W. P. Wechter and A. Levi, “Isolation, Se- quence Analysis, and Linkage Mapping of NBS-LRR Disease Resistance Gene Homologs in Watermelon,” Journal of American Society for Horticultural Science, Vol. 134, 2009a, pp. 649-657. [16] K. R. Harris, K. Ling, W. P. Wechter and A. Levi, “Iden- tification and Utility of Markers Linked to the Zucchini Yellow Mosaic Virus Resistance Gene in Watermelon,” Journal of American Society for Horticultural Science, Vol. 134, 2009b, pp. 529-534. [17] K. Ling, K. R. Harris, J. D. Meyer, A. Levi, N. Guner, T. C. Wehner, A. Bendahmane and M. J. Havey, “Non- Synonymous Single Nucleotide Polymorphisms in the Watermelon eIF4E Gene Are Closely Associated with Resistance to Zucchini Yellow Mosaic Virus,” Theoreti- cal and Applied Genetics, Vol. 120, No. 1, 2009, pp. 191-200. doi:10.1007/s00122-009-1169-0 [18] D. L. Hopkins, “Bacterial Fruit Blotch of Watermelon: A New Disease in the Eastern USA,” In: C. E. Thomas, Ed., Proceedings Cucurbitaceae 1989: Evaluation and Enhancement of Cucurbit germplasm, U. S. Vegetable Laboratory, Charleston, 1989, pp. 74-75. [19] G. C. Somodi, J. B. Jones, D. L. Hopkins, R. E. Stall, T. A. Kucharek, N. C. Hodge and J. C. Watterson, “Occur- rence of a Bacteria l Watermelon Fruit Blotch in Florida,” Plant Disease, Vol. 75, 1991, pp. 1053-1056. doi:10.1094/PD-75-1053 [20] D. L. Hopkins, “Copper-Containing Fungicides Reduce the Spread of Bacterial Fruit Blotch of Watermelon in the Greenhouse,” Phytopathology, Vol. 85, 1995, p. 510. [21] R. R. Walcott, A. Fessehaie and A. C. Castro, “Differ- ences in Pathogenicity between Two Genetically Distinct Groups of Acidovorax avenae subsp. citrulli on Cucurbit Hosts,” Journal Phytopathology, Vol. 152, No. 5, 2004, pp. 277-285. doi:10.1111/j.1439-0434.2004.00841.x [22] D. L. Hopkins and C. M. Thompson, “Evaluation of Citrullus sp. Germplasm for Resistance to Acidovorax avenae subsp. Citrulli,” Plant Disease, Vol. 86, No. 1, 2002, pp. 61-64. doi:10.1094/PDIS.2002.86.1.61 [23] D. L. Hopkins and A. Levi, “Progress in the Development of Crimson Sweet-Type Watermelon Breeding Lines with Resistance to Acidovorax Avenae Subsp. Citrulli,” Acta Horticulturae, In: M. Pitrat, Ed., Proceedings of the IX Eucarpia Meetings on Genetics and Breeding of Cucur- bitaceae, INRA, 2008, pp.157-162. [24] L. Inostroza1, A. del Pozo, I. Matus and P. Hayes, “Drought Tolerance in Recombinant Chromosome Sub- stitution Lines (RCSLs) Derived from the Cross Hordeum vulgare subsp. spontaneum (Caesarea 26-24) × Hordeum vulgare subsp. vulgare CV. Harrington,” Agricultura Tecnican (Chile), Vol. 67, 2007, pp. 253-261. [25] Y. Eshed and D. Zamir, “A Genomic Library of Lycoper- sicon pennellii in Lycopersicon esculentum—A Tool for Fine Mapping of Genes,” Euphytica, Vol. 79, No. 3, 1994, pp. 175-179. doi:10.1007/BF00022516 [26] Y. Eshed and D. Zamir, “An Introgression Line Popula- tion of Lycopersicon pennellii in the Cultivated Tomato Enables the Identification and Fine Mapping of Yield- Associated QTL,” Genetics, Vol. 141, 1995, pp. 1147- 1162. [27] S. Tanksley, S. Grandillo, T. Fulton, D. Zamir, T. Eshed, V. Petiard, J. Lopez and B. T. Beck, “Advanced Back- cross QTL Analysis in a Cross between an Elite Process- ing Line of Tomato and Its Wild Relative L. pimpinelli- folium,” Theoretical and Applied Genetics, Vol. 92, No. 2, 1996, pp. 213-224. doi:10.1007/BF00223378 [28] A. J. Monforte and S. D. Tanksley, “Development of a Set of Nearisogenic and Backcross Recombinant Inbred Lines Containing Most of the Lycopersicon hirsutum Genome in a L. esculentum Genetic Background: A Tool for Gene Mapping and Gene Discovery,” Genome, Vol. 43, 2000, pp. 803-813. [29] M. J. W. Jeuken and P. Lindhout, “The Development of Lettuce Backcross Inbred Lines (BILs) for Exploitation of the Lactuca saligna (Wild Lettuce) Germplasm,” Theo- retical Applied Genetics, Vol. 109, No. 2, 2004, pp. 394-401. doi:10.1007/s00122-004-1643-7 [30] S. Liu, R. Zhou, Y. Dong, P. Li and J. Jia, “Development, Utilization of Introgre ssion Lines Using a Sy nthetic Wheat as Donor,” Theoretical and Applied Genetics, Vol. 112, No. 7, 2006, pp. 1360-1373. doi:10.1007/s00122-006-0238-x [31] V. C. Concibido, B. La Vallee, P. Mclaird, N. Pineda, J. Meyer, L. Hummel, J. Yang, K. Wu and X. Delannay, “Introgression of a Quantitative Trait Locus for Yield from Glycine soja into Commercial Soybean Cultivars,” Theoretical Applied Genetics, Vol. 106, 2003, pp. 575- 582. [32] L. D. Ramsay, D. E. Jennings, E. J. R. Bohuon, A. E. Arthur, D. J. Lydiate, M. J. Kearsey and D. F. Marshall, “The Construction of a Substitution Library of Recombi- nant Backcross Lines in Brassica oleracea for the Preci- sion Mapping of Quantitative Trait Loci,” Genome, Vol. 39, No. 3, 1996, pp. 558-567. doi:10.1139/g96-071 Copyright © 2011 SciRes. AJPS  An Extended Genetic Linkage Map for Watermelon Based on a Testcross and a BC2F2 Population Copyright © 2011 SciRes. AJPS 110 [33] A. Levi, W. P. Wechter, K. R. Harr is-Shultz , A. R. Davis and Z. Fie, “High-Frequency Oligonucleotides in Water- melon Expressed Sequenced Tag-Unigenes are Useful in Producing Polymorphic Polymerase Chain Reaction Markers among Watermelon Genotypes,” Journal of American Society for Horticultural Science, Vol. 135, 2010, pp. 369-378. [34] J. Hu and B. A. Vick, “Target Region Amplification Polymorphism: A Novel Marker Technique for Plant Genotyping,” Plant Molecular Biology Reporter, Vol. 21, No. 3, 2003, pp. 289-294. doi:10.1007/BF02772804 [35] A. Levi and C. E. Thomas, “An Improved Procedure for Isolation of High Quality DNA from Watermelon and Melon Leaves,” Cucurbit Genet Coop Report, Vol. 22, 1999, pp. 41-42. [36] J. W. Van Ooijen and R. E. Voorrips, “JoinMap 3.0, Software for the Calculation of Genetic Linkage Maps,” Plant Research International, Wageningen, 2001. [37] Y. Z. Xing, W. J. Tang, W. Y. Xue, C. G. Xu and Q. Zhang, “Fine Mapping of a Major Quantitative Trait Loci, qSSP7, Contro lling th e Number o f Spike lets per P anicle as a Single Mendelian Factor in Rice,” Theoretical and Ap- plied Genetics, Vol. 116, No. 6, 2008, pp. 789-796. doi:10.1007/s00122-008-0711-9 [38] I. Schmalenbach, N. Korber and K. Pillen, “Selecting a Set of Wild Barley Introgression Lines and Verification of QTL Effects for Resistance to Powdery Mildew and Leaf Rust,” Theoretical and Applied Genetics, Vol. 117, No. 7, 2008, pp. 1093-1106. doi:10.1007/s00122-008-0847-7 [39] T. Hashizume, I. Shimamoto and M. Hirai, “Construction of a Linkage Map and QTL Analysis of Horticultural Traits for Watermelon Citrullus lanatus (Thunb.) Matsum & Nakai] Using RAPD, RFLP and ISSR Markers,” Theoretical Applied Genetics, Vol. 106, No. 5, 2003, pp. 779-785. [40] Y. Xu, S. Guo, H. Zhang, Y. Ren, H. Zhao, G. Lv, G. Gong, Z. Fei, Q. Kou, X. Zou, H. Wang and W. Hou, “International Watermelon Genomics Initiative (IWGI): Advance and Orientation,” In: J. Thies, A. Levi and C. Kousik, Eds., Cucurbitacaea 2010 Proceeding, Charles- ton, 2010. [41] R. Zhang, Y. Xu, K. Yi, H. Zhang, L. Liu, G. Gong and A. Levi, “A Genetic Linkage Map for Watermelon Derived from Recombinant Inbred Lines,” Journal of American Society for Horticultural Science, Vol. 129, 2004, pp. 237-243. [42] A. Levi, A. Davis, A. Hernandez, P. Wechter, J. Thim- mapuram, Y. Tadmor, N. Katzir, T. Trebitsh and S. King, “Genes Expressed during the Development and Ripening of Watermelon Fruit,” Plant Cell Report, Vol. 25, No. 11, 2006, pp. 1233-1245.
|