Paper Menu >>
Journal Menu >>
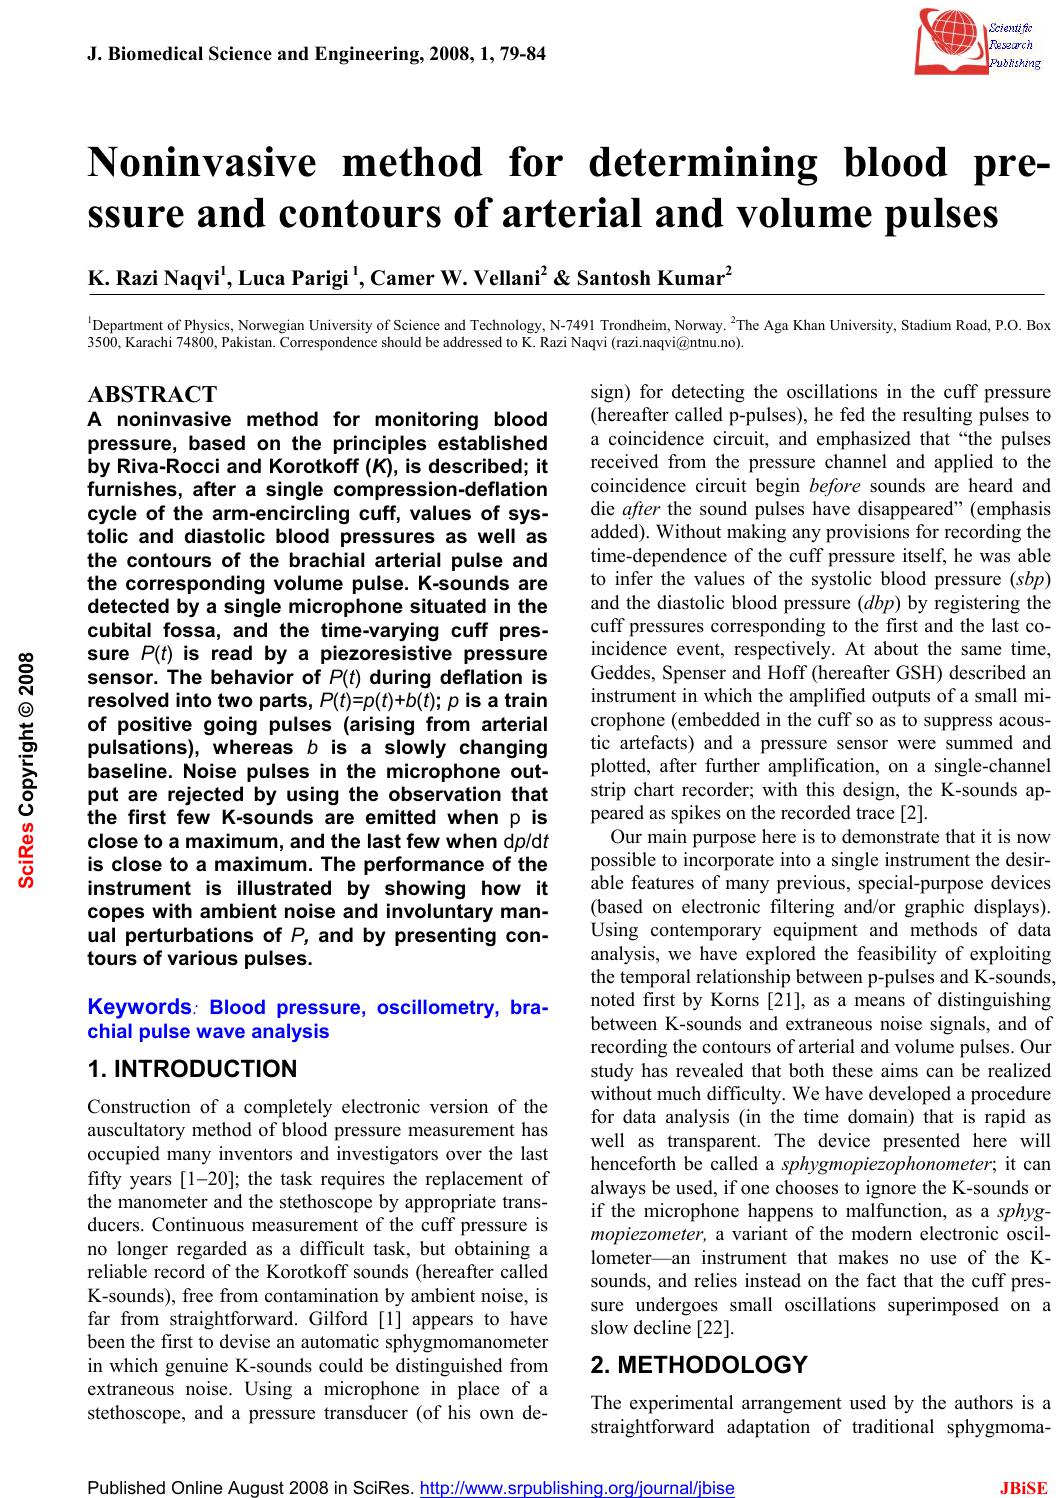 J. Biomedical Science and Engineering, 2008, 1, 79-84 Published Online August 2008 in SciRes. http://www.srpublishing.org/journal/jbise JBiSE Noninvasive method for determining blood pre- ssure and contours of arterial and volume pulses K. Razi Naqvi1, Luca Parigi 1, Camer W. Vellani2 & Santosh Kumar2 1Department of Physics, Norwegian University of Science and Technology, N-7491 Trondheim, Norway. 2The Aga Khan University, Stadium Road, P.O. Box 3500, Karachi 74800, Pakistan. Correspondence should be addressed to K. Razi Naqvi (razi.naqvi@ntnu.no). ABSTRACT A noninvasive method for monitoring blood pressure, based on the principles established by Riva-Rocci and Korotkoff (K), is described; it furnishes, after a single compression-deflation cycle of the arm-encircling cuff, values of sys- tolic and diastolic blood pressures as well as the contours of the brachial arterial pulse and the corresponding volume pulse. K-sounds are detected by a single microphone situated in the cubital fossa, and the time-varying cuff pres- sure P(t) is read by a piezoresistive pressure sensor. The behavior of P(t) during deflation is resolved into two parts, P(t)=p(t)+b(t); p is a train of positive going pulses (arising from arterial pulsations), whereas b is a slowly changing baseline. Noise pulses in the microphone out- put are rejected by using the observation that the first few K-sounds are emitted when p is close to a maximum, and the last few when dp/dt is close to a maximum. The performance of the instrument is illustrated by showing how it copes with ambient noise and involuntary man- ual perturbations of P, and by presenting con- tours of various pulses. Keywords: Blood pressure, oscillometry, bra- chial pulse wave analysis 1. INTRODUCTION Construction of a completely electronic version of the auscultatory method of blood pressure measurement has occupied many inventors and investigators over the last fifty years [1−20]; the task requires the replacement of the manometer and the stethoscope by appropriate trans- ducers. Continuous measurement of the cuff pressure is no longer regarded as a difficult task, but obtaining a reliable record of the Korotkoff sounds (hereafter called K-sounds), free from contamination by ambient noise, is far from straightforward. Gilford [1] appears to have been the first to devise an automatic sphygmomanometer in which genuine K-sounds could be distinguished from extraneous noise. Using a microphone in place of a stethoscope, and a pressure transducer (of his own de- sign) for detecting the oscillations in the cuff pressure (hereafter called p-pulses), he fed the resulting pulses to a coincidence circuit, and emphasized that “the pulses received from the pressure channel and applied to the coincidence circuit begin before sounds are heard and die after the sound pulses have disappeared” (emphasis added). Without making any provisions for recording the time-dependence of the cuff pressure itself, he was able to infer the values of the systolic blood pressure (sbp) and the diastolic blood pressure (dbp) by registering the cuff pressures corresponding to the first and the last co- incidence event, respectively. At about the same time, Geddes, Spenser and Hoff (hereafter GSH) described an instrument in which the amplified outputs of a small mi- crophone (embedded in the cuff so as to suppress acous- tic artefacts) and a pressure sensor were summed and plotted, after further amplification, on a single-channel strip chart recorder; with this design, the K-sounds ap- peared as spikes on the recorded trace [2]. Our main purpose here is to demonstrate that it is now possible to incorporate into a single instrument the desir- able features of many previous, special-purpose devices (based on electronic filtering and/or graphic displays). Using contemporary equipment and methods of data analysis, we have explored the feasibility of exploiting the temporal relationship between p-pulses and K-sounds, noted first by Korns [21], as a means of distinguishing between K-sounds and extraneous noise signals, and of recording the contours of arterial and volume pulses. Our study has revealed that both these aims can be realized without much difficulty. We have developed a procedure for data analysis (in the time domain) that is rapid as well as transparent. The device presented here will henceforth be called a sphygmopiezophonometer; it can always be used, if one chooses to ignore the K-sounds or if the microphone happens to malfunction, as a sphyg- mopiezometer, a variant of the modern electronic oscil- lometer—an instrument that makes no use of the K- sounds, and relies instead on the fact that the cuff pres- sure undergoes small oscillations superimposed on a slow decline [22]. 2. METHODOLOGY The experimental arrangement used by the authors is a straightforward adaptation of traditional sphygmoma- SciRes Copyright © 2008 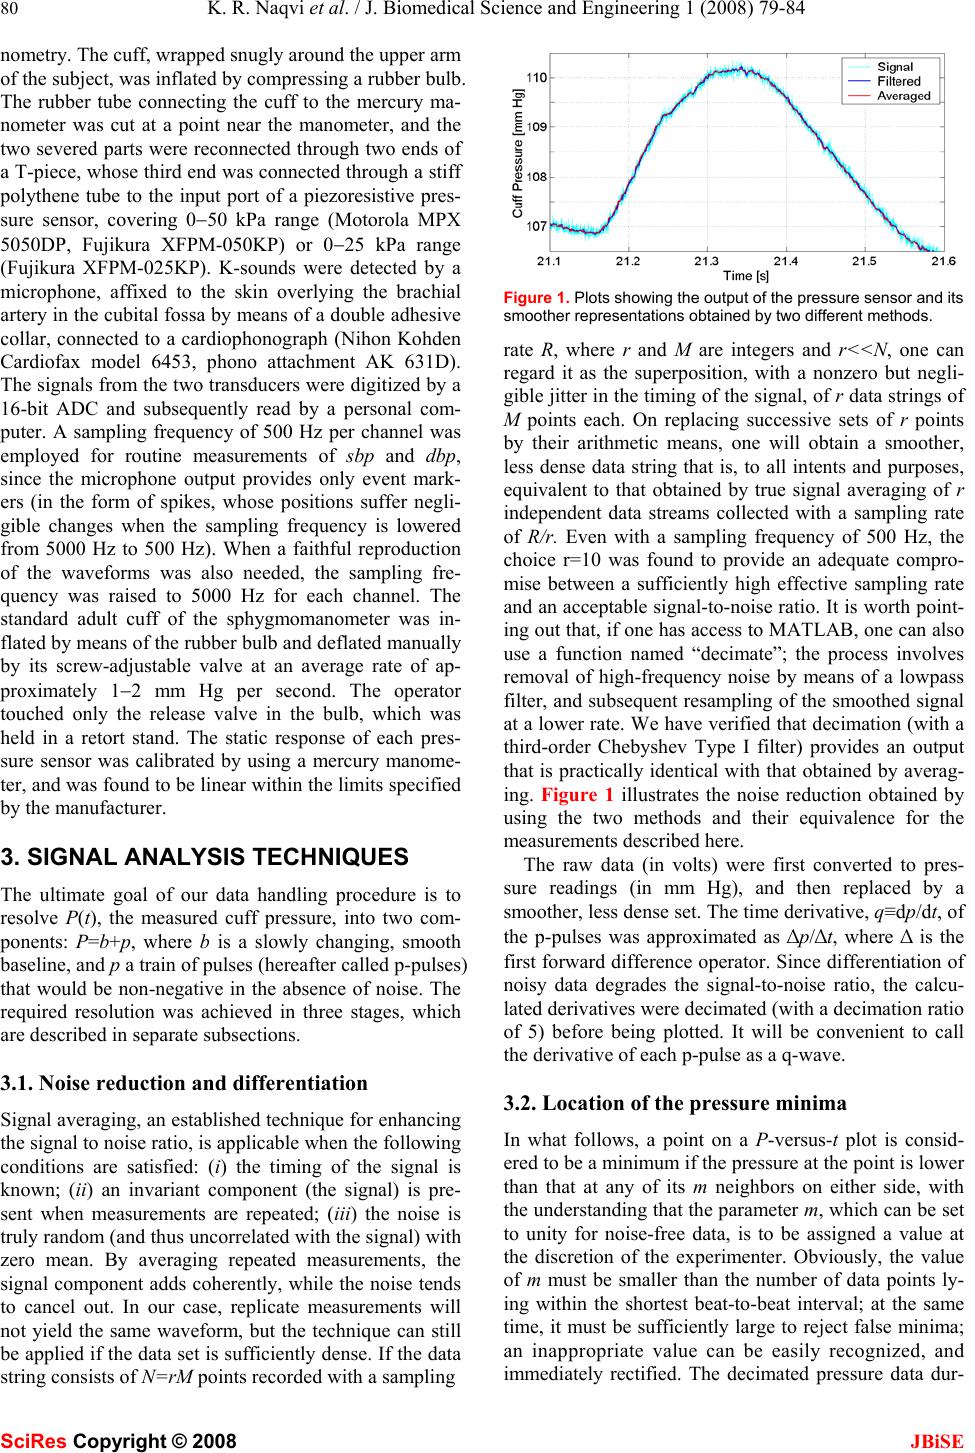 80 K. R. Naqvi et al. / J. Biomedical Science and Engineering 1 (2008) 79-84 SciRes Copyright © 2008 JBiSE nometry. The cuff, wrapped snugly around the upper arm of the subject, was inflated by compressing a rubber bulb. The rubber tube connecting the cuff to the mercury ma- nometer was cut at a point near the manometer, and the two severed parts were reconnected through two ends of a T-piece, whose third end was connected through a stiff polythene tube to the input port of a piezoresistive pres- sure sensor, covering 0−50 kPa range (Motorola MPX 5050DP, Fujikura XFPM-050KP) or 0−25 kPa range (Fujikura XFPM-025KP). K-sounds were detected by a microphone, affixed to the skin overlying the brachial artery in the cubital fossa by means of a double adhesive collar, connected to a cardiophonograph (Nihon Kohden Cardiofax model 6453, phono attachment AK 631D). The signals from the two transducers were digitized by a 16-bit ADC and subsequently read by a personal com- puter. A sampling frequency of 500 Hz per channel was employed for routine measurements of sbp and dbp, since the microphone output provides only event mark- ers (in the form of spikes, whose positions suffer negli- gible changes when the sampling frequency is lowered from 5000 Hz to 500 Hz). When a faithful reproduction of the waveforms was also needed, the sampling fre- quency was raised to 5000 Hz for each channel. The standard adult cuff of the sphygmomanometer was in- flated by means of the rubber bulb and deflated manually by its screw-adjustable valve at an average rate of ap- proximately 1−2 mm Hg per second. The operator touched only the release valve in the bulb, which was held in a retort stand. The static response of each pres- sure sensor was calibrated by using a mercury manome- ter, and was found to be linear within the limits specified by the manufacturer. 3. SIGNAL ANALYSIS TECHNIQUES The ultimate goal of our data handling procedure is to resolve P(t), the measured cuff pressure, into two com- ponents: P=b+p, where b is a slowly changing, smooth baseline, and p a train of pulses (hereafter called p-pulses) that would be non-negative in the absence of noise. The required resolution was achieved in three stages, which are described in separate subsections. 3.1. Noise reduction and differentiation Signal averaging, an established technique for enhancing the signal to noise ratio, is applicable when the following conditions are satisfied: (i) the timing of the signal is known; (ii) an invariant component (the signal) is pre- sent when measurements are repeated; (iii) the noise is truly random (and thus uncorrelated with the signal) with zero mean. By averaging repeated measurements, the signal component adds coherently, while the noise tends to cancel out. In our case, replicate measurements will not yield the same waveform, but the technique can still be applied if the data set is sufficiently dense. If the data string consists of N=rM points recorded with a sampling Figure 1. Plots showing the output of the pressure sensor and its smoother representations obtained by two different methods. rate R, where r and M are integers and r<<N, one can regard it as the superposition, with a nonzero but negli- gible jitter in the timing of the signal, of r data strings of M points each. On replacing successive sets of r points by their arithmetic means, one will obtain a smoother, less dense data string that is, to all intents and purposes, equivalent to that obtained by true signal averaging of r independent data streams collected with a sampling rate of R/r. Even with a sampling frequency of 500 Hz, the choice r=10 was found to provide an adequate compro- mise between a sufficiently high effective sampling rate and an acceptable signal-to-noise ratio. It is worth point- ing out that, if one has access to MATLAB, one can also use a function named “decimate”; the process involves removal of high-frequency noise by means of a lowpass filter, and subsequent resampling of the smoothed signal at a lower rate. We have verified that decimation (with a third-order Chebyshev Type I filter) provides an output that is practically identical with that obtained by averag- ing. Figure 1 illustrates the noise reduction obtained by using the two methods and their equivalence for the measurements described here. The raw data (in volts) were first converted to pres- sure readings (in mm Hg), and then replaced by a smoother, less dense set. The time derivative, q≡dp/dt, of the p-pulses was approximated as ∆p/∆t, where ∆ is the first forward difference operator. Since differentiation of noisy data degrades the signal-to-noise ratio, the calcu- lated derivatives were decimated (with a decimation ratio of 5) before being plotted. It will be convenient to call the derivative of each p-pulse as a q-wave. 3.2. Location of the pressure minima In what follows, a point on a P-versus-t plot is consid- ered to be a minimum if the pressure at the point is lower than that at any of its m neighbors on either side, with the understanding that the parameter m, which can be set to unity for noise-free data, is to be assigned a value at the discretion of the experimenter. Obviously, the value of m must be smaller than the number of data points ly- ing within the shortest beat-to-beat interval; at the same time, it must be sufficiently large to reject false minima; an inappropriate value can be easily recognized, and immediately rectified. The decimated pressure data dur- 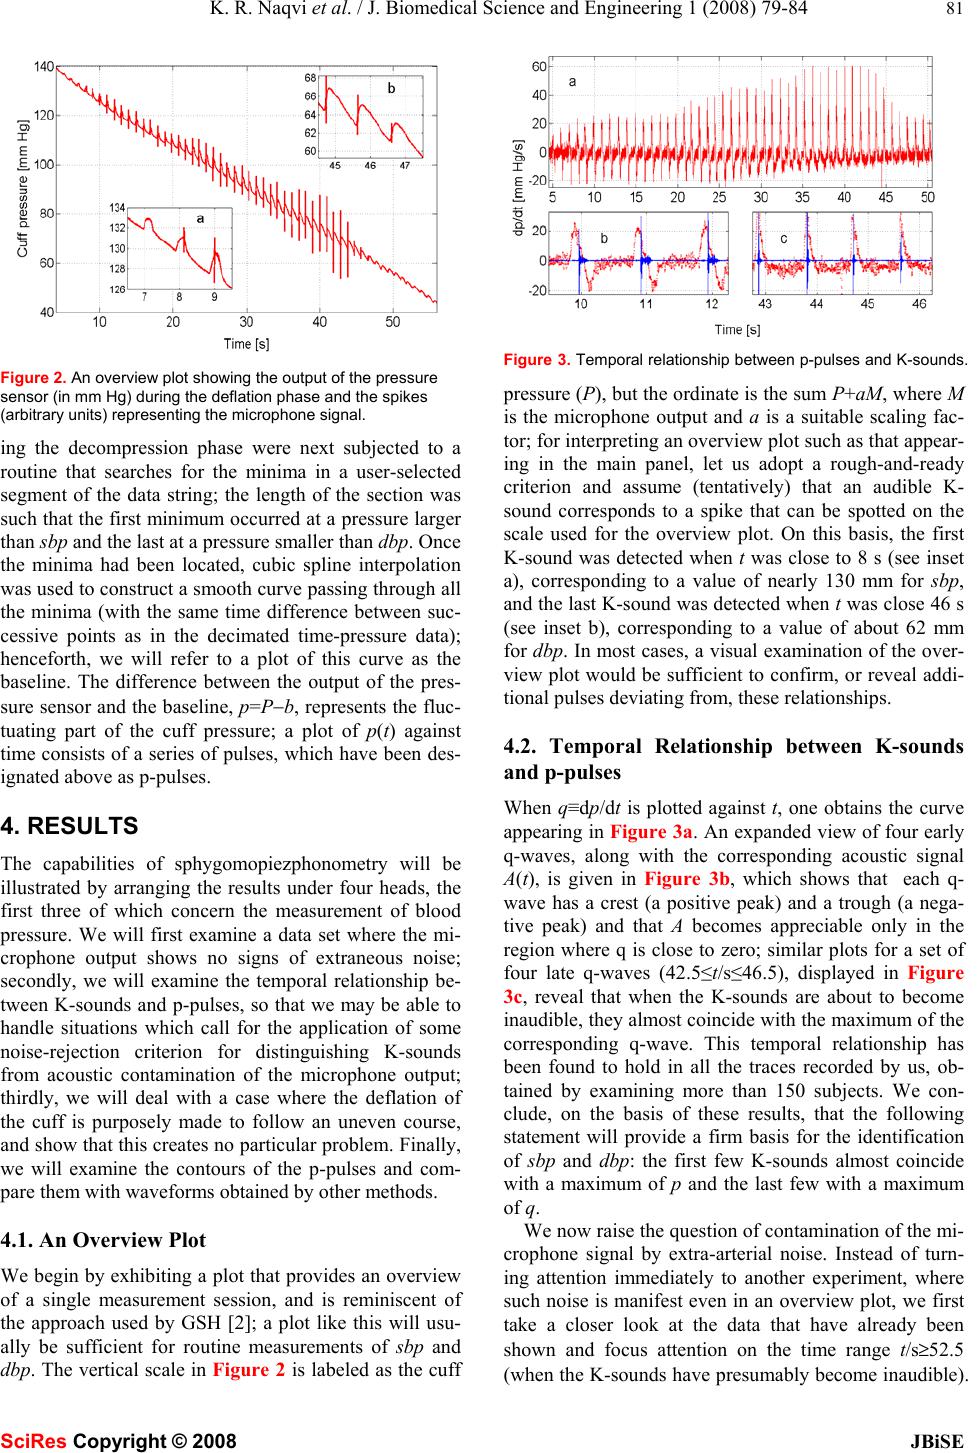 K. R. Naqvi et al. / J. Biomedical Science and Engineering 1 (2008) 79-84 81 SciRes Copyright © 2008 JBiSE Figure 2. An overview plot showing the output of the pressure sensor (in mm Hg) during the deflation phase and the spikes (arbitrary units) representing the microphone signal. ing the decompression phase were next subjected to a routine that searches for the minima in a user-selected segment of the data string; the length of the section was such that the first minimum occurred at a pressure larger than sbp and the last at a pressure smaller than dbp. Once the minima had been located, cubic spline interpolation was used to construct a smooth curve passing through all the minima (with the same time difference between suc- cessive points as in the decimated time-pressure data); henceforth, we will refer to a plot of this curve as the baseline. The difference between the output of the pres- sure sensor and the baseline, p=P−b, represents the fluc- tuating part of the cuff pressure; a plot of p(t) against time consists of a series of pulses, which have been des- ignated above as p-pulses. 4. RESULTS The capabilities of sphygomopiezphonometry will be illustrated by arranging the results under four heads, the first three of which concern the measurement of blood pressure. We will first examine a data set where the mi- crophone output shows no signs of extraneous noise; secondly, we will examine the temporal relationship be- tween K-sounds and p-pulses, so that we may be able to handle situations which call for the application of some noise-rejection criterion for distinguishing K-sounds from acoustic contamination of the microphone output; thirdly, we will deal with a case where the deflation of the cuff is purposely made to follow an uneven course, and show that this creates no particular problem. Finally, we will examine the contours of the p-pulses and com- pare them with waveforms obtained by other methods. 4.1. An Overview Plot We begin by exhibiting a plot that provides an overview of a single measurement session, and is reminiscent of the approach used by GSH [2]; a plot like this will usu- ally be sufficient for routine measurements of sbp and dbp. The vertical scale in Figure 2 is labeled as the cuff Figure 3. Temporal relationship between p-pulses and K-sounds. pressure (P), but the ordinate is the sum P+aM, where M is the microphone output and a is a suitable scaling fac- tor; for interpreting an overview plot such as that appear- ing in the main panel, let us adopt a rough-and-ready criterion and assume (tentatively) that an audible K- sound corresponds to a spike that can be spotted on the scale used for the overview plot. On this basis, the first K-sound was detected when t was close to 8 s (see inset a), corresponding to a value of nearly 130 mm for sbp, and the last K-sound was detected when t was close 46 s (see inset b), corresponding to a value of about 62 mm for dbp. In most cases, a visual examination of the over- view plot would be sufficient to confirm, or reveal addi- tional pulses deviating from, these relationships. 4.2. Temporal Relationship between K-sounds and p-pulses When q≡dp/dt is plotted against t, one obtains the curve appearing in Figure 3a. An expanded view of four early q-waves, along with the corresponding acoustic signal A(t), is given in Figure 3b, which shows that each q- wave has a crest (a positive peak) and a trough (a nega- tive peak) and that A becomes appreciable only in the region where q is close to zero; similar plots for a set of four late q-waves (42.5≤t/s≤46.5), displayed in Figure 3c, reveal that when the K-sounds are about to become inaudible, they almost coincide with the maximum of the corresponding q-wave. This temporal relationship has been found to hold in all the traces recorded by us, ob- tained by examining more than 150 subjects. We con- clude, on the basis of these results, that the following statement will provide a firm basis for the identification of sbp and dbp: the first few K-sounds almost coincide with a maximum of p and the last few with a maximum of q. We now raise the question of contamination of the mi- crophone signal by extra-arterial noise. Instead of turn- ing attention immediately to another experiment, where such noise is manifest even in an overview plot, we first take a closer look at the data that have already been shown and focus attention on the time range t/s≥52.5 (when the K-sounds have presumably become inaudible). 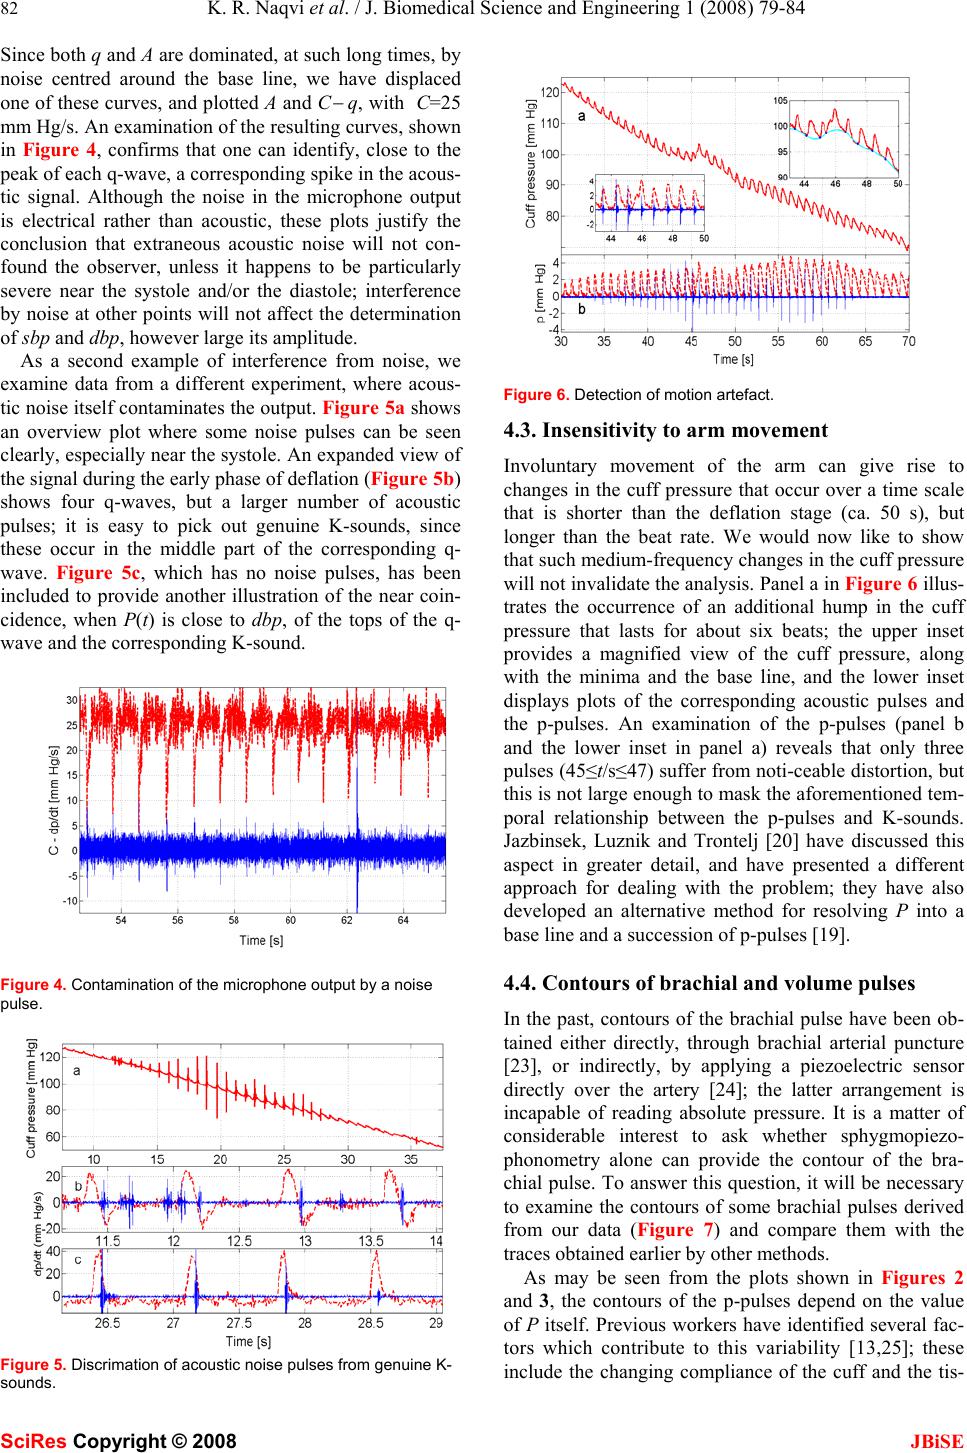 82 K. R. Naqvi et al. / J. Biomedical Science and Engineering 1 (2008) 79-84 SciRes Copyright © 2008 JBiSE Since both q and A are dominated, at such long times, by noise centred around the base line, we have displaced one of these curves, and plotted A and C − q, with C=25 mm Hg/s. An examination of the resulting curves, shown in Figure 4, confirms that one can identify, close to the peak of each q-wave, a corresponding spike in the acous- tic signal. Although the noise in the microphone output is electrical rather than acoustic, these plots justify the conclusion that extraneous acoustic noise will not con- found the observer, unless it happens to be particularly severe near the systole and/or the diastole; interference by noise at other points will not affect the determination of sbp and dbp, however large its amplitude. As a second example of interference from noise, we examine data from a different experiment, where acous- tic noise itself contaminates the output. Figure 5a shows an overview plot where some noise pulses can be seen clearly, especially near the systole. An expanded view of the signal during the early phase of deflation (Figure 5b) shows four q-waves, but a larger number of acoustic pulses; it is easy to pick out genuine K-sounds, since these occur in the middle part of the corresponding q- wave. Figure 5c, which has no noise pulses, has been included to provide another illustration of the near coin- cidence, when P(t) is close to dbp, of the tops of the q- wave and the corresponding K-sound. Figure 4. Contamination of the microphone output by a noise pulse. Figure 5. Discrimation of acoustic noise pulses from genuine K- sounds. Figure 6. Detection of motion artefact. 4.3. Insensitivity to arm movement Involuntary movement of the arm can give rise to changes in the cuff pressure that occur over a time scale that is shorter than the deflation stage (ca. 50 s), but longer than the beat rate. We would now like to show that such medium-frequency changes in the cuff pressure will not invalidate the analysis. Panel a in Figure 6 illus- trates the occurrence of an additional hump in the cuff pressure that lasts for about six beats; the upper inset provides a magnified view of the cuff pressure, along with the minima and the base line, and the lower inset displays plots of the corresponding acoustic pulses and the p-pulses. An examination of the p-pulses (panel b and the lower inset in panel a) reveals that only three pulses (45≤t/s≤47) suffer from noti-ceable distortion, but this is not large enough to mask the aforementioned tem- poral relationship between the p-pulses and K-sounds. Jazbinsek, Luznik and Trontelj [20] have discussed this aspect in greater detail, and have presented a different approach for dealing with the problem; they have also developed an alternative method for resolving P into a base line and a succession of p-pulses [19]. 4.4. Contours of brachial and volume pulses In the past, contours of the brachial pulse have been ob- tained either directly, through brachial arterial puncture [23], or indirectly, by applying a piezoelectric sensor directly over the artery [24]; the latter arrangement is incapable of reading absolute pressure. It is a matter of considerable interest to ask whether sphygmopiezo- phonometry alone can provide the contour of the bra- chial pulse. To answer this question, it will be necessary to examine the contours of some brachial pulses derived from our data (Figure 7) and compare them with the traces obtained earlier by other methods. As may be seen from the plots shown in Figures 2 and 3, the contours of the p-pulses depend on the value of P itself. Previous workers have identified several fac- tors which contribute to this variability [13,25]; these include the changing compliance of the cuff and the tis- 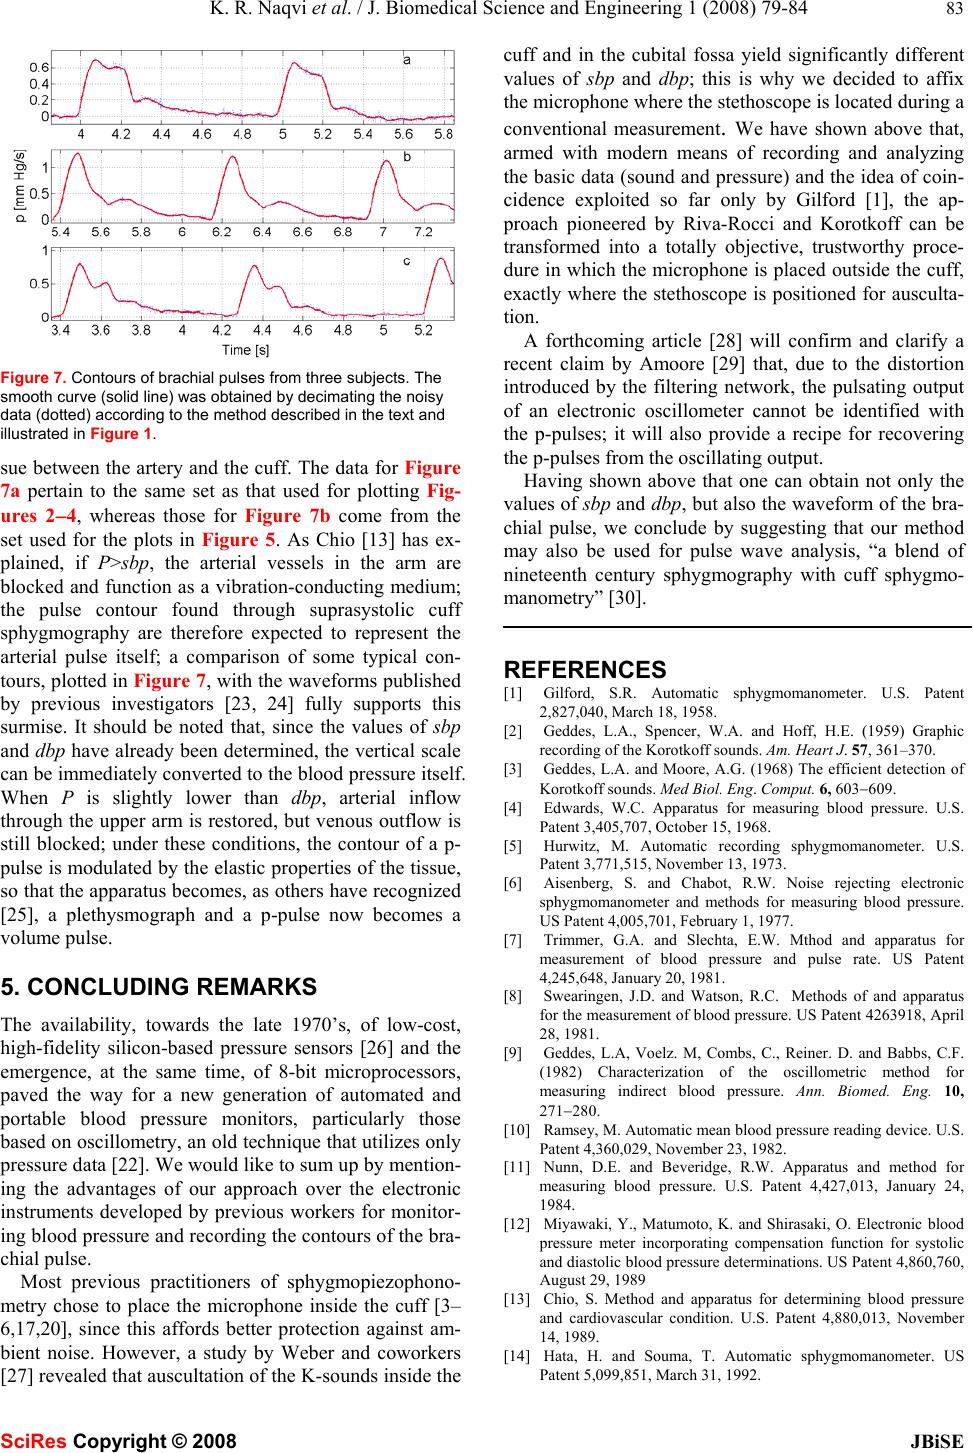 K. R. Naqvi et al. / J. Biomedical Science and Engineering 1 (2008) 79-84 83 SciRes Copyright © 2008 JBiSE Figure 7. Contours of brachial pulses from three subjects. The smooth curve (solid line) was obtained by decimating the noisy data (dotted) according to the method described in the text and illustrated in Figure 1. sue between the artery and the cuff. The data for Figure 7a pertain to the same set as that used for plotting Fig- ures 2−4, whereas those for Figure 7b come from the set used for the plots in Figure 5. As Chio [13] has ex- plained, if P>sbp, the arterial vessels in the arm are blocked and function as a vibration-conducting medium; the pulse contour found through suprasystolic cuff sphygmography are therefore expected to represent the arterial pulse itself; a comparison of some typical con- tours, plotted in Figure 7, with the waveforms published by previous investigators [23, 24] fully supports this surmise. It should be noted that, since the values of sbp and dbp have already been determined, the vertical scale can be immediately converted to the blood pressure itself. When P is slightly lower than dbp, arterial inflow through the upper arm is restored, but venous outflow is still blocked; under these conditions, the contour of a p- pulse is modulated by the elastic properties of the tissue, so that the apparatus becomes, as others have recognized [25], a plethysmograph and a p-pulse now becomes a volume pulse. 5. CONCLUDING REMARKS The availability, towards the late 1970’s, of low-cost, high-fidelity silicon-based pressure sensors [26] and the emergence, at the same time, of 8-bit microprocessors, paved the way for a new generation of automated and portable blood pressure monitors, particularly those based on oscillometry, an old technique that utilizes only pressure data [22]. We would like to sum up by mention- ing the advantages of our approach over the electronic instruments developed by previous workers for monitor- ing blood pressure and recording the contours of the bra- chial pulse. Most previous practitioners of sphygmopiezophono- metry chose to place the microphone inside the cuff [3– 6,17,20], since this affords better protection against am- bient noise. However, a study by Weber and coworkers [27] revealed that auscultation of the K-sounds inside the cuff and in the cubital fossa yield significantly different values of sbp and dbp; this is why we decided to affix the microphone where the stethoscope is located during a conventional measurement. We have shown above that, armed with modern means of recording and analyzing the basic data (sound and pressure) and the idea of coin- cidence exploited so far only by Gilford [1], the ap- proach pioneered by Riva-Rocci and Korotkoff can be transformed into a totally objective, trustworthy proce- dure in which the microphone is placed outside the cuff, exactly where the stethoscope is positioned for ausculta- tion. A forthcoming article [28] will confirm and clarify a recent claim by Amoore [29] that, due to the distortion introduced by the filtering network, the pulsating output of an electronic oscillometer cannot be identified with the p-pulses; it will also provide a recipe for recovering the p-pulses from the oscillating output. Having shown above that one can obtain not only the values of sbp and dbp, but also the waveform of the bra- chial pulse, we conclude by suggesting that our method may also be used for pulse wave analysis, “a blend of nineteenth century sphygmography with cuff sphygmo- manometry” [30]. REFERENCES [1] Gilford, S.R. Automatic sphygmomanometer. U.S. Patent 2,827,040, March 18, 1958. [2] Geddes, L.A., Spencer, W.A. and Hoff, H.E. (1959) Graphic recording of the Korotkoff sounds. Am. Heart J. 57, 361–370. [3] Geddes, L.A. and Moore, A.G. (1968) The efficient detection of Korotkoff sounds. Med Biol. Eng. Comput. 6, 603−609. [4] Edwards, W.C. Apparatus for measuring blood pressure. U.S. Patent 3,405,707, October 15, 1968. [5] Hurwitz, M. Automatic recording sphygmomanometer. U.S. Patent 3,771,515, November 13, 1973. [6] Aisenberg, S. and Chabot, R.W. Noise rejecting electronic sphygmomanometer and methods for measuring blood pressure. US Patent 4,005,701, February 1, 1977. [7] Trimmer, G.A. and Slechta, E.W. Mthod and apparatus for measurement of blood pressure and pulse rate. US Patent 4,245,648, January 20, 1981. [8] Swearingen, J.D. and Watson, R.C. Methods of and apparatus for the measurement of blood pressure. US Patent 4263918, April 28, 1981. [9] Geddes, L.A, Voelz. M, Combs, C., Reiner. D. and Babbs, C.F. (1982) Characterization of the oscillometric method for measuring indirect blood pressure. Ann. Biomed. Eng. 10, 271−280. [10] Ramsey, M. Automatic mean blood pressure reading device. U.S. Patent 4,360,029, November 23, 1982. [11] Nunn, D.E. and Beveridge, R.W. Apparatus and method for measuring blood pressure. U.S. Patent 4,427,013, January 24, 1984. [12] Miyawaki, Y., Matumoto, K. and Shirasaki, O. Electronic blood pressure meter incorporating compensation function for systolic and diastolic blood pressure determinations. US Patent 4,860,760, August 29, 1989 [13] Chio, S. Method and apparatus for determining blood pressure and cardiovascular condition. U.S. Patent 4,880,013, November 14, 1989. [14] Hata, H. and Souma, T. Automatic sphygmomanometer. US Patent 5,099,851, March 31, 1992.  84 K. R. Naqvi et al. / J. Biomedical Science and Engineering 1 (2008) 79-84 SciRes Copyright © 2008 JBiSE [15] Shinomiya, T. Electronic sphygmomanometer. U.S. Patent 5,103,830, April 14, 1992. [16] Brinton, T.J., Cotter, B., Kailasam, M.T., Brown, D.L., Chio, S., O’Connor, D.T. and DeMaria, A.N. (1997) Development and validation of a noninvasive method to determine arterial pressure and vascular compliance. Am. J. Cardiol. 80, 323–330. [17] Pinto, L., Dhanantwari, A., Wong, W., Stergiopoulos, S. and Maris, M. (2002) Blood pressure measurement in noise intensive environment using adaptive interference cancellation. Ann. Biomed Eng. 30, 657–670. [18] Hersh, L. Automatic indirect non-invasive apparatus for determining diastolic blood pressure. U.S. Patent 6,517,495, Februay 11, 2003. [19] Jazbinsek, V., Luznik, J. and Trontelj, Z. (2005) Non-invasive blood pressure measurements: separation of the arterial pressure oscillometric waveform from the deflation using digital filtering. IFBME proceedings of EMBEC’05. (http://fizika.imfm.si/jazbinsek/konf2005/2268F.pdf) [20] Jazbinsek, V., Luznik, J. and Trontelj, Z. (2005) Averaging oscillometric non-invasive blood pressure recordings: Transformation into the normalised view. IFBME proceedings of EMBEC’05. (http://fizika.imfm.si/jazbinsek/konf2005/2271F.pdf) [21] Korns, H.M. The nature and time relations of the sounds of Korotkov in man. (1926) Am. J. Physiol. 44, 247–263. [22] Erlanger, J. (1916) Studies in blood pressure estimations by indirect methods: I. The mechanism of the oscillatory criteria. Am. J. Physiol. 39, 401–446. [23] Kroeker E.J. and Wood, E.H. (1955) Comparison of simultaneously recorded central and peripheral arterial pressure pulses during rest, exercise and tilted position in man. Circulation Res. 111, 623–632. [24] Karr, S.G., Karwoski, T., Jacobs, J.E. and Mockros, L.F. (1985) Transducer system for the noninvasive recording of arterial pressure contours. Ann. Biomed Eng. 13, 425–442 [25] G. Drzewiecki and J. J. Pilla, Noninvasive measurement of the human brachial artery pressure-area relation in collapse and hypertension. (1998) Ann. Bi omed. Eng. 26, 965–974. [26] Middelhoek, S. and Noorlag, D.J.W. (1981) Silicon micro- transducers. J. Phys. E: Sci. Instrum. 14, 1343–1352. [27] Weber, F., Analuf, M., Hirche, H., Roggenbuck, U. and Phillip, Th. (1999) Differences in blood pressure values by simultaneous auscultation of of Korotkoff sounds inside the cuff and in the antecubital fossa. J. Hum. Hypertens. 13, 695−700. [28] Naqvi, K.R., Jávorfi, T. and Vellani, C.W. (2008) A method for retrieving the tions from the output of an electronic oscillometer. JBiSE 2, 75-78. [29] Amoore, J.N. (2006) Extracting oscillometric pulses from the cuff pressure: does it affect the pressure determined by oscillometric blood pressure monitors? Blood Press. Monit. 11, 269–279. [30] O'Rourke, M.F., Pauca, A. and Jiang, X. (2001) Pulse wave analysis. Br. J. Clin. Pha harmacol. 51, 507–522 |