 Journal of Software Engineering and Applications, 2011, 4, 371-378 doi:10.4236/jsea.2011.46042 Published Online June 2011 (http://www.SciRP.org/journal/jsea) Copyright © 2011 SciRes. JSEA 371 Analysis of the Relevance of Evaluation Criteria for Multicomponent Image Segmentation Sié Ouattara1, Georges Laussane Loum1, Alain Clément2, Bertrant Vigouroux2 1Laboratoire d’Instrumentation, d’Image et de Spectroscopie (L2IS), Institut National Polytechnique Félix Houphouët-Boigny (INPHB)/DFR-GEE, Yamoussoukro, Côte d’Ivoire; 2Laboratoire d’Ingénierie des Systèmes Automatisés (LISA), Institut Univer- sitaire de Technologie, Angers, France. Email: sie_ouat@yahoo.fr Received May 8th, 2011; revised June 2nd, 2011; accepted June 11th, 2011. ABSTRACT Image segmentation is an impo rtant stage in many applications such as image, video and computer processing. Gener- ally image interpretation depends on it. The materials and methods used to demonstra te are described. The results are presented and analyzed. Several approaches and algorithms for image segmentation have been developed, but it is dif- ficult to evaluate the efficiency and to make an objective comparison of different segmentation methods. This general problem has been addressed for the evaluation of a segmentation result and the results are available in the literature. In this work, we first presented some criteria of evaluation of segmentation commonly used in image processing with reviews of their models. Then multicomponent synthetic images of known composition are applied to these criteria to explore the operation and evaluate its relevance. The results show tha t choosing an assessment method depends on the purpose, however the criterion of Zeboudj appears powerful for the evaluation of region segmentations for properly separated classes, on the contrary the criteria of Levine-Nazif and Borsotti are adap ted to the methods of classification and permit to build homogeneous regions or classes. The values of the Rosenbeger criterion are generally low and similar, so hard to make a comparison o f segmentations with this criterion. Keywords: Quality of Segmentation, Multicomponent Images, Supervised and Unsupervi sed Eval u ati on , Synthetic Images, Metric 1. Introduction Segmentation is an essential step in image processing to the extent that it affects the interpretation which will be made of these images in many application areas [1-4]. They are based on different approaches, such as contour, region and texture. Many algorithms have been proposed in recent decades. Given the multitude of proposed methods, the problem of assessing the quality of segmentation becomes paramount. Originally, the first criteria for evaluating the quality of segmentation were purely subjective: the observer merely to examine different results of segmentation, to decide which the best was according to the objective. It soon becomes necessary to replace this qualitative method by quantitative methods, defining appropriate quality criteria. The first quantitative criteria date from the Nineties (90), but the field remains open, and new criteria appear regularly in literature [5-7]. These criteria are not intended to provide the abso- lute quality of a segmentation: they serve just to com- pare, using a given criterion, different segmentation algorithms applied to the same image, or to set up an algorithm to adjust its parameters to provide the best result. It should be noted that classification with a particular criterion, different algorithms of segmentation can be changed if we change the criterion. Similarly, a choice of parameters optimizes a segmentation algorithm, with respect to a given criterion it may be changed if we change the evaluation criterion. Throughout this paper, the image segment will be denoted I. After segmentation, we get an image , formed with N regions , where i S{1, ,} iN , checking the properties: 1 s ij N i SS SI (1) 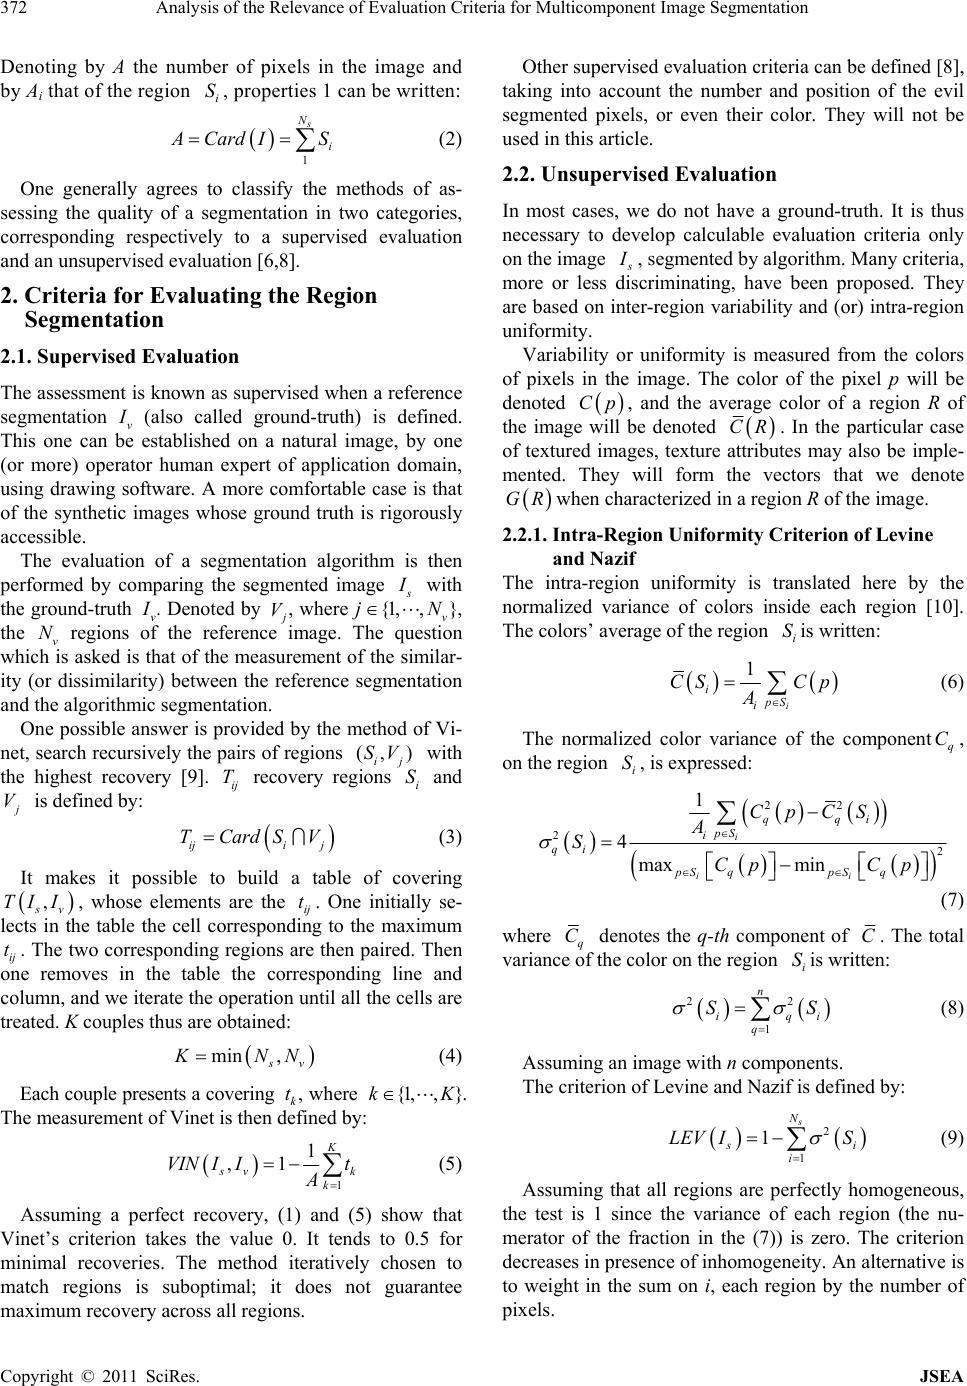 Analysis of the Relevance of Evaluation Criteria for Multicomponent Image Segmentation 372 Denoting by A the number of pixels in the image and by Ai that of the region , properties 1 can be written: i S 1 s N i Card IS (2) One generally agrees to classify the methods of as- sessing the quality of a segmentation in two categories, corresponding respectively to a supervised evaluation and an unsupervised evaluation [6,8]. 2. Criteria for Evaluating the Region Segmentation 2.1. Supervised Evaluation The assessment is known as supervised when a reference segmentation v (also called ground-truth) is defined. This one can be established on a natural image, by one (or more) operator human expert of application domain, using drawing software. A more comfortable case is that of the synthetic images whose ground truth is rigorously accessible. The evaluation of a segmentation algorithm is then performed by comparing the segmented image with the ground-truth v . Denoted by j, where, the v regions of the reference image. The question which is asked is that of the measurement of the similar- ity (or dissimilarity) between the reference segmentation and the algorithmic segmentation. V{1 } v , ,jN N One possible answer is provided by the method of Vi- net, search recursively the pairs of regions with the highest recovery [9]. recovery regions and (, ) ij SV i S ij T V is defined by: iji j TCardSV (3) It makes it possible to build a table of covering , v TII t , whose elements are the ij . One initially se- lects in the table the cell corresponding to the maximum ij . The two corresponding regions are then paired. Then one removes in the table the corresponding line and column, and we iterate the operation until all the cells are treated. K couples thus are obtained: t min , v NN (4) Each couple presents a covering k, where t{1,, }kK . The measurement of Vinet is then defined by: 1 1 ,1 K v k VIN IIt A k (5) Assuming a perfect recovery, (1) and (5) show that Vinet’s criterion takes the value 0. It tends to 0.5 for minimal recoveries. The method iteratively chosen to match regions is suboptimal; it does not guarantee maximum recovery across all regions. Other supervised evaluation criteria can be defined [8], taking into account the number and position of the evil segmented pixels, or even their color. They will not be used in this article. 2.2. Unsupervised Evaluation In most cases, we do not have a ground-truth. It is thus necessary to develop calculable evaluation criteria only on the image , segmented by algorithm. Many criteria, more or less discriminating, have been proposed. They are based on inter-region variability and (or) intra-region uniformity. Variability or uniformity is measured from the colors of pixels in the image. The color of the pixel p will be denoted Cp, and the average color of a region R of the image will be denoted CR. In the particular case of textured images, texture attributes may also be imple- mented. They will form the vectors that we denote GRwhen characterized in a region R of the image. 2.2.1. Intra-Region Uniformity Criterion of Levine and Nazif The intra-region uniformity is translated here by the normalized variance of colors inside each region [10]. The colors’ average of the region is written: i S 1 i ipS i CS Cp A (6) The normalized color variance of the component, on the region , is expressed: q C i S 22 2 2 1 4 max min i ii qqi pS i qi pS qpSq CpCS A SCp Cp (7) where q C denotes the q-th component of C. The total variance of the color on the region is written: i S 22 1 n iq q S i S (8) Assuming an image with n components. The criterion of Levine and Nazif is defined by: 2 1 1 s N i i LEV IS (9) Assuming that all regions are perfectly homogeneous, the test is 1 since the variance of each region (the nu- merator of the fraction in the (7)) is zero. The criterion decreases in presence of inhomogeneity. An alternative is to weight in the sum on i, each region by the number of pixels. Copyright © 2011 SciRes. JSEA 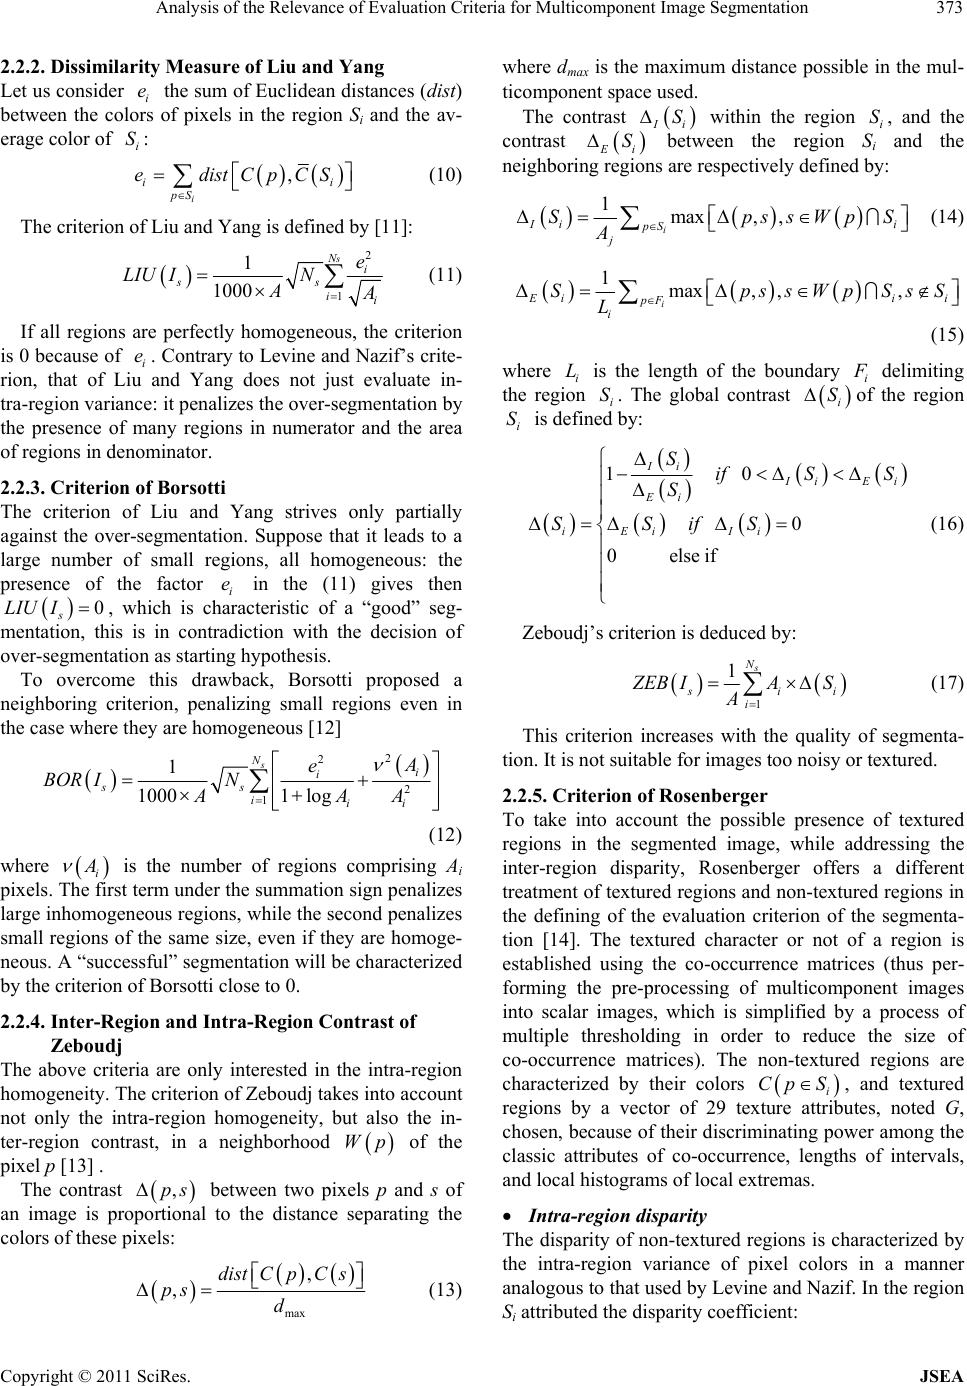 Analysis of the Relevance of Evaluation Criteria for Multicomponent Image Segmentation373 2.2.2. Dissimil ari t y Meas ure of Liu and Yang Let us consider i the sum of Euclidean distances (dist) between the colors of pixels in the region Si and the av- erage color of : e i S , i ii pS edistCpCS (10) The criterion of Liu and Yang is defined by [11]: 2 1 1 1000 sNi ss ii e LIUIN A (11) If all regions are perfectly homogeneous, the criterion is 0 because of i. Contrary to Levine and Nazif’s crite- rion, that of Liu and Yang does not just evaluate in- tra-region variance: it penalizes the over-segmentation by the presence of many regions in numerator and the area of regions in denominator. e 2.2.3. Criterion of Borsotti The criterion of Liu and Yang strives only partially against the over-segmentation. Suppose that it leads to a large number of small regions, all homogeneous: the presence of the factor i in the (11) gives then , which is characteristic of a “good” seg- mentation, this is in contradiction with the decision of over-segmentation as starting hypothesis. e 0 s LIUI To overcome this drawback, Borsotti proposed a neighboring criterion, penalizing small regions even in the case where they are homogeneous [12] 2 2 2 1 1 10001 log s Ni i ss iii e BOR IN AA A (12) where i is the number of regions comprising Ai pixels. The first term under the summation sign penalizes large inhomogeneous regions, while the second penalizes small regions of the same size, even if they are homoge- neous. A “successful” segmentation will be characterized by the criterion of Borsotti close to 0. 2.2.4. Inter-Region and Intra-Region Contrast of Zeboudj The above criteria are only interested in the intra-region homogeneity. The criterion of Zeboudj takes into account not only the intra-region homogeneity, but also the in- ter-region contrast, in a neighborhood of the pixel p [13] . Wp The contrast between two pixels p and s of an image is proportional to the distance separating the colors of these pixels: ,ps max , ,dist CpC s ps d (13) where dmax is the maximum distance possible in the mul- ticomponent space used. The contrast i S within the region i, and the contrast S i between the region Si and the neighboring regions are respectively defined by: S 1max, , i ii pS j SpssW A pS (14) 1max,,, i ii pF i SpssWp L i SsS (15) where i is the length of the boundary i L delimiting the region i. The global contrast of the region is defined by: S i S i S 10 0 0elseif Ii iEi Ei iEi Ii SifS S S SSifS (16) Zeboudj’s criterion is deduced by: 1 1s N i ii EB IAS A (17) This criterion increases with the quality of segmenta- tion. It is not suitable for images too noisy or textured. 2.2.5. Criter ion of Rosenberger To take into account the possible presence of textured regions in the segmented image, while addressing the inter-region disparity, Rosenberger offers a different treatment of textured regions and non-textured regions in the defining of the evaluation criterion of the segmenta- tion [14]. The textured character or not of a region is established using the co-occurrence matrices (thus per- forming the pre-processing of multicomponent images into scalar images, which is simplified by a process of multiple thresholding in order to reduce the size of co-occurrence matrices). The non-textured regions are characterized by their colors , and textured regions by a vector of 29 texture attributes, noted G, chosen, because of their discriminating power among the classic attributes of co-occurrence, lengths of intervals, and local histograms of local extremas. i Cp S Intra-region disparity The disparity of non-textured regions is characterized by the intra-region variance of pixel colors in a manner analogous to that used by Levine and Nazif. In the region Si attributed the disparity coefficient: Copyright © 2011 SciRes. JSEA  Analysis of the Relevance of Evaluation Criteria for Multicomponent Image Segmentation Copyright © 2011 SciRes. JSEA 374 i i DS S (18) given by: 1 1s Ni s i s A DI DS NA calculated using Equations (6) to (8). Ei (24) For the textured regions, the attributes used are not any more the colors, but the vectors of texture . Their calculation of the coefficient of disparity i GS i DS as- sociated with textured regions is more complex, and will not be detailed here, because all the images used in the continuation of this work will be considered non-textured. The interested reader may however see reference [14]. Criterion of Rosenberger Finally, the criterion of Rosenberger is defined by: 1 2 sE s DI DI ROS I s (25) The global intra-region disparity is given by: This criterion decreases when the segmentation quality increases. A sub-segmentation is penalized through an intra-region disparity D strong, and over-segmentation will be through an inter-region disparity D low. 1 1s Ni s i s A DI DS NA Ii (19) 3. Analysis of Unsupervised Evaluation Criteria, Results and Discussion Inter-region disparity Between two non-textured regions, the disparity is pro- portional to the distance separating the average colors of the two regions: The behavior of the above criteria will be studied using synthetic images constituted of regions of uniform color, perfectly controlled: their segmentation in region is thus known. The segmented image and the ground-truth being rigorously similar, it is unnecessary to examine the be- havior of Vinet’s criterion, which will systematically give a result equal to 0 (perfect overlap). Only then we will study the unsupervised evaluation criteria (except that of Liu and Yang: we have preferred to him that of Borsotti, which is an improvement). The window W used to calculate Zeboudj’s criterion here is a window of size 3 × 3 (neighboring order 8). To calculate Rosenberger’s criterion, all regions will be considered non-textured. max , ,ij ij dist C SC S DSS d (20) where dmax is the maximum distance possible in the mul- ticomponent space used. Between two textured regions, disparity takes into ac- count the textural distance vectors, and their norm. , ,ij ij ij dGS GS DSS GS GS (21) 3.1. Characteristics of Synthetic Images Used Between two regions one of which is textured and the other not, the disparity is set to: The test images are 4 synthetic images shown in Figure 1 and whose detailed composition is described in Table 1 . Their segmentation (shown in false color to better high- light the regions) is shown in Figure 2. , ij DSS1 (22) If we denote 1i iiq the set of i neighboring regions of i. The inter-region disparity of the region is written: {,, }SS q S i SThe first two images (Synt1a_Lisa and Synt1b_Lisa) present two uniform regions, of different sizes. The col- ors of these regions are clearly separated for the image Synt1a_Lisa, and otherwise very similar (and indistin- guishable to the eye) for the image Synt1b_Lisa. The last two images (Synt2a_Lisa and Synt2b_Lisa) present three 1 1, qi i i ji i DS DSS q ij (23) and the global inter-region disparity of the image Is is Synt1a_Lisa Synt1b_Lisa Synt2a_Lisa Synt2b_Lisa Figure 1. Synthetic images.  Analysis of the Relevance of Evaluation Criteria for Multicomponent Image Segmentation375 Seg(Synt1a_Lisa) Seg(Synt1b_Lisa) Seg(Synt2a_Lisa) Seg(Synt2b_Lisa) Figure 2. Result (in arbitrary colors) of the segmentation. Table 1. Building of synthetic images of Figure 1. (a) Building of synthetic images Synt1a_Lisa Synt1b_Lisa R G B Population R V B Population 51 0 204 51200 203 101 0 14336 204 102 0 14336 204 102 0 51200 (b) uniform regions. On the Synt2a_Lisa image, two regions have neigh- boring colors (and indistinguishable with the eye) and Different sizes, higher than that of the third region, from which the color is distant. On the Synt2b_Lisa image, two regions are identical in size, equal to half of that of the third region: the colors of the two regions of identical size are very close one to the other (indiscernible to the eye), and far away from the color of the third. 3.2. Calculation and Analysis of Criteria Evaluation for Segmentation The evaluation criteria for unsupervised segmentation, computed for these images, take the values reported in Table 2. Each region is of uniform color, Levine’s criterion re- turns the possible maximum value 1, as expected. For the same reason, Borsotti’s test is sensitive only to the size of regions and the number of regions with the same size (second term under the summation sign in (12)). Segmentation provides a partition exactly the same for the first two images, and consequently, the criteria of Borsotti are identical in both cases. Compared to the first two images, the latter two are penalized by the criterion of Borsotti (which increases), because the number of regions increases from 2 to 3. The fourth image is most penalized than the third because it has two regions of identical size (parameter ν of Borsotti’s criterion). Table 2. Value of evaluation criteria for unsupervised seg- mentation for synthetic images of Figure 1. Criterion Image Levine and Nazif Borsotti Zeboudj Rosenberger Synt1a_Lisa1 1,13.10–16 0,6000 0,3500 Synt1b_Lisa1 1,13.10–16 0,0026 0,4993 Synt2a_Lisa1 2,17.10–16 0,1957 0,4584 Synt2b_Lisa1 8,12.10–16 0,6753 0,3873 Building of synthetic images Synt2a_Lisa Synt2b_Lisa R G B Population R V B Population 21 250 0 21200 20 20 20 16384 23 250 0 30000 22 20 20 16384 51 50 54 14336 250 250 250 32768 As each region is uniform in color, the internal con- trast of regions is zero, and Zeboudj criterion no longer considers the contrast between a region and its neighbors. It penalizes the image Synt1b_Lisa (ZEB = 0.0026) compared to the image Synt1a_Lisa (ZEB = 0.6000). The same reasoning, with the same conclusions can be made with the criterion of Rosenberger. 3.3. Influence of Inter-Class Colorimetric Distance and the Popul ation of Regions Consider a square image of a hand consisting of two homogeneous regions of color respective C1 and C2 which n components are coded from levels 0 to 21 q . The position of the boundary between the two regions is marked by a variable x ( Figure 3) proportional to the population of both regions. We find generalize the model of images Synt1a_Lisa and Synt1b_Lisa of Figure 1. The calculation of the evaluation criteria for segmentation provides here the following results: 1LEV (26) 62 2 6 21 1 2 1000 1 32 21 2 1000 if x ax x BOR if x a 1 (27) 12 max , 1dist CC ZEB ad (28) Copyright © 2011 SciRes. JSEA 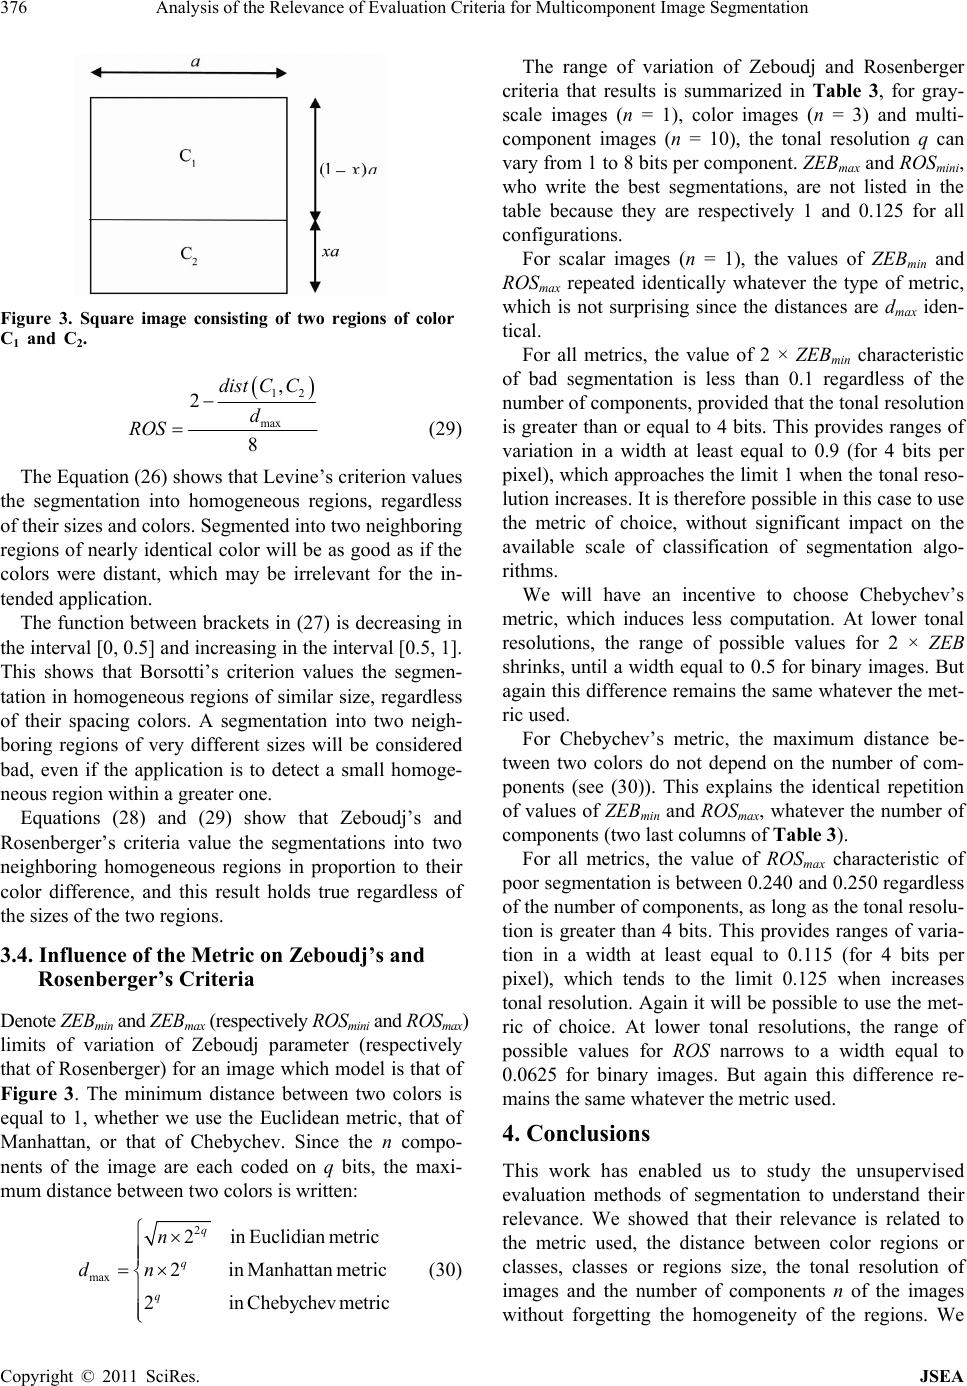 Analysis of the Relevance of Evaluation Criteria for Multicomponent Image Segmentation 376 Figure 3. Square image consisting of two regions of color C1 and C2. 12 max , 2 8 dist CC d ROS (29) The Equation (26) shows that Levine’s criterion values the segmentation into homogeneous regions, regardless of their sizes and colors. Segmented into two neighboring regions of nearly identical color will be as good as if the colors were distant, which may be irrelevant for the in- tended application. The function between brackets in (27) is decreasing in the interval [0, 0.5] and increasing in the interval [0.5, 1]. This shows that Borsotti’s criterion values the segmen- tation in homogeneous regions of similar size, regardless of their spacing colors. A segmentation into two neigh- boring regions of very different sizes will be considered bad, even if the application is to detect a small homoge- neous region within a greater one. Equations (28) and (29) show that Zeboudj’s and Rosenberger’s criteria value the segmentations into two neighboring homogeneous regions in proportion to their color difference, and this result holds true regardless of the sizes of the two regions. 3.4. Influence of the Metric on Zeboudj’s and Rosenberger’s Criteria Denote ZEBmin and ZEBmax (respectively ROSmini and ROSmax) limits of variation of Zeboudj parameter (respectively that of Rosenberger) for an image which model is that of Figure 3. The minimum distance between two colors is equal to 1, whether we use the Euclidean metric, that of Manhattan, or that of Chebychev. Since the n compo- nents of the image are each coded on q bits, the maxi- mum distance between two colors is written: 2 max 2inEuclidianmetric 2 inManhattanmetric 2in Chebychev metric q q q n dn (30) The range of variation of Zeboudj and Rosenberger criteria that results is summarized in Table 3, for gray- scale images (n = 1), color images (n = 3) and multi- component images (n = 10), the tonal resolution q can vary from 1 to 8 bits per component. ZEBmax and ROSmini, who write the best segmentations, are not listed in the table because they are respectively 1 and 0.125 for all configurations. For scalar images (n = 1), the values of ZEBmin and ROSmax repeated identically whatever the type of metric, which is not surprising since the distances are dmax iden- tical. For all metrics, the value of 2 × ZEBmin characteristic of bad segmentation is less than 0.1 regardless of the number of components, provided that the tonal resolution is greater than or equal to 4 bits. This provides ranges of variation in a width at least equal to 0.9 (for 4 bits per pixel), which approaches the limit 1 when the tonal reso- lution increases. It is therefore possible in this case to use the metric of choice, without significant impact on the available scale of classification of segmentation algo- rithms. We will have an incentive to choose Chebychev’s metric, which induces less computation. At lower tonal resolutions, the range of possible values for 2 × ZEB shrinks, until a width equal to 0.5 for binary images. But again this difference remains the same whatever the met- ric used. For Chebychev’s metric, the maximum distance be- tween two colors do not depend on the number of com- ponents (see (30)). This explains the identical repetition of values of ZEBmin and ROSmax, whatever the number of components (two last columns of Table 3). For all metrics, the value of ROSmax characteristic of poor segmentation is between 0.240 and 0.250 regardless of the number of components, as long as the tonal resolu- tion is greater than 4 bits. This provides ranges of varia- tion in a width at least equal to 0.115 (for 4 bits per pixel), which tends to the limit 0.125 when increases tonal resolution. Again it will be possible to use the met- ric of choice. At lower tonal resolutions, the range of possible values for ROS narrows to a width equal to 0.0625 for binary images. But again this difference re- mains the same whatever the metric used. 4. Conclusions This work has enabled us to study the unsupervised evaluation methods of segmentation to understand their relevance. We showed that their relevance is related to the metric used, the distance between color regions or classes, classes or regions size, the tonal resolution of images and the number of components n of the images without forgetting the homogeneity of the regions. We Copyright © 2011 SciRes. JSEA 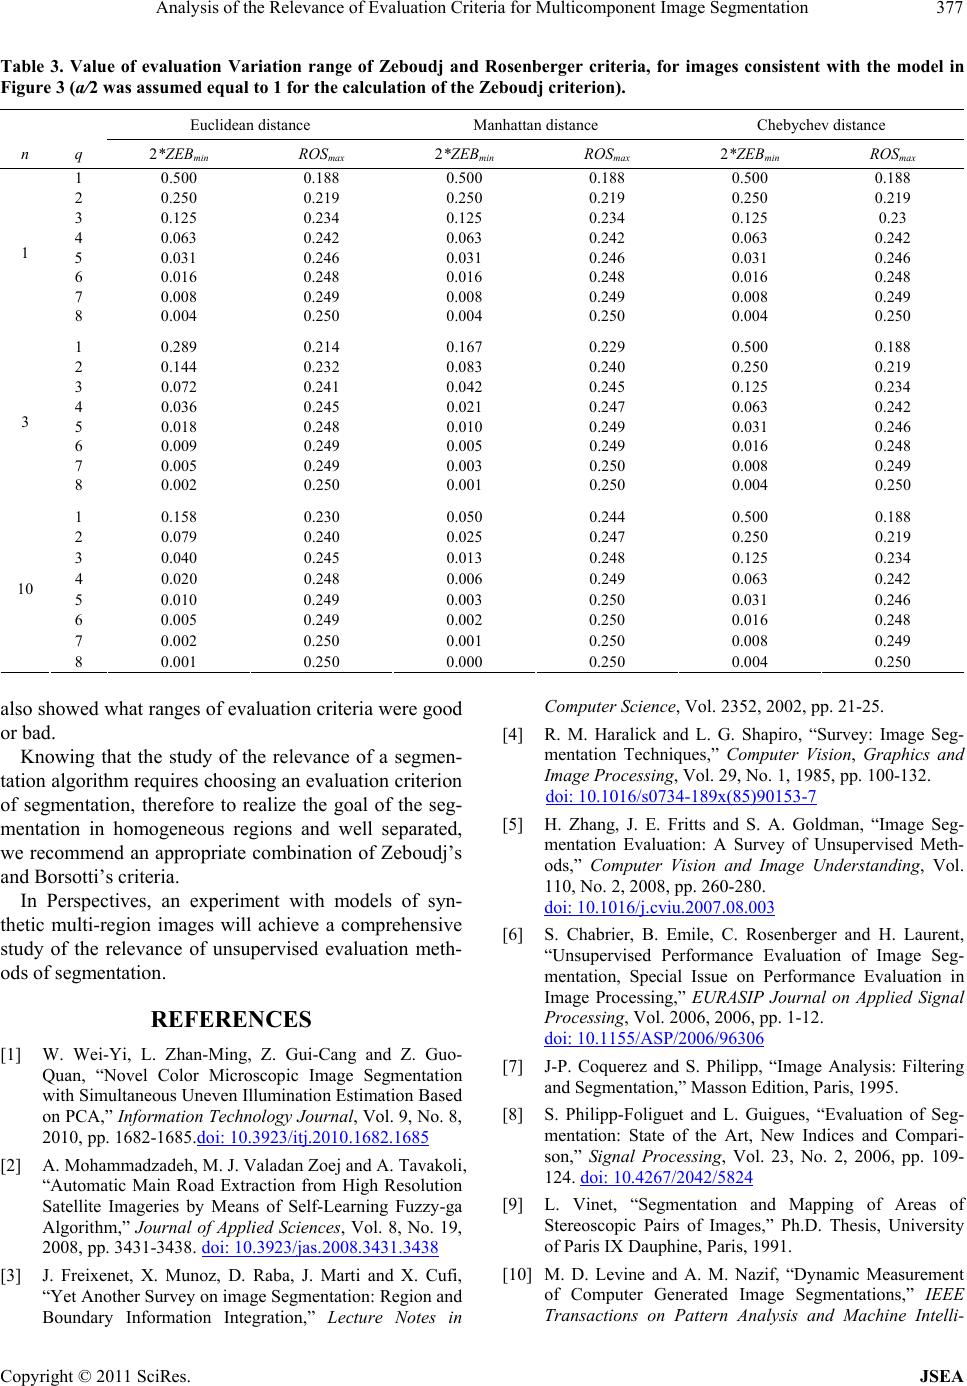 Analysis of the Relevance of Evaluation Criteria for Multicomponent Image Segmentation Copyright © 2011 SciRes. JSEA 377 Table 3. Value of evaluation Variation range of Zeboudj and Rosenberger criteria, for images consistent with the model in Figure 3 (a/2 was assumed equal to 1 for the calculation of the Zeboudj criterion). Euclidean distance Manhattan distance Chebychev distance n q 2*ZEBmin ROSmax 2*ZEBmin ROSmax 2*ZEBmin ROSmax 1 0.500 0.188 0.500 0.188 0.500 0.188 2 0.250 0.219 0.250 0.219 0.250 0.219 3 0.125 0.234 0.125 0.234 0.125 0.23 4 0.063 0.242 0.063 0.242 0.063 0.242 5 0.031 0.246 0.031 0.246 0.031 0.246 6 0.016 0.248 0.016 0.248 0.016 0.248 7 0.008 0.249 0.008 0.249 0.008 0.249 1 8 0.004 0.250 0.004 0.250 0.004 0.250 1 0.289 0.214 0.167 0.229 0.500 0.188 2 0.144 0.232 0.083 0.240 0.250 0.219 3 0.072 0.241 0.042 0.245 0.125 0.234 4 0.036 0.245 0.021 0.247 0.063 0.242 5 0.018 0.248 0.010 0.249 0.031 0.246 6 0.009 0.249 0.005 0.249 0.016 0.248 7 0.005 0.249 0.003 0.250 0.008 0.249 3 8 0.002 0.250 0.001 0.250 0.004 0.250 1 0.158 0.230 0.050 0.244 0.500 0.188 2 0.079 0.240 0.025 0.247 0.250 0.219 3 0.040 0.245 0.013 0.248 0.125 0.234 4 0.020 0.248 0.006 0.249 0.063 0.242 5 0.010 0.249 0.003 0.250 0.031 0.246 6 0.005 0.249 0.002 0.250 0.016 0.248 7 0.002 0.250 0.001 0.250 0.008 0.249 10 8 0.001 0.250 0.000 0.250 0.004 0.250 also showed what ranges of evaluation criteria were good or bad. Knowing that the study of the relevance of a segmen- tation algorithm requires choosing an evaluation criterion of segmentation, therefore to realize the goal of the seg- mentation in homogeneous regions and well separated, we recommend an appropriate combination of Zeboudj’s and Borsotti’s criteria. In Perspectives, an experiment with models of syn- thetic multi-region images will achieve a comprehensive study of the relevance of unsupervised evaluation meth- ods of segmentation. REFERENCES [1] W. Wei-Yi, L. Zhan-Ming, Z. Gui-Cang and Z. Guo- Quan, “Novel Color Microscopic Image Segmentation with Simultaneous Uneven Illumination Estimation Based on PCA,” Information Technology Journal, Vol. 9, No. 8, 2010, pp. 1682-1685.doi: 10.3923/itj.2010.1682.1685 [2] A. Mohammadzadeh, M. J. Valadan Zoej and A. Tavakoli, “Automatic Main Road Extraction from High Resolution Satellite Imageries by Means of Self-Learning Fuzzy-ga Algorithm,” Journal of Applied Sciences, Vol. 8, No. 19, 2008, pp. 3431-3438. doi: 10.3923/jas.2008.3431.3438 [3] J. Freixenet, X. Munoz, D. Raba, J. Marti and X. Cufi, “Yet Another Survey on image Segmentation: Region and Boundary Information Integration,” Lecture Notes in Computer Science, Vol. 2352, 2002, pp. 21-25. [4] R. M. Haralick and L. G. Shapiro, “Survey: Image Seg- mentation Techniques,” Computer Vision, Graphics and Image Processing, Vol. 29, No. 1, 1985, pp. 100-132. doi: 10.1016/s0734-189x(85)90153-7 [5] H. Zhang, J. E. Fritts and S. A. Goldman, “Image Seg- mentation Evaluation: A Survey of Unsupervised Meth- ods,” Computer Vision and Image Understanding, Vol. 110, No. 2, 2008, pp. 260-280. doi: 10.1016/j.cviu.2007.08.003 [6] S. Chabrier, B. Emile, C. Rosenberger and H. Laurent, “Unsupervised Performance Evaluation of Image Seg- mentation, Special Issue on Performance Evaluation in Image Processing,” EURASIP Journal on Applied Signal Processing, Vol. 2006, 2006, pp. 1-12. doi: 10.1155/ASP/2006/96306 [7] J-P. Coquerez and S. Philipp, “Image Analysis: Filtering and Segmentation,” Masson Edition, Paris, 1995. [8] S. Philipp-Foliguet and L. Guigues, “Evaluation of Seg- mentation: State of the Art, New Indices and Compari- son,” Signal Processing, Vol. 23, No. 2, 2006, pp. 109- 124. doi: 10.4267/2042/5824 [9] L. Vinet, “Segmentation and Mapping of Areas of Stereoscopic Pairs of Images,” Ph.D. Thesis, University of Paris IX Dauphine, Paris, 1991. [10] M. D. Levine and A. M. Nazif, “Dynamic Measurement of Computer Generated Image Segmentations,” IEEE Transactions on Pattern Analysis and Machine Intelli-  Analysis of the Relevance of Evaluation Criteria for Multicomponent Image Segmentation 378 gence, Vol. 7, No. 2, 1985, pp. 155-164. doi: 10.1109/TPAMI.1985.4767640 [11] J. Liu and Y.-H. Yang, “Multiresolution Color Image Segmentation,” IEEE Transactions on PAMI, Vol. 16, No. 7, 1994, pp. 689-700. doi: 10.1109/34.297949 [12] M. Borsotti, P. Campadelli and R. Schettini, “Quantita- tive Evaluation of Color Image Segmentation Results,” Pattern Recognition Letters, Vol. 19, No. 8, 1998, pp. 741-747. doi: 10.1016/S0167-8655(98)00052-X [13] R. Zeboudj, “Filtering, Automatic Thresholding, Contrast and Contours: The Pre-Treatment with the Image Analy- sis,” Ph.D. Thesis, University of Saint Etienne, Saint Etienne, 1988. [14] C. Rosenberger, “Adaptative Evaluation of Image Seg- mentation Results,” 18th International Conference on Pattern Recognition, Vol. 2, 2006, pp. 399-402. doi: 10.1109/ICPR.2006.214 Copyright © 2011 SciRes. JSEA
|