Paper Menu >>
Journal Menu >>
 J. Biomedical Science and Engineering, 2011, 4, 479-482 JBiSE doi:10.4236/jbise.2011.46060 Published Online June 2011 (http://www.SciRP.org/journal/jbise/). Published Online June 2011 in SciRes. http://www.scirp.org/journal/JBiSE Phase space in EEG signals of women refferred to meditation clinic Ateke Goshvarpour1, Atefeh Goshvarpour1, Saeed Rahati2, Vahid Saadatian3, Minoo Morvarid4 1Department of Biomedical Engineering, Islamic Azad University, Mashhad Branch, Iran; 2Department of Electronic Engineering, Islamic Azad University, Mashhad Branch, Iran; 3Department of Psychology, Islamic Azad University, Mashhad Branch, Iran; 4Headmaster of Meditation Clinic, Mashhad, Iran. Email: atefeh.goshvarpour@gmail.com Received 24 December 2010; revised 18 February 2011; accepted 10 May 2011. ABSTRACT Poincare plots are commonly used to study the non- linear behavior of physiological signals. In the time series analysis, the width of Poincare plots can be considered as a criterion of short-term variability in signals. The hypothesis that Poincare plot indexes of electroencephalogram (EEG) signals can detect dy- namic changes during meditation was examined in sixteen healthy women. Therefore, the aim of this study is to evaluate the effect of different lags on the width of the Poincare plots in EEG signals during meditation. Poincare plots with six different lag (1-6) were constructed for two sets of data and the width of the Poincare plot for each lag was calculated. The results show that during meditation the width of Poincare plots tended to increase as the lag increased. The Poincare plot is a quantitative visual tool which can be applied to the analysis of EEG data gathered over relatively short time periods. The simplicity of the width of Poincare plot calculation and its' adap- tation to the chaotic nature of the biological signals could be useful to evaluate EEG signals during me- ditation. Keywords: Electroen cephalogram; Meditation; Poincare Plots; Nonlinear Dynamics 1. INTRODUCTION Meditation, a technique that frees the mind from distrac- tions and allows for communication with the Master Within, can lead to numerous physical, mental and spi- ritual benefits. Meditation is a unique state of con- sciousness with associated changes in the physiological and psychological functions in the brain. Some research has shown that meditation characterized by marked re- ductions in metabolic activity, increased orderliness and integration of brain functioning, decreased peripheral vascular resistance, and increased cerebral blood flow. In addition, meditation produces comprehensive improve- ments in mental health, enhancing positive features, and reducing v a rious fo r ms of psychological dist r e ss [ 1]. The electroencephalogram (EEG) signals reflect the electrical activity of the brain. The study of the brain electrical activity, through the electroencephalographic records, is one of the most important tools for the diag- nosis of neurological diseases. The initial time series analysis based on statistical indexes was soon replaced by more sophisticated analysis capable of extracting more information of the signal. Since the dynamics of the brain system are chaotic, nonlinear methods have been applied to the analysis of EEG signals. One of these techniques is the Poincare plot. This technique was first used as a qualitative tool and later, the quantification of the Poincare plot geome- try was proposed. In previous studies, Poincare plot is extensively used for qualitative visualization of heart rate signals. Tulppo et al. [2] fit an ellipse to the shape of the Poincare plot in order to calculate heart rate indices. Brennan et al. [3] demonstrate that the width of the Poincare plot indicates the level of short-term variability in h eart rate signals. A number of variations have been proposed, in order to optimize the use of the Poincare plot as a quantitative tool [4,5]. One of them is the lagged Poincare plot. The conventional plot has two dimensions and a lag of one interval, i.e., each point on the plot consists of a pair of successive intervals (RRi, RRi+1). Lerma et al. [6] used longer lags (RRi, RRi+t with 1 t 8) to analyze HRV in chronic renal failure patients. Contreras et al. [4] showed that lagged Poincare widths and spectral indices might be useful to distinguish normal from pathological heart rate signals. Thakre and Smith [7] used lags from 1 to 10 for heart rate analysis in patients with chronic heart fail-  A. Goshvarpour et al. / J. Biomedical Science and Engineering 4 (2011) 479-482 Copyright © 2011 SciRes. JBiSE 480 ure. Other investigators have reported systematic changes in EEG trajectories associated with the seizure onset [8]. We felt that such changes might also be found in the EEG during meditation. Because of its sensitivity to the state of a system, the Poincare trajectory is potentially valuable for visualizing changes such as the transition from the normal state to meditation. We decided to ex- plore Poincare trajectories associated with this transition, and to describe the changes systematically that were evident, in the Poincare plots. However mathematical manipulations of the EEG have failed to give way to visual inspection as a primary clinical tool. Therefore, we were interested in the possible value of this visual tool, which is based on current concepts from nonlinear dynamic analysis, but has the advantage of providing detailed information that can be scrutinized by the hu- man eye. Since these trajectories may provide a new way to characterize, describe, and quantify EEG dynamics, we wished to evaluate their possible usefulness in the specific psycho-physiological state. The aim of the present study was to evaluate the width of the Poincare plot with different lags on EEG signals during meditation. For this purpose, we used the EEG signals of two groups of subjects (before meditation and during meditation). Poincare plots with six different lag (1-6) were constr uc ted and the w idth of th e Poin car e plot for each lag was calculated. The outline of this study is as follows. At first, we briefly describe the sets of the EEG signals used in our study. Then, we explain the Poincare plot and its' width. Finally, we present the results of analysis of Poincare plots with six different lags (1-6), and we conclude the study. 2. METHOD 2.1. Dat a C ollection Subjects were considered to be at an advanced level of meditation training. The sixteen meditators, took part in the study (women, age range 30 - 53, mean 38.19 years). The subjects were in good general health and did not follow any specific heart diseases. The subjects were asked not to eat salty or fat foods before meditation practices or data recording. Informed written consent was obtained from each subject after the experimental procedures had been explained. The experimental procedure was divided into two dif- ferent stages: Subjects were first instructed to sit quietly for 5 minutes and kept their eyes closed. After that, they performed meditation. Meditation prescribes a certain bodily posture. They sit on a cushion 5 to 10 centimeters thick that is placed on blanket. They cross their legs so that one foot rests on the opposite thigh with the sole of their foot turned up and with their knees touching the blanket (lotus or half-lotus position). The torso should be kept straight, but it should not be strained. The head should be kept high with eyes closed. During this session, the meditators sat quietly, liste ning to the guidance of the physician and focusing on the breat h . The meditation EEG signals were recorded in medita- tion clinic using 16-channel Powerlab (manufactured by ADInstruments). EEG activity was recorded using three electrodes (i.e., Fz, Cz and Pz) according to the Interna- tional 10-20 System, referenced to linked ear lobe elec- trodes. The monitoring system hardware filters band passed data in range: 0.1 - 50 Hz for EEG time series. A digital notch filter was applied to the data at 50 Hz to remove any artifacts caused by alternating current line noise. The sampling rate was 400 H z. 2.2. Poincare Plots Poincare plot is a geometrical representation of a time series in a Cartesian plane. A two dimensional plot con- structed by plotting consecutive points is a representa- tion of time series on phase space or Cartesian plane [5]. A standard Poincare plot of EEG signal is shown in Figure 1. Two basic descriptors of the plot are SD1 and SD2. The line of identity is the 45° imaginary diagonal line on the Poincare plot and the points falling on the imaginary line has the property Xn = Xn+1. SD1 measures the dispersion of points perp endicular to th e line of iden- tity, whereas SD2 measures the dispersion along the line of identity. Fundamentally, SD1 and SD2 of Poincare plot is di- rectly related to the basic statistical measures, standard deviation of time series (SDX), and standard deviation of the successive difference of time series (SDSD), which is given by the relation shown in (1) and (2). 22 110 2XX SD SDSD (1) 2 22 2 21 2012 2XX SD SDXSDSDX (2) Where γX(0) and γX(1) is the autocorrelation function for lag 0 and lag 1 of data intervals and X is the mean of time series intervals. From (1) and (2), it is clear that the measures SD1 and SD2 are actually derived from the correlation and mean of the time series with lag 0 and lag 1. The above equation sets are derived for unit time delay Poincare plot. Researchers have shown interest in plots with different time delays to get a better insight in the time-series signal. Usually the time delay is multiple of the cycle length or the sampling time of the signal [3]. The dependency among the variables is controlled by the choice of time delay, and the most conventional analysis is performed with higher order linear correlation be- 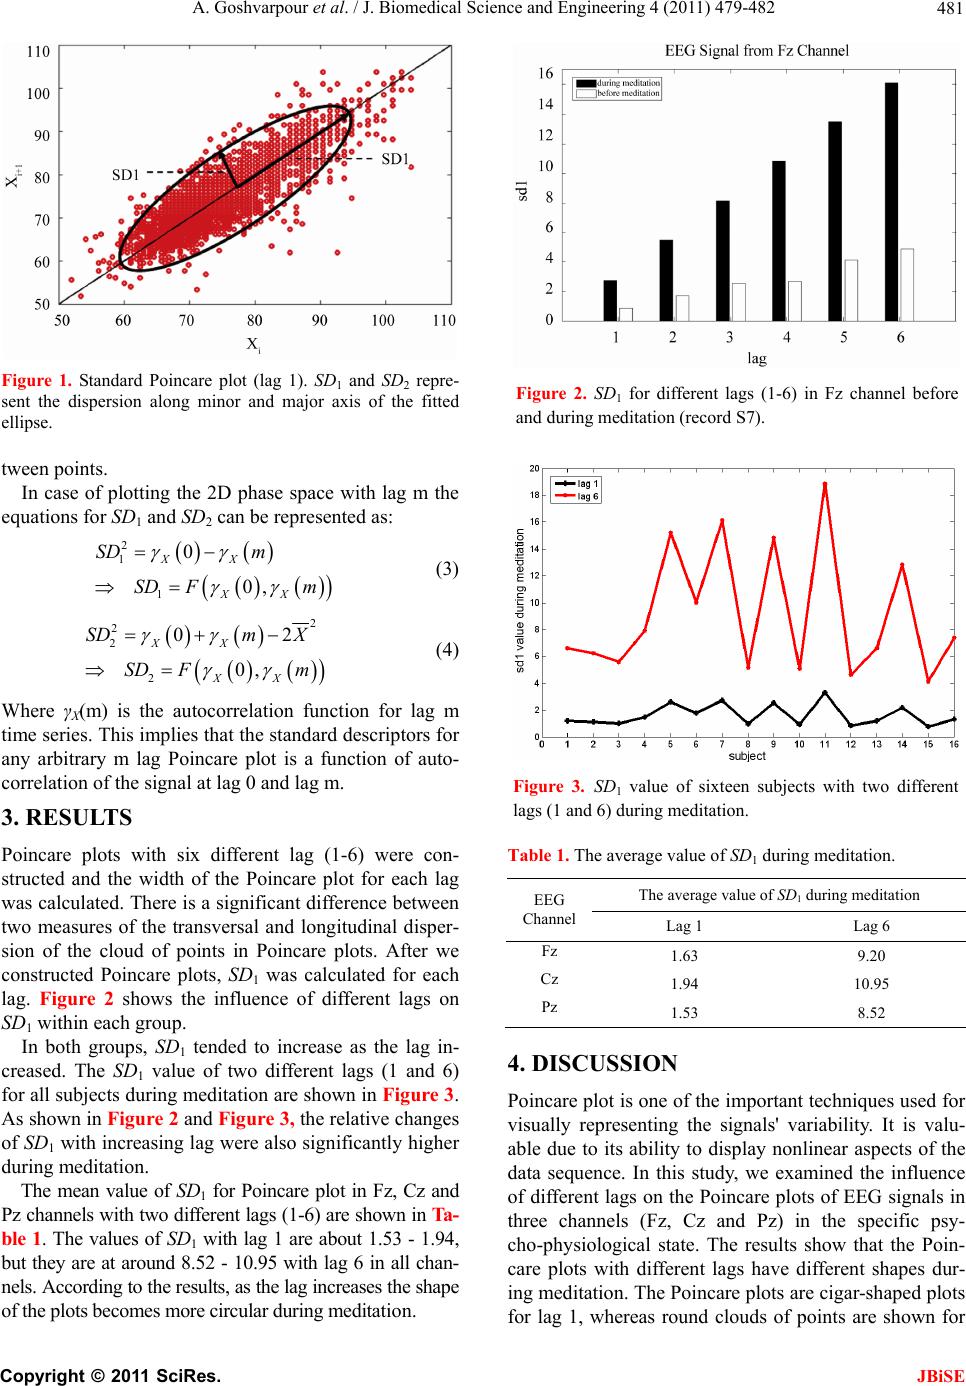 A. Goshvarpour et al. / J. Biomedical Science and Engineering 4 (2011) 479-482 Copyright © 2011 SciRes. JBiSE 481 Figure 1. Standard Poincare plot (lag 1). SD1 and SD2 repre- sent the dispersion along minor and major axis of the fitted ellipse. tween points. In case of plotting the 2D phase space with lag m the equations for SD1 and SD2 can be represented as: 2 1 1 0 0, XX XX SD m SD Fm (3) 2 2 2 2 02 0, XX XX SDm X SD Fm (4) Where γX(m) is the autocorrelation function for lag m time series. This implies that the standard descriptors for any arbitrary m lag Poincare plot is a function of auto- correlation of the signal at lag 0 and lag m. 3. RESULTS Poincare plots with six different lag (1-6) were con- structed and the width of the Poincare plot for each lag was calculated. There is a significant difference between two measures of the transversal and longitudinal disper- sion of the cloud of points in Poincare plots. After we constructed Poincare plots, SD1 was calculated for each lag. Figure 2 shows the influence of different lags on SD1 within each gro up . In both groups, SD1 tended to increase as the lag in- creased. The SD1 value of two different lags (1 and 6) for all subjects during meditatio n are shown in Figure 3. As shown in Figure 2 and Figure 3, the relative changes of SD1 with increasing lag were also significantly higher during meditation. The mean value of SD1 for Poincare plot in Fz, Cz and Pz channels with two different lags (1-6) are shown in Ta- ble 1. The values of SD1 with lag 1 are about 1.53 - 1.94, but they are at around 8.52 - 10.95 with lag 6 in all chan- nels. According to the r esu lts, as th e lag in creases th e shap e of the plots becomes more circular during meditation. Figure 2. SD1 for different lags (1-6) in Fz channel before and during meditation (record S7). Figure 3. SD1 value of sixteen subjects with two different lags (1 and 6) during meditation. Table 1. The average value of SD1 during meditation. The average value of SD1 during meditation EEG Channel Lag 1 Lag 6 Fz 1.63 9.20 Cz 1.94 10.95 Pz 1.53 8.52 4. DISCUSSION Poincare plot is one of the important techniques used for visually representing the signals' variability. It is valu- able due to its ability to display nonlinear aspects of the data sequence. In this study, we examined the influence of different lags on the Poincare plots of EEG signals in three channels (Fz, Cz and Pz) in the specific psy- cho-physiological state. The results show that the Poin- care plots with different lags have different shapes dur- ing meditation. The Poincare plots are cigar-shaped plots for lag 1, whereas round clouds of points are shown for  A. Goshvarpour et al. / J. Biomedical Science and Engineering 4 (2011) 479-482 Copyright © 2011 SciRes. JBiSE 482 higher lags. The reason of this change is, when points are plotted against immediately preceding poin ts (lag 1), the correlation between these will be increased if they were more widely separated. Cigar-shaped plots ex- pressed the high correlation, whereas round clouds of points are typical of lack of correlation. On a lag 1 Poincare plot, SD1 measures the variability from one point of time series to the next. However, when we consider SD1 from Poincare plots with longer lags, the term of the variability is ex tended, from one point of time series to another separated from it by many inter- vals. The longer the distance between these points, the higher the mean time interval between the Poincare p lots points wh i ch are being summari z ed by SD1. The major advantage of the Poincare plots lies in their relative insensitivity to artifacts. In ad dition, the simplic- ity of the width of Poincare plot calculation and its' ad- aptation to the chaotic nature of the biological signals could be useful to evaluate EEG signals during medita- tion. 5. CONCLUSION In this study, we have shown that SD1 tended to increase as the lag increased. The rate of changes in SD1 with increasing lags was also significantly higher during me- ditation (Figure 2). These changes provide supplemen- tary information about th e activity of brain. The comparative dynamic measures of the lagged Poincare plots give more insight of the EEG signals in a specific psycho-physiological state. We propose that these approaches of analysis can be used to improve the analysis of EEG signals. Other indices of Poincare plots like the ratio of SD1/ SD2 or asymmetry in the Poincare plot can be studied in the future. Furthermore, the influence of different lags on Poincare plots during meditation could be analyzed in other biological signals like electrocardiogram and res- piration. 6. ACKNOWLEDGEMENTS We thank Mrs. Shahla Khoshkholgh for her assistance in collecting the data that was used in this investigation. The authors would also like to thank all the subjects for their good collaborations. REFERENCES [1] Rubia, K. (2009) The neurobiology of meditation and its clinical effectiveness in psychiatric disorders. Biological Psychology, 82, 1-11. doi:10.1016/j.biopsycho.2009.04.003 [2] Tulppo, M., Makikallio, T.H., Takala, T.E., Seppanen, T. and Huikuri, H.V. (1996) Quantitative beat-to-beat analysis of heart rate dynamics during exercise. American Journal of Physiology, 271, H244-H252. [3] Brennan, M., Palaniswami, M. and Kamen, P. (2001) Do existing measures of Poincare plot geometry reflect nonlinear features of heart rate variability? IEEE Tran- sactions on Biomedical Engineering, 48, 1342-1347. doi:10.1109/10.959330 [4] Contreras, P., Canetti, R. and Migliaro, E. (2007) Correlations between frequency-domain HRV indices and lagged Poincare plot width in healthy and diabetic subjects. Physiological Measurment, 28, 85-94. doi:10.1088/0967-3334/28/1/008 [5] Karmakar, C., Khandoker, A., Gubbi, J. and Palaniswami, M. (2009) Complex correlation measure: A novel descriptor for Poincare plot. Bio-Medical Engineering, 13, 8-17. [6] Lerma, C., Infant, O., Perez-Grovas, H. and Jose, M. (2003) Poincare plot indexes of heart rate variability capture dynamic adaptations after haemodialysis in chronic renal failure patients. Clinical Physiology and Functional Imaging, 23, 72-80. doi:10.1046/j.1475-097X.2003.00466.x [7] Thakre, T. and Smith, M. (2006) Loss of lag-response curvilinearity of indices of heart rate variability in congestive heart failure. BMC Cardiovascular Disorders, 6, 27. doi:10.1186/1471-2261-6-27 [8] Collura, T., Morris, H.H., Burgess, R.C., Jacobs, E.C. and Klem, G.H. (1992) Phase-plane trajectories of EEG seizure patterns in epilepsy. American Journal of EEG Technology, 32, 295-307. |