Open Journal of Obstetrics and Gynecology, 2011, 1, 25-30
doi:10.4236/ojog.2011.12006 Published Online June 2011 (http://www.SciRP.org/journal/ojog/
OJOG
).
Published Online June 2011 in SciRes. http://www.scirp.org/journal/OJOG
Dietary patterns and risk of cervical cancer: a case-control
study in Uruguay
Eduardo De Stefani1, Gisele Acosta1, Hugo Deneo-Pellegrini1, Alvaro L. Ronco2, María Mendilaharsu1,
Gabriel Landó1, María E. Luaces1, Cecilia Silva1
1Epidemiology Group, Department of Pathology, School of Medicine, Montevideo, Uruguay;
2Department of Epidemiology and Statistics, University of Maldonado, Maldonado, Uruguay.
Email: edestefani@gmail.com
Received 5 May 2011; revised 30 May 2011; accepted 10 June 2011.
ABSTRACT
In the time period 1996-2004, a case-control study on
diet and cervical cancer was conducted at the Na-
tional Cancer Institute in Uruguay. The study in-
cluded 268 cases and 536 controls with non-neoplas-
tic diseases. The foods and beverages in the food-
frequency questionnaire were included in a factor
analytic model. This method retained three factors
which were labeled as the drinker, red meat, and pru-
dent patterns. The model explained 60% of the vari-
ance. Whereas the red me at and drinker patterns were
directly associated with the risk of cervical cancer
(OR for red meat pattern 1.79, 95% CI 1.12-2.86), on
the other hand, the prudent pattern was inversely
associated with cervical cancer (OR 0.60, 95% CI
0.38-0.93). To our knowledge, this study was the first
one using factor analysis in order to elucidate the role
of the d i et in relation with cervical cancer.
Keywords: Dietary Patterns; Cervical Cancer
1. INTRODUCTION
Cervical cancer is the third cancer site in frequency in
Uruguay, following breast cancer and colorectal cancer.
This malignancy shows an age-standardized incidence
rate of 17.5 per 100,000 Uruguayan women [1]. A pre-
vious study conducted in Uruguay showed that cancer of
the uterine cervix presented a steady decline in mortality
from the early fifties until the late eighties [2]. More
precisely, in the time period 1953-1957, this decline
reached mortality rates of 4.4 per 100,000 women,
which implies a relative risk of 0.56.
The main risk factors for cervical cancer are related to
the infection caused by human papilloma virus (HPV)
and related sexual activities. Smoking and other envi-
ronmental risks have been studied in detail [3,4] and
tobacco smoke has been considered a potential carcino-
gen in cervical cancer.
The role of the diet has been examined in a rather
small number of studies and the consistency of the find-
ings is limited [3,5]. In a monograph by the World Can-
cer Research Fund [5] carrots have been suggested as a
possible protective vegetable, but aside from this finding,
little else is known about the role that diet plays in cer-
vical cancer.
Since traditional approaches to research into cervical
cancer have been considered limited due to the high col-
linearity of individual foods or nutrients, we decided to
use factor analysis in this study, in the view that it could
offer a new approach in the etiology of cervical carci-
noma. This analytical method consists of reducing a
large number of foods to a smaller number of factors [6],
and has been employed to date in the study of numerous
cancer sites [6-10]. We considered that this approach
could offer new information regarding the role of diet in
the etiology of cervical carcinoma.
2. SUBJECTS AND METHODS
2.1. Selection of Cases
In the time period 1990-2000 all newly diagnosed and
microscopically confirmed patients with carcinoma of
the cervix were considered eligible for the study. A total
of 274 patients were approached and only 5 refused the
interview, leaving a final total of 268 patients (response
rate 97.8%). Two hundred and sixty (260) patients pre-
sented squamous cell carcinoma of the cervix (97.3%)
and 8 patients showed undifferentiated carcinoma
(2.7%). All the cases were diagnosed by biopsy and were
admitted to the National Institute of Cancer, Uruguay.
2.2. Selection of Controls
In the same time period and in the same Institute, all
female patients with non neoplastic diseases which were
E. D. Stefani et al. / Open Journal of Obstetrics and Gynecology 1 (2011) 25-30
26
not related to tobacco smoking or alcohol drinking and
without recent changes in their diets were considered
eligible for the study. A total of 2,136 patients were
asked for voluntary participation in the study, and 2074
accepted the interview. Only 62 women refused the in-
terview (response rate 97.1%).
From this pool of controls, 536 patients were included
in the study. These controls were randomly selected fol-
lowing a control/case ratio of 2:1 and were frequency
matched to cases on age and residence. These patients
presented the following conditions: sebaceous cyst (140,
26.1%), seborrheic keratosis (130, 24.2%), breast ab-
scess (109, 20.3%), osteomielitis (55, 10.3%), lipoma
(41, 7.6%), injuries (26, 4.9%), varicose veins (16,
3.0%), diseases of the genital tract (11, 2.1%), and hy-
datid cyst (8, 1.5%). All the cases and controls were of
Hispanic White ancestry.
2.3. Inteviews and Questionnaire
All the participants (cases and controls) were inter-
viewed after admission to the Institute by two trained
social workers. Proxy interviews were not accepted. The
patients were administered a structured questionnaire
which included the following sections: sociodemo-
graphics (age, residence, education, income), a complete
occupational history based on the last four jobs, self re-
ported height and weight 5 years prior to the interview, a
complete history of cancer among first-degree relatives,
a complete history of smoking (age at start, age at quit,
number of cigarettes smoked per day, type of tobacco,
type of cigarette), a complete history of alcohol drinking
(age at start, age at quit, number of glasses per day or
week, type of alcoholic beverage), a complete history of
mate consumption (age at start, age at quit, number of
litres of the beverage, mate temperature), menstrual and
reproductive events (age at menarche, age at menopause,
number of livebirths, abortion, age at first pregnancy,
age at last pregnancy, breastfeeding, age at first inter-
course, number of sexual partners), and a food-fre-
quency questionnaire (FFQ) focused on meat consump-
tion, dairy foods, total vegetables and total fruits.
2.4. Statistical Analysis
The food groups were categorized using a Likert-type
scale and were introduced in a factor analysis among
controls. The factor analysis retained three factors [6,11]
after running the scree plot. The factorability was meas-
ured through Cronbach alpha and sampling adequacy
was tested through the Kaiser-Meyer-Olkin statistic. The
factors were then rotated using the orthogonal varimax
method and normalized by the Kaiser procedure. The
factors were scored through the Thompson regression
method [12] and the scores were applied to cases and
controls. The scored patterns were correlated by selected
variables using Spearman rank correlations.
The relative risks of cervical carcinoma was approxi-
mated by the odds ratios, using unconditional multiple
logistic regression [13]. In short, we fitted a model
which included as independent variables the following
terms: age (continuous), residence (categorical), ur-
ban/rural status (categorical), education (categorical),
smoking index (categorical), number of partners (cate-
gorical), age at first intercourse (categorical), total en-
ergy intake (continuous), and all three scored dietary
patterns. The reason for including all four score patterns
is the fact that dietary patterns are conditional on one
another. All the calculations were performed using
STATA [14].
3. RESULTS
The distribution of cases and controls by sociodemo-
graphics and tobacco variables is shown in Ta b l e 1 . As
expected from the matched design, age and residence
were similar among cases and controls. Also, education
and income were similar for both groups of participants.
On the contrary, current smokers showed an odds ratio
of 1.7 (95% CI 1.1-2.7) when compared with never
smokers. Also, an early age at first intercourse and a
high number of sexual partners were directly associated
with risk of cervical cancer (OR for high number of
partners 2.7, 95% CI 1.6-4.4).
The factor loadings matrix for controls is shown in
Table 2. Factor 1 presented high loadings for salted meat,
beer, and hard liquor and was labeled as the drinker pat-
tern. The pattern showed a high negative loading for
wine consumption and the pattern explained 31.8 % of
the variance. Factor 2 displayed high loadings for red
meat, and barbecued meat and high negative loading for
whole milk and was labeled as the red meat pattern. This
pattern explained 16.2% of the variance. Factor 3
showed high loadings for total vegetables and total fruits
and was called the prudent pattern, explaining 12.0% of
the variance. The total variance was 60%, a high value
indeed.
Spearman rank correlations between dietary patterns
and the selected variables are shown in Table 3. The
drinker pattern was inversely associated with age and
directly associated with smoking intensity, years smoked,
and number of sexual partners. The red mea t pattern was
inversely associated with age, and directly associated
with parity, and early age at first intercourse. Finally, the
prudent pattern was highly correlated with education.
Patient characteristics among factor quartiles for con-
trols are shown in Table 4. The drinker pattern displayed
a positive gradient for smoking intensity and number of
sexual partners and an inverse gradient for red meat in-
C
opyright © 2011 SciRes. OJOG
E. D. Stefani et al. / Open Journal of Obstetrics and Gynecology 1 (2011) 25-30
Copyright © 2011 SciRes.
27
OJOG
take. The red meat pattern was negatively associated
with years of education and a clear increased gradient
for means of meat intake. Finally, the prudent pattern
displayed a positive gradient for education, raw vegeta-
bles consumption and an inverse association with red
meat intake.
Table 1. Distribution of cases and controls for sociodemographics, tobacco use, and sexual events.
Cases Controls
Variable Category No % N
o % Global p-value
Age (years) 20 - 29 10 3.7 20 3.7
30 - 39 55 20.5 110 20.5
40 - 49 74 27.6 148 27.6
50 - 59 56 20.9 112 20.9
60 - 69 51 19.0 102 19.0
70 - 79 16 6.0 32 6.0
80 - 89 6 2.2 12 2.2 1.00
Residence Montevideo 138 51.5 276 51.5
Other counties 130 48.5 260 48.5 1.00
Percentage of rural patients Urban 246 91.8 491 91.6
Rural 22 8.2 45 8.4 0.93
Education (yrs) 0 - 3 60 22.4 125 23.3
4 - 6 138 31.5 264 49.3
7 + 70 26.1 147 27.4 0.84
Income (U$D) < = 67 76 28.4 162 30.2
68 + 101 37.7 200 37.3
Unknown 91 33.9 174 32.5 0.85
Smoking Never smokers 151 56.3 324 62.3
Former 25 9.3 66 12.3
Current 1 - 14 43 16.1 70 13.1
Current 15 + 49 18.3 66 12.3 0.04
Age at first intercourse 30 + 4 1.5 41 7.6
20 - 29 62 22.1 215 40.1
15 - 19 179 66.8 261 48.7
< = 14 23 8.6 19 3.5 <0.0001
No partners 0 - 1 102 38.1 281 53.5
2 88 32.8 152 28.4
3 37 13.8 54 10.1
4 + 41 15.3 43 8.0 <0.0001
No patients 268 100.0 536 100.0
Table 2. Factor loadings matrix among controls1.
Drinker Red meat Prudent
Food groups Factor 1 Factor 2 Factor 3
Red meat 0.02 0.52 0.36
Salted meat 0.50 0.03 0.02
Barbecued meat 0.00 0.41 0.03
Processed meat 0.03 0.31 0.11
Whole milk 0.02 0.57 0.39
Total vegetables 0.02 0.04 0.61
Total fruits 0.04 0.08 0.56
Beer 0.51 0.02 0.02
Wine 0.46 0.08 0.00
Hard liquor 0.52 0.01 0.00
Mate 0.02 0.34 0.11
Variance (%) 31.8 16.2 12.0
Cumulative variance 31.8 48.0 60.0
1Loadings higher than 0.39 are typed in bold.
E. D. Stefani et al. / Open Journal of Obstetrics and Gynecology 1 (2011) 25-30
28
Table 3. Spearman rank correlations between dietary patterns and selected variables.
Dietary patterns
Variables Drinker Red meat Prudent
Age 0.13 0.19 0.03
Education 0.09 0.05 0.22
Smoking intensity 0.21 0.09 0.00
Smoking duration 0.20 0.08 0.00
No of livebirths 0.02 0.18 0.07
Age of intercourse 0.04 0.14 0.01
No of partners 0.11 0.04 0.04
Table 4. Participant characteristics for controls by factor quartile.
Variable Category Drinker Red meat Prudent
Age (years) 1 52.4 54.0 49.4
2 51.8 49.9 50.5
3 50.3 50.6 52.1
4 47.4 47.1 49.8
Education 1 6.3 7.4 6.3
(years) 2 7.0 7.1 6.2
3 6.7 6.6 7.3
4 7.7 6.5 7.9
Smoking 1 3.9 4.8 5.6
(cigarettes/day) 2 5.1 5.5 4.8
3 6.1 4.3 5.8
4 6.4 6.9 5.4
Meat 1 7.8 2.5 7.7
(servings/week) 2 5.3 4.2 6.1
3 5.1 6.4 5.1
4 3.8 8.9 3.0
Vegetables 1 3.9 2.8 1.3
(servings/week) 2 3.4 3.2 2.5
3 2.9 3.4 3.6
4 2.0 2.8 4.9
Age of first intercourse 1 19.5 19.5 20.3
2 20.0 19.1 19.5
3 18.9 20.4 18.8
4 19.2 19.7 19.1
No partners 1 1.7 1.9 1.6
2 1.8 2.3 2.1
3 1.8 2.6 1.8
4 2.1 2.9 1.8
1 Numbers in each cell corresponds to mean values of the variable.
Odds ratios of cervical cancer for dietary patterns are
shown in Table 5. Cancer of the cervix was positively
associated with red meat and drinker patterns (OR for
highest category versus the lowest one for red meat pat-
tern 1.79, 95% CI 1.12-2.86, p-value for linear trend =
0.02). On the other hand, cervical cancer was inversely
associated with the prudent pattern (OR 0.60, 95% CI
0.38-0.93).
C
opyright © 2011 SciRes. OJOG
E. D. Stefani et al. / Open Journal of Obstetrics and Gynecology 1 (2011) 25-30 29
Table 5. Odds ratios of carcinoma of the cervix for dietary patterns1.
Dietary pattern Category Cases/Controls OR 95 % CI
Drinker Low 60/134 1.0 reference
2 54/134 1.07 0.66 - 1.71
3 68/134 1.23 0.78 - 1.94
High 86/134 1.49 0.95 - 2.31
p-value for trend 0.053
Continuous 1.08 0.99 - 1.18
Red meat Low 47/134 1.0 reference
2 65/134 1.31 0.81 - 2.12
3 61/134 1.30 0.81 - 2.10
High 95/134 1.79 1.12 - 2.86
p-value for trend 0.02
Continuous 1.13 1.00 - 1.28
Prudent Low 87/134 1.0 reference
2 71/134 0.87 0.57 - 1.33
3 57/134 0.67 0.43 - 1.04
High 53/134 0.60 0.38 - 0.93
p-value for trend 0.01
Continuous 0.83 0.73 - 0.95
1Adjusted for age, residence, education, income, age at first intercourse, number of partners, smoking, total energy intake and all scores for dietary patterns.
4. DISCUSSION
To our knowledge, the present study is the first one on
factor analysis and risk of cervical cancer. The principal
components approach has some limitations related to the
FFQ and the management of the data. The inclusion of
foods and beverages should be validated previously to
the factor analysis being run. In fact, principal compo-
nents analysis should be conducted in order to obtain the
simple structure following Thurstone’s criteria [15,16].
In our model, this simple structure was obtained through
the rotated principal components analysis.
In our study, an early age at first intercourse, a high
number of sexual partners, and a high number of live-
births were directly associated with cervical cancer risk,
replicating previous reports [3,17-19]. It has been sug-
gested that the male factor could be related to the etiol-
ogy of cervical cancer through venereal diseases, which
could foster the infection of their spouses with HPV
[17-21]. The drinker pattern displayed a clear gradient
associated with the number of partners, and so did the
red me at pattern.
In the present study, cigarette smoking did not signify
an important risk in cancer of the cervix. It should be
noted that in general, the intensity of smoking and the
duration of this habit are not particularly high among
women of low socioeconomic status in Uruguay [22].
Furthermore, when cigarette smoking was controlled by
the above sexual and reproductive variables, the risk was
close to null. Nevertheless, smoking intensity displayed
a positive gradient for the drinker pattern. It is worth
noting that Gunnell et al. [23] also found a synergy be-
tween HPV infection and smoking duration.
The role of red meat was positively associated with
cervical cancer in our study. This could be explained by
the presence of heterocyclic amines in red meat, which
are powerful carcinogens in animals [24]. Moreover, red
meat is an important source of fat and cholesterol and it
has been suggested that whereas heterocyclic amines act
as initiators, fat plays a role of promoter [25]. Further
studies on the role of red meat in cervical cancer are
warranted.
Finally the effect of total vegetables and total fruits
was particularly protective in the etiology of cervical
cancer [26]. This applies mainly to the strata of women
with a high number of sexual partners. In fact, vegeta-
bles and fruits were the main components of the prudent
pattern.
Like other case-control studies, this study has its limi-
tations and strengths. The major limitations are selec-
tions bias, recall bias, and the possibility of error due to
multiple comparisons (that is, chance findings). Perhaps,
the lack of information about HPV status is a major li-
mitation. Therefore, in the place of HPV we attempted to
use the age at first intercourse and number of partners as
proxy indicators of this infection. Another limitation is
the rather small amount of foods used as a routine in the
C
opyright © 2011 SciRes. OJOG
E. D. Stefani et al. / Open Journal of Obstetrics and Gynecology 1 (2011) 25-30
30
FFQ administered by the Cancer Institute. Among the
strengths, in the first place, is the power of the study,
measured by the sampling adequacy, which allowed the
estimation of small ORs as significant. Secondly, all the
cases were validated by expert pathologists, and finally,
the high response rate among cases and controls suggests
that participants were drawn from the same population
base.
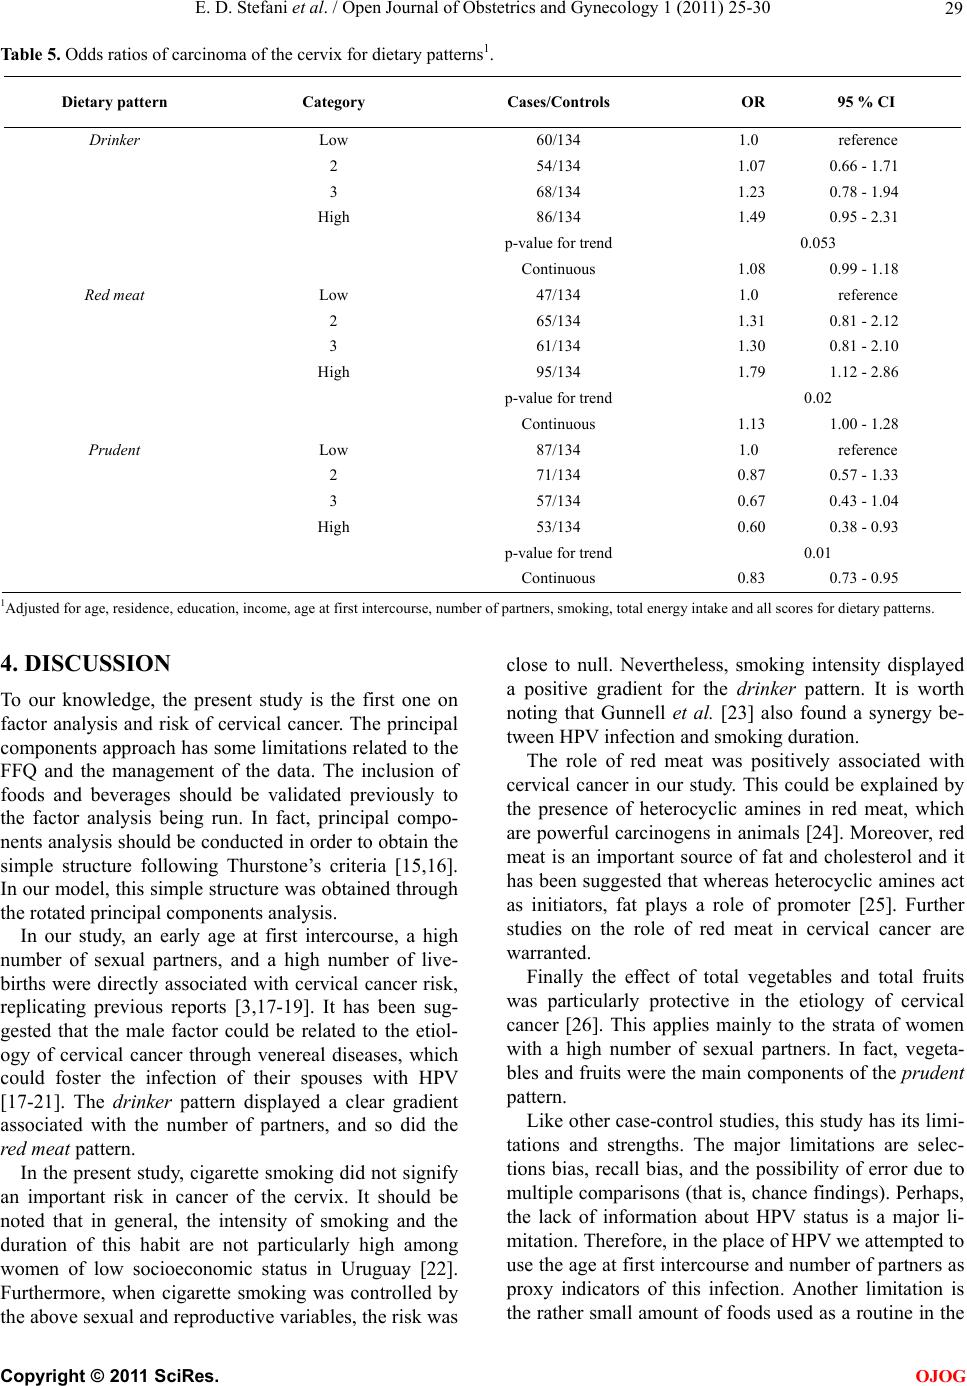
In summary, we conducted a factor analysis on the re-
lationship between foods and beverages and risk of cer-
vical cancer. Whereas the red meat pattern was directly
associated with this malignancy, the prudent pattern was
inversely associated with cancer of the cervix. In short,
the main novelty of this study is the use of factor analy-
sis in cervical cancer to evaluate the role of diet in this
malignancy.
REFERENCES
[1] Barrios, E., Vassallo, J.A., Alonso, R., Garau, M. and
Musetti, C. (2010) III Atlas de Incidencia del Cáncer en
el Uruguay. Registro Nacional de Cáncer. Comisión
Honoraria de Lucha contra el Cáncer, 87-88 (In
Spanish).
[2] De Stefani, E., Fierro, L., Barrios, E. and Ronco, A.
(1994) Cancer mortality trends in Uruguay 1953-1991.
International Journal of Cancer, 56, 634-639.
doi:10.1002/ijc.2910560505
[3] Schiffman, M.H., Brinton, L.A., Devesa, S.S. and
Fraumeni, J.F. (1996) Cervical cancer. In: Schottenfeld,
D. and Fraumeni, J.F. Eds. Cancer Epidemiology and
Prevention. Second Edition. Oxford University Press,
New York, 1090-1116.
[4] IARC Monographs on the evaluation of carcinogenic
risks to humans. (2004) Tobacco smoke and involuntary
smoking, 83, Lyon, France, 743-792.
[5] World Cancer Research Fund/American Institute for
Cancer Research (2007) Food, nutrition, physical activity,
and the prevention of cancer: A global perspective. AICR,
Washington DC, 302-304.
[6] Mulaik, S.A. (2010) Foundations of Factor Analysis.
Second Edition, CRC Press, Boca Raton, 276-279.
[7] De Stefani, E., Deneo-Pellegrini, H., Boffetta, P., et al.
(2009) Dietary patterns and risk of cancer: A factor
analysis in Uruguay. International Journal of Cancer,
124, 1391-1397. doi:10.1002/ijc.24035
[8] Ronco, A.L., De Stefani, E., Boffetta, P., et al. (2006)
Food patterns and risk of breast cancer: A factor analysis
study in Uruguay. International Journal of Cancer, 11 9,
1672-1678. doi:10.1002/ijc.22021
[9] Dixon, L.B., Balder, H.B., Virtannen, M.J., et al. (2004)
Dietary patterns associated with colon and rectum cancer:
Results from the Dietary Patterns and Cancer (DIET-
SCAN) Project. The American Journal of Clinical Nutri-
tion, 80, 1003-1011.
[10] Slattery, M.L., Boucher, K.M., Cann, B.J., et al. (1998)
Eating patterns and risk of colon cancer. American Jour-
nal of Epidemiology, 148, 4-16.
[11] Gorsuch, R.L. (2008) Factor Analysis. Second Edition.
Psychology Press, Taylor & Francis Group, London, 234-
236.
[12] Thomson, G.H. (1951) The factorial analysis of human
ability. University of London Press, London.
[13] Rothman, K.J., Greenland, S. and Lash, T. (2008) Mod-
ern epidemiology. Third Edition. Lippincott Williams &
Wilkins, Philadelphia, 303-327.
[14] StataCorp. (2007) Stata Statistical Software. Release 10.
College Station, StataCorp LP, Texas.
[15] Thurstone, L.L. (1947) Multiple factor analysis: A de-
velopment and expansion of vectors of the mind. Univer-
sity of Chicago Press, Chicago.
[16] Kline, P. (2002) An easy guide to factor analysis. Rout-
lege, New York.
[17] Brinton, L.A., Reeves, W.C., Brenes, M.M., et al. (1989)
The male factor in the etiology of cervical cancer among
sexually monogamous women. International Journal of
Cancer, 44, 199-203. doi:10.1002/ijc.2910440202
[18] Muñoz, N., Bosch, F.X., Shah, K.V., Meheus, A. (Editors)
(1992) The epidemiology of human papillomavirus and
cervical cancer. IARC Scientific Publications, Lyon.
[19] Bosch, F.X., Manos, M.M., Muñoz, N., et al. (1995)
Prevalence of human papillomavirus in cervical cancer:
A worldwide perspective. Journal of the National Cancer
Institute, 87, 796-802. doi:10.1093/jnci/87.11.796
[20] Herrero, R., Potischman, N., Brinton, L.A., et al. (1991)
A case-control study of nutrient status and invasive cer-
vical cancer: I. dietary indicators. American Journal of
Epidemiology, 134, 1335-1346.
[21] Castellsagué, X., Bosch, F.X., Muñoz, N., et al. (2002)
Male circumsion, penile human papillomavirus infection,
and cervical cancer in female partners. The New England
Journal of Medicine, 346, 1105-1112.
doi:10.1056/NEJMoa011688
[22] Carámbula, J.A., Ronco, A.L. and Niedworok, N.T.
(1995) Investigación sociolaboral del tabaquismo en el
Uruguay urbano. Programa Nacional de Prevencion del
Cáncer de Pulmón. Dirección General de Salud.
Ministerio de Salud Pública, Academia Nacional de
Medicina, Uruguay, (In Spanish).
[23] Gunnell, A.S., Tran, T.N., Torrang, A., et al. (2006) Syn-
ergy between cigarette smoking and human papillomavi-
rus type 16 in cervical cancer in situ development. Can-
cer Epidemiology, Biomarkers & Prevention, 15, 2141-
2147. doi:10.1158/1055-9965.EPI-06-0399
[24] Sinha, R. (2002) An epidemiologic approach to studying
heterocyclic amines. Mutation Research, 506-507, 197-
204. doi:10.1016/S0027-5107(02)00166-5
[25] Weisburger, J.H. (2002) Comments on the history and
importance of aromatic and heterocyclic amines in public
health. Mutation Research, 506-507, 9-20.
doi:10.1016/S0027-5107(02)00147-1
[26] IARC Handbooks of Cancer Prevention. (2003) Fruit and
Vegetables. IARC Press, Lyon, 8, 89-92.
C
opyright © 2011 SciRes. OJOG