Paper Menu >>
Journal Menu >>
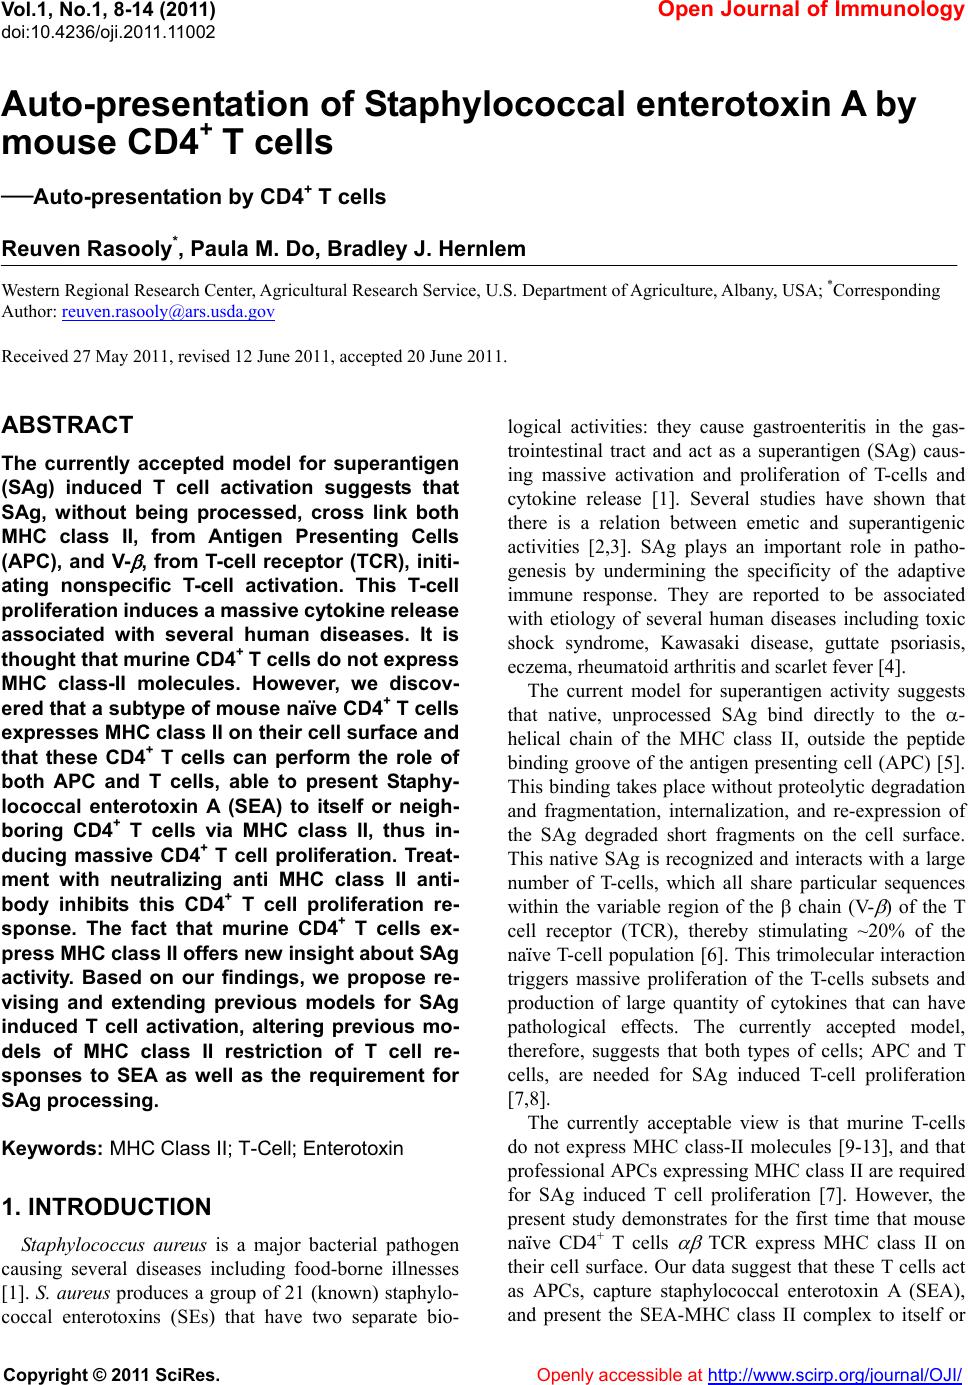 Vol.1, No.1, 8-14 (2011) Open Journal of Immunology doi:10.4236/oji.2011.11002 Copyright © 2011 SciRes. Openly accessible at http://www.scirp.org/journal/OJI/ Auto-presentation of Staphylococcal enterotoxin A by mouse CD4+ T cells —Auto-presentation by CD4+ T cells Reuven Rasooly*, Paula M. Do, Bradley J. Hernlem Western Regional Research Center, Agricultural Research Service, U.S. Department of Agriculture, Albany, USA; *Corresponding Author: reuven.rasooly@ars.usda.gov Received 27 May 2011, revised 12 June 2011, accepted 20 June 2011. ABSTRACT The currently accepted model for superantigen (SAg) induced T cell activation suggests that SAg, without being processed, cross link both MHC class II, from Antigen Presenting Cells (APC), and V- , from T-cell receptor (TCR), initi- ating nonspecific T-cell activation. This T-cell proliferation induces a massive cy tokine release associated with several human diseases. It is thought that mu rine CD4 + T cells do not express MHC class-II molecules. However, we discov- ered that a subtype of mouse naïve CD4+ T cells expresses MHC class II on their cell surface and that these CD4+ T cells can perform the role of both APC and T cells, able to present Staphy- lococcal enterotoxin A (SEA) to itself or neigh- boring CD4+ T cells via MHC class II, thus in- ducing massive CD4+ T cell proliferation. Treat- ment with neutralizing anti MHC class II anti- body inhibits this CD4+ T cell proliferation re- sponse. The fact that murine CD4+ T cells ex- press MHC cl ass II offe rs new insight about S Ag activity. Based on our findings, we propose re- vising and extending previous models for SAg induced T cell activation, altering previous mo- dels of MHC class II restriction of T cell re- sponses to SEA as well as the requirement for SAg processing. Keywords: MHC Class II; T-Cell; Enterotoxin 1. INTRODUCTION Staphylococcus aureus is a major bacterial pathogen causing several diseases including food-borne illnesses [1]. S. aureus produces a grou p of 21 (known) staphylo- coccal enterotoxins (SEs) that have two separate bio- logical activities: they cause gastroenteritis in the gas- trointestinal tract and act as a superantigen (SAg) caus- ing massive activation and proliferation of T-cells and cytokine release [1]. Several studies have shown that there is a relation between emetic and superantigenic activities [2,3]. SAg plays an important role in patho- genesis by undermining the specificity of the adaptive immune response. They are reported to be associated with etiology of several human diseases including toxic shock syndrome, Kawasaki disease, guttate psoriasis, eczema, rheumatoid arthritis and scarlet fever [4]. The current model for superantigen activity suggests that native, unprocessed SAg bind directly to the - helical chain of the MHC class II, outside the peptide binding groove of the antigen presenting cell (APC) [5]. This binding takes place without proteolytic degradation and fragmentation, internalization, and re-expression of the SAg degraded short fragments on the cell surface. This native SAg is recognized and interacts with a large number of T-cells, which all share particular sequences within the variable region of the chain (V- ) of the T cell receptor (TCR), thereby stimulating ~20% of the naïve T-cell population [6]. This trimolecular interaction triggers massive proliferation of the T-cells subsets and production of large quantity of cytokines that can have pathological effects. The currently accepted model, therefore, suggests that both types of cells; APC and T cells, are needed for SAg induced T-cell proliferation [7,8]. The currently acceptable view is that murine T-cells do not express MHC class-II molecules [9-13], and that professional APCs expressing MHC class II are required for SAg induced T cell proliferation [7]. However, the present study demonstrates for the first time that mouse naïve CD4+ T cells TCR express MHC class II on their cell surface. Our data suggest that these T cells act as APCs, capture staphylococcal enterotoxin A (SEA), and present the SEA-MHC class II complex to itself or 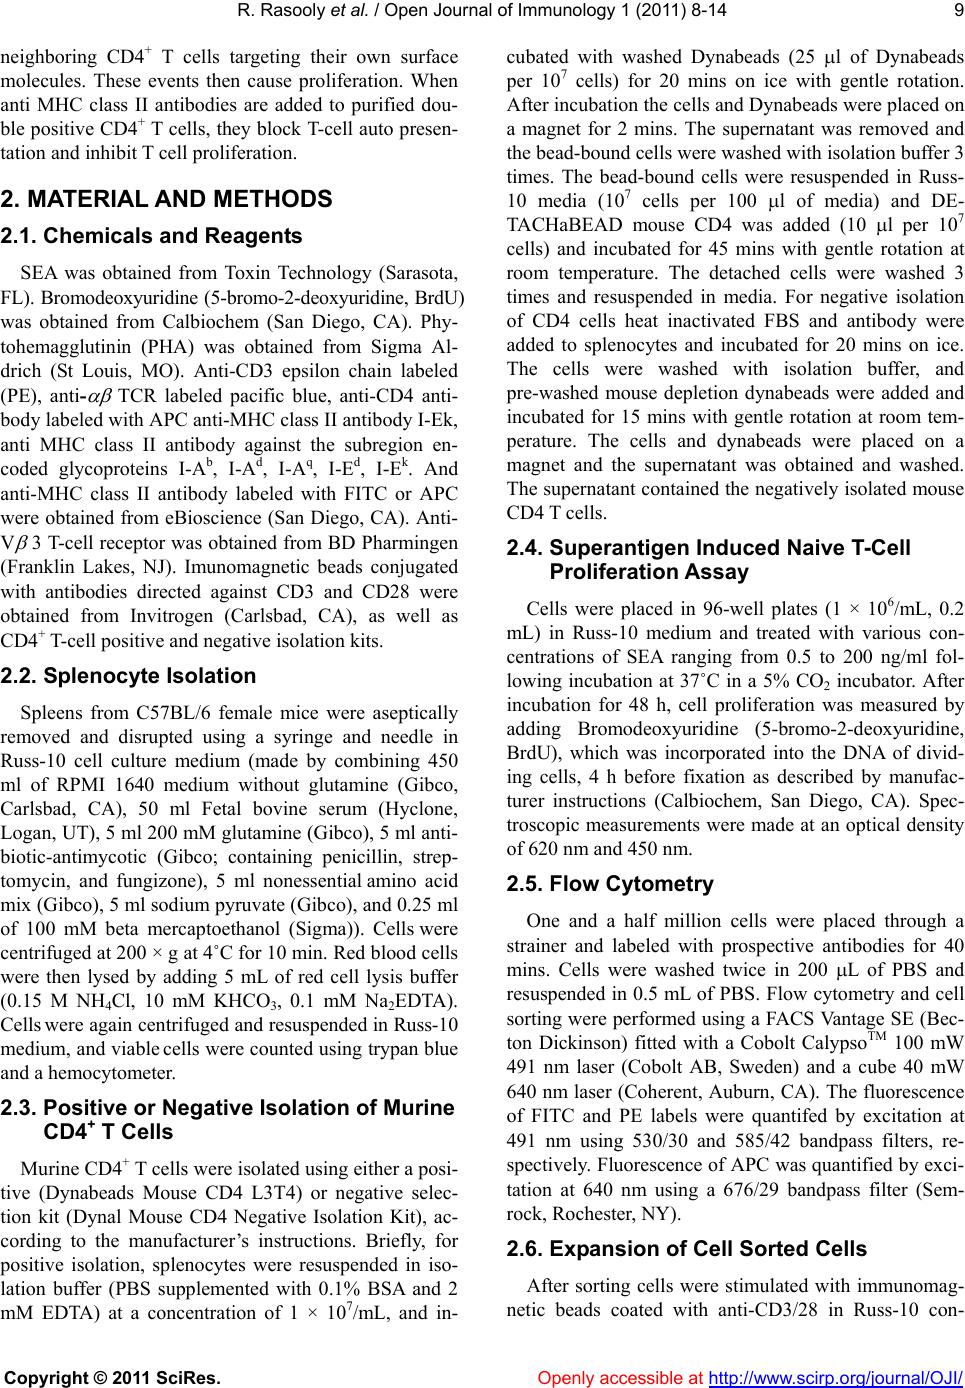 R. Rasooly et al. / Open Journal of Immunology 1 (2011) 8-14 Copyright © 2011 SciRes. Openly accessible at http://www.scirp.org/journal/OJI/ 9 neighboring CD4+ T cells targeting their own surface molecules. These events then cause proliferation. When anti MHC class II antibodies are added to purified dou- ble positiv e CD4+ T cells, they block T-cell auto presen- tation and inhibit T cell proliferation. 2. MATERIAL AND M ETHODS 2.1. Chemicals and Reagents SEA was obtained from Toxin Technology (Sarasota, FL). Bromodeoxyuridine (5-bromo-2-deoxyuridine, BrdU) was obtained from Calbiochem (San Diego, CA). Phy- tohemagglutinin (PHA) was obtained from Sigma Al- drich (St Louis, MO). Anti-CD3 epsilon chain labeled (PE), anti- TCR labeled pacific blue, anti-CD4 anti- body labeled with APC an ti-MHC class II an tib od y I-Ek, anti MHC class II antibody against the subregion en- coded glycoproteins I-Ab, I-Ad, I-Aq, I-Ed, I-Ek. And anti-MHC class II antibody labeled with FITC or APC were obtained fro m eBioscience (San Diego, CA). An ti- V 3 T-cell receptor was obtained from BD Pharmingen (Franklin Lakes, NJ). Imunomagnetic beads conjugated with antibodies directed against CD3 and CD28 were obtained from Invitrogen (Carlsbad, CA), as well as CD4+ T-cell positive and negative isolation kits. 2.2. Splenocyte Isolation Spleens from C57BL/6 female mice were aseptically removed and disrupted using a syringe and needle in Russ-10 cell culture medium (made by combining 450 ml of RPMI 1640 medium without glutamine (Gibco, Carlsbad, CA), 50 ml Fetal bovine serum (Hyclone, Logan, UT), 5 ml 200 mM glutamine (Gibco), 5 ml anti- biotic-antimycotic (Gibco; containing penicillin, strep- tomycin, and fungizone), 5 ml nonessential amino acid mix (Gibco), 5 ml sodium pyruvate (Gibco), and 0.25 ml of 100 mM beta mercaptoethanol (Sigma)). Cells were centrifuged at 200 × g at 4˚C for 10 min. Red blood cells were then lysed by adding 5 mL of red cell lysis buffer (0.15 M NH4Cl, 10 mM KHCO3, 0.1 mM Na2EDTA). Cells were again centrifuged and resuspended in Russ-10 medium, and viable cells were counted using trypan blue and a hemocytometer. 2.3. Positive or Negative Isolation of Murine CD4+ T Cells Murine CD4 + T cells were isolated using either a posi- tive (Dynabeads Mouse CD4 L3T4) or negative selec- tion kit (Dynal Mouse CD4 Negative Isolation Kit), ac- cording to the manufacturer’s instructions. Briefly, for positive isolation, splenocytes were resuspended in iso- lation buffer (PBS supplemented with 0.1% BSA and 2 mM EDTA) at a concentration of 1 × 10⁷/mL, and in- cubated with washed Dynabeads (25 l of Dynabeads per 107 cells) for 20 mins on ice with gentle rotation. After incubation the cells and Dynabeads were placed on a magnet for 2 mins. The supernatant was removed and the bead-bound cells wer e washed with isolation bu ffer 3 times. The bead-bound cells were resuspended in Russ- 10 media (107 cells per 100 l of media) and DE- TACHaBEAD mouse CD4 was added (10 l per 107 cells) and incubated for 45 mins with gentle rotation at room temperature. The detached cells were washed 3 times and resuspended in media. For negative isolation of CD4 cells heat inactivated FBS and antibody were added to splenocytes and incubated for 20 mins on ice. The cells were washed with isolation buffer, and pre-washed mouse depletion dynabeads were added and incubated for 15 mins with gentle rotation at room tem- perature. The cells and dynabeads were placed on a magnet and the supernatant was obtained and washed. The supernatant contained the negatively isolated mouse CD4 T cells. 2.4. Superantigen Induced Naive T-Cell Proliferation Assay Cells were placed in 96-well plates (1 × 10⁶/mL, 0.2 mL) in Russ-10 medium and treated with various con- centrations of SEA ranging from 0.5 to 200 ng/ml fol- lowing incubation at 37˚C in a 5% CO2 incubator. After incubation for 48 h, cell proliferation was measured by adding Bromodeoxyuridine (5-bromo-2-deoxyuridine, BrdU), which was incorporated into the DNA of divid- ing cells, 4 h before fixation as described by manufac- turer instructions (Calbiochem, San Diego, CA). Spec- troscopic measurements were made at an optical density of 620 nm and 45 0 nm. 2.5. Flow Cytometry One and a half million cells were placed through a strainer and labeled with prospective antibodies for 40 mins. Cells were washed twice in 200 L of PBS and resuspended in 0.5 mL of PBS. Flow cytometry and cell sorting were performed using a FACS Vantage SE (Bec- ton Dickinson) fitted with a Cobolt CalypsoTM 100 mW 491 nm laser (Cobolt AB, Sweden) and a cube 40 mW 640 nm laser (Coherent, Auburn, CA). The fluorescence of FITC and PE labels were quantifed by excitation at 491 nm using 530/30 and 585/42 bandpass filters, re- spectively. Fluorescence of APC was quantified by exci- tation at 640 nm using a 676/29 bandpass filter (Sem- rock, Rochester, NY). 2.6. Expansion of Cell Sorted Cells After sorting cells were stimulated with immunomag- netic beads coated with anti-CD3/28 in Russ-10 con-  R. Rasooly et al. / Open Journal of Immunology 1 (2011) 8-14 Copyright © 2011 SciRes. Openly accessible at http://www.scirp.org/journal/OJI/ 10 taining IL- 2 (30 U/mL). 2.7. Statistical Analysis Statistical analysis was performed using SigmaStat 3.5 for Windows (Systat Software, San Jose, CA). Multiple comparisons were made of PHA or with increasing con- centrations of SEA that induce splenocytes or purified T cell proliferation. The experiments were repeated at least three times, and results with p < 0.05 were considered statistically significant. 3. RESULTS 3.1. The Effect of APC-CD4+ T Cells Ratio on Superantigen Induced Naive T-Cell Proliferation In order to activate CD4+ T-cells, a 10 to 1 ratio of APCs to T cells is needed [14]. Our hypothesis is that the ratio between APC and T cell is important for effi- cient T-cell proliferation, and that there would be a re- duction in CD4+ T-Cell proliferation response after al- tering this ratio, because reduction in APCs limits the number of CD4+ T cells that can bind to the SEA-APC complex. To test this hypothesis, we increased CD4+ T cell concentration by utilizing two types of CD4+ T cell isolation methods; negative selection which increases the concentration of CD4+ T cell from 22% in the average spleen to 90%, or positive selection with an average pu- rity of 95%. The isolated CD4+ T cells from a single spleen preparation were cultured with three concentra- tions of the superantigen SEA 0.5, 1 and 200 ng/ml. Proliferation was measured on day 1 by BrdU incorpora- tion. As shown in Figure 1, SEA induced proliferat i o n in a dose dependent manner in all three cell cultures. Sur- prisingly, the highly enriched positive isolated CD4+ T, which presumably has the lowest concentration of APC cell, provided the highest signal with highest signal- to-noise ratio. These experiments raise the questions whether depleting APC paradoxically increases prolife- ration, and how complete elimination of APCs will ef- fect proliferation. 3.2. The Superantigen Staphylococcal Enterotoxin A Induces Proliferation of CD4+ T Cells in the Absence of APC To determine how elimination of APCs affects SEA induced T cell proliferation, CD4+ T cells were purified from splenocytes by positive and negative selection. In these experiments, SEA was used at a concentration of 200 ng/ml. To determine the absence of APC, APC-de- pendent mitogen PHA was used at concentration of 10 g/ml. Antibody against MHC class II was used to block the interaction between MHC class II and the variable region of the TCR. As shown in Figure 2, the APC-de- splenocyteCD4 (pos)CD4 (neg) OD 450 nm 0.0 0.1 0.2 0.3 0.4 0 ng/ml 0.5 ng/ml 1 ng/ml 200 ng/ml Figure 1. SEA activation of purified CD4+ T-cells. Splenocytes, positively selected, and negatively selected CD4+ T-cells were incubated with increasing concentrations of SEA. After incu- bation for 1 day newly synthesized DNA was measured. Error bars represent standard errors and n = 3. Figure 2. SEA induces proliferation of double purified CD4+ T cells Splenocytes, positive selected and double positive se- lected CD4+ T cells were incubated with SEA in the presence or absence of antibody against MHC class II subregion glyco- proteins I-Ab, I-Ad, I-Aq, I-Ed, I-Ek or I-Ek alone. After incuba- tion for 2 days, newly synthesized DNA was measured. Error bars represent standard errors and n = 3.  R. Rasooly et al. / Open Journal of Immunology 1 (2011) 8-14 Copyright © 2011 SciRes. Openly accessible at http://www.scirp.org/journal/OJI/ 11 pendent mitogen, PHA has high proliferative effect on splenocytes, which contain large number of APCs. The data also show a low effect on CD4+ T cells with posi- tive isolation, and no proliferative effect on positive and negative selection of CD4+ T cells. These observations suggest that the double positive purified CD4+ T cells lack APCs. This result is novel and interesting because SEA was able to induce proliferation of purified CD4+ T cells in the absence of MHC-class II expressed on APC. However, anti MHC class II antibody against the subre- gion encoded glycoproteins I-Ab, I-Ad, I-Aq, I-Ed and I-Ek, but not I-Ek alone, blocked proliferation of the doubled purified murine CD4+ T cells. This shows that the SEA induced proliferation response is MHC class II dependent. These observations suggest the presence of MHC class II despite the lack of APCs. 3.3. Naïve CD4+ T Cells Can Express MHC Class II The presence of MHC class II in purified naïve CD4+ T cells without APC raises the question of the source of the MHC class II molecules. Our hypothesis was that Presort analysis of naïve splenocyte cells (a) (b) (c) (d) Post sort analysis of naïve splenocyte cells (e) (f) (g) (h) (i) Figure 3. Naïve CD4+ T cells can express MHC class II Mouse splenocyte were immunostained with anti CD4, anti CD3, anti TCR and anti MHC class II antibody were simultaneously analyzed by flow cytometry in a single analysis. The data prior to sorting show that 2.6% of the gated splenocytes are positive for all 4 antibodies (A-D). Cell sorting enrichment increased concentration of T cells expressing MHC class II (E-H). (I) fluorescent microscopy of CD4+ T-cells, anti-CD4 antibody (is labeled with APC (red) and anti-MHC class II is labeled with FITC (green). The data suggest that these are indeed CD4+ T cells expressing MHC class II.  R. Rasooly et al. / Open Journal of Immunology 1 (2011) 8-14 Copyright © 2011 SciRes. Openly accessible at http://www.scirp.org/journal/OJI/ 12 CD4+ T-cells become activated when they are presented with SAg by MHC class II molecules that are expressed on their surface. To test this hypothesis we labeled naïve mouse splenocyte cells with anti CD4 fluorescein la- beled (APC) antibody, anti MHC class II fluorescein labeled (FITC), anti CD3 labeled (PE) and anti TCR labeled (pacific blue). These cells were analyzed by flow cytometer FACS Calibur. Representative data from three independent experiments show 22% of splenocytes are CD3 and CD4 positive (Figure 3(a)). From this popula- tion 3.1% are positive for CD3 and MHC class II, (Fig- ure 3(b)). 4.2% are positive for CD4 and MHC class II (Figure 3(c)). And 2.6% are positive for αβ TCR cells and MHC class II (Figure 3(d)). Cell sorting increased the concentration of this fluorescin labeled T cell sub- type (Figure 3(e)-(h)). We also used confocal fluores- cent microscopy (Figure 3(i)) and demonstrated that these highly purified CD4+ T cells are double labeled with anti-CD4 antibody (labeled with APC (red) and anti-MHC class II is labeled with FITC (green), sug- gesting these murine CD4+ T cells express MHC class II. 3.4. Expansion of CD4+ T Cells Expressing MHC Class II We performed an ex vivo assay that studied long term expansion of this cell and demonstrated that isolated CD4+ T cells expressing MHC class II can proliferate without using autologous APCs, and can be expanded with immunomagnetic beads conjugated with costimu- latory signals anti-CD28 mAb and T cell activation anti- CD3 mAb. Without this antibody the cells did not pro- liferate. Our result also shows that the exponential pro- liferation of this CD4 + T cell was maintained only for 13 days with an expansion rate of 40-fold (Figure 4(a)). Flow cytometry indicated that during this expansion time CD4+ T cells expressed high levels of MHC class II molecule on their surface (Fi gure 4(b)). 4. DISCUSSION Our studies demonstrate for the first time a subtype of mouse naïve CD4+ T cells express MHC class II mole- cules on the cell surface. We showed that SEA was able to induce high T cell proliferation in dose dependent manner on both negatively and positively selected mouse naïve CD4+ T cells. The proliferative response of these selected CD4+ T cell was similar to the response from splenocytes. SEA was able to induce CD4+ T cell pro- liferation even in the absence of APCs. This may suggest that the safety mechanism requiring cellular interaction between two different types of cells, accessory cell and T cell does not occur in the response to SAg, consequently inducing T cell over-activation with massive cytokine release. Treatment with neutralizing anti MHC class II anti- body totally inhibits the proliferation of these CD4+ T cells in the presence of SEA. These data suggest our CD4+ T cells were able to present SEA via MHC class II and provide sufficient accessory signals to themselves or neighboring CD4+ T cells, triggering proliferation. Con- sequently, they performed the roles of both professional APCs and T cells. This may suggest that this T cell may (a) (b) Figure 4. Expansion of CD4+ T cell expressing MHC class II. Naïve CD4+ T cells expressing MHC class II molecule were iso- lated from C57BL/6 mouse splenocytes by FACS Calibur. The purified Naïve CD4+ T cells were cultured in 96 well microplates. At day 0, 7, 10, 13 and 17, cells were stimulated with anti-CD3/anti-CD28 mAb-coated beads and counted using the trypan blue dye exclusion test to evaluate the fold increase in their numbers. Error bars represent standard errors and n = 3.  R. Rasooly et al. / Open Journal of Immunology 1 (2011) 8-14 Copyright © 2011 SciRes. Openly accessible at http://www.scirp.org/journal/OJI/ 13 Super- antigen T-Cell APC MHC II V V b TCR Antigen PROLIFERATION T-Cell T-Cell MHC II V V b TCR PROLIFERAT ION MHC II V V b PROLIFERATION ORR (a) (b) Figure 5. The current model (a) and the proposed model (b in addition to a) explain how SEA induces T cell proliferation. The current model suggests that SAg binds to two molecules on two separate cells; the V- portion of the TCR and the MHC class II on APC forms a bridge between the T cell and APC induces proliferation to large number of T cells. The proposed mecha- nism suggests that T cells express both molecules; MHC class II and TCR. Therefore, activation by SAg may require only one type of cell performing the role of both APC and T cell. SAg binds to both molecules in neighboring T cells or to both the TCR and MHC class II on the same cell causing massive T cell proliferation.S play a role as a sensor cell and first line of host defense against S. aureus infection. Our findings demonstrate that subtype of CD4+ T cells express MHC class II and may act as professional APC, process SAg and pr esen t th em to n e ighbo ring T cells and induce CD4+ T cell proliferation even in the absence of macrophages, dendritic cells or B lymphocytes. This ob- servation may change the interpretation of earlier ex- periments that used fixed APCs that are metabolically incapable to uptake and process the superantigens, but were able to present SEs and activate T cells. Therefore, the question as to whether processing of SEs is not re- quired was not addresse d by t he pre vi ous st u di es. White et al. [15] and Fleischer et al. [16] demon- strated that T cell response to SEA are not MHC class II restricted and that mouse TCR can recognize non host APC expressing MHC class II alleles from different spe- cies. However, these authors did not tak e into considera- tion that CD4+ T cells that express MHC class II mole- cules on their cell surface can act as APCs. Therefore, their experimental data cannot evaluate whether MHC restriction is violated in response to SEs. In conclusion the paradigm (Figure 5(a)) that sug- gests the only possible mechanism that SAg induces T cell proliferation is by binding to two separate cells, APC and T-cell, may be need to be revised. Our revised model (Figure 5(b)) suggests that alongside the above mechanism SAg may be able to induce T cell prolifera- tion by binding to only one type of CD4+ T-cell express- ing MHC class II. Performing the role of both accessory cell and T cell, these cells present SAg via MHC class II to themselves or neighboring CD4+ T-cells, triggering nonspecific massive T-cell proliferation. The revised model offers further insight into the in vivo mechanism of SAg activity. 5. ACKNOWLEDGEMENTS We thank Anne Bates for her help with confocal microscopy and Daphne Tamar and Sharon Abigail for helpful discussions. REFERENCES [1] Dinges, M.M., Orwin, P.M. and Schlievert, P.M. (2000) Exotoxins of Staphylococcus aureus. Clinical Microbio-  R. Rasooly et al. / Open Journal of Immunology 1 (2011) 8-14 Copyright © 2011 SciRes. Openly accessible at http://www.scirp.org/journal/OJI/ 14 logy Reviews, 13, 16-34. [2] Hu, D.L., Omoe, K., Sashinami, H., Shinagawa, K. and Nakane, A. (2009) Immunization with a nontoxic mutant of staphylococcal enterotoxin A, SEAD227A, protects against enterotoxin-induced emesis in house musk shrews. Journal of Infectious Diseases, 199, 302-310. doi:10.1086/596065 [3] Hui, J., Cao, Y., Xiao, F., Zhang, J., Li, H. and Hu, F. (2008) Staphylococcus aureus enterotoxin C2 mutants: biological activity assay in vitro. Journal of Industrial Microbiology and Biotechnology, 35, 975-980. doi:10.1007/s10295-008-0372-3 [4] Jappe, U. (2000) Superantigens and their association with dermatological inflammatory diseases: Facts and hy- potheses. Acta Dermato-Venereologica, 80, 321-328. doi:10.1080/000155500459231 [5] Kasper, K.J., Xi, W., Nur-Ur Rahman, A.K., Nooh, M.M., Kotb, M., Sundberg, E.J., Madrenas, J. and McCormick J.K. (2008) Molecular requirements for MHC class II alpha-chain engagement and allelic discrimination by the bacterial superantigen streptococcal pyrogenic exotoxin C. The Journal of Immunology, 181, 3384-3392. [6] Rasooly, R. and Do. P.M. (2009) In vitro cell-based assay for activity analysis of staphylococcal enterotoxin A in food. FEMS Immunology and Medical Microbiology, 56, 172-178. doi: 10.1111/j.1574-695X.2009.00561.x [7] Marrack, P. and Kappler, J. (1990) The staphylococcal enterotoxins and their relatives. Science, 248, 705-711. doi:10.1126/science.2185544 [8] Woodland, D. L. and Blackman, M.A. (1993) How do T-cell receptors, MHC molecules and superantigens get together? Immunol Today, 14, 208-212. doi:10.1016/0167-5699(93)90164-G [9] Tsang, J.Y., Chai, J.G. and Lechler, R. (2003) Antigen presentation by mouse CD4+ T cells involving acquired MHC class II:peptide complexes: another mechanism to limit clonal expansion? Blood, 101, 2704-2710. doi:10.1182/blood-2002-04-1230 [10] Schooten, E., Klous, P., van den Elsen, P.J. and Holling, T.M. 2005. Lack of MHC-II expression in activated mouse T cells correlates with DNA methylation at the CIITA-PIII region. Immunogenetics, 57, 795-799. doi:10.1007/s00251-005-0051-8 [11] Li, W., Kim, M.G., Gourley, T.S., McCarthy, B.P., Sant’Angelo, D.B. and Chang C.H. (2005) An alternate pathway for CD4 T cell development: thymocyte-ex- pressed MHC class II selects a distinct T cell population. Immunity, 23, 375-386. doi:10.1016/j.immuni.2005.09.002 [12] Chang, C.H., Hong, S.C., Hughes, C.C., Janeway Jr., C.A. and Flavell, R.A. (1995) CIITA activates the expression of MHC class II genes in mouse T cells. International Immunology, 7, 1515-1518. doi:10.1093/intimm/7.9.1515 [13] Li, W., Sofi, M.H., Yeh, N., Sehra, S., McCarthy, B.P., Patel, D.R., Brutkiewicz, R.R., Kaplan, M.H. and Chang. C.H. (2007) Thymic selection pathway regulates the ef- fector function of CD4 T cells. The Journal of Experi- mental Medicine, 204, 2145-2157. doi:10.1084/jem.20070321 [14] Stephensen, C.B., Rasooly, R., Jiang, X., Ceddia, M.A., Weaver, C.T., Chandraratna, R.A., Bucy, R.P. (2002) Vi- tamin a enhances in vitro Th2 development via retinoid X receptor pathway. The Journal of Immunology, 168, 4495-4503. [15] White, J., Herman, A., Pullen, A.M., Kubo, R., Kappler, J.W. and Marrack, P. (1989) The V beta-specific superan- tigen staphylococcal enterotoxin B: Stimulation of ma- ture T cells and clonal deletion in neonatal mice. Cell 56, 27-35. doi:10.1016/0092-8674(89)90980-X [16] Fleischer, B., Schrezenmeier, H. and Conradt, P. (1989) T lymphocyte activation by staphylococcal enterotoxins: role of class II molecules and T cell surface structures. Cellular Immunology, 120, 92-101. doi:10.1016/0008-8749(89)90177-9 |