Paper Menu >>
Journal Menu >>
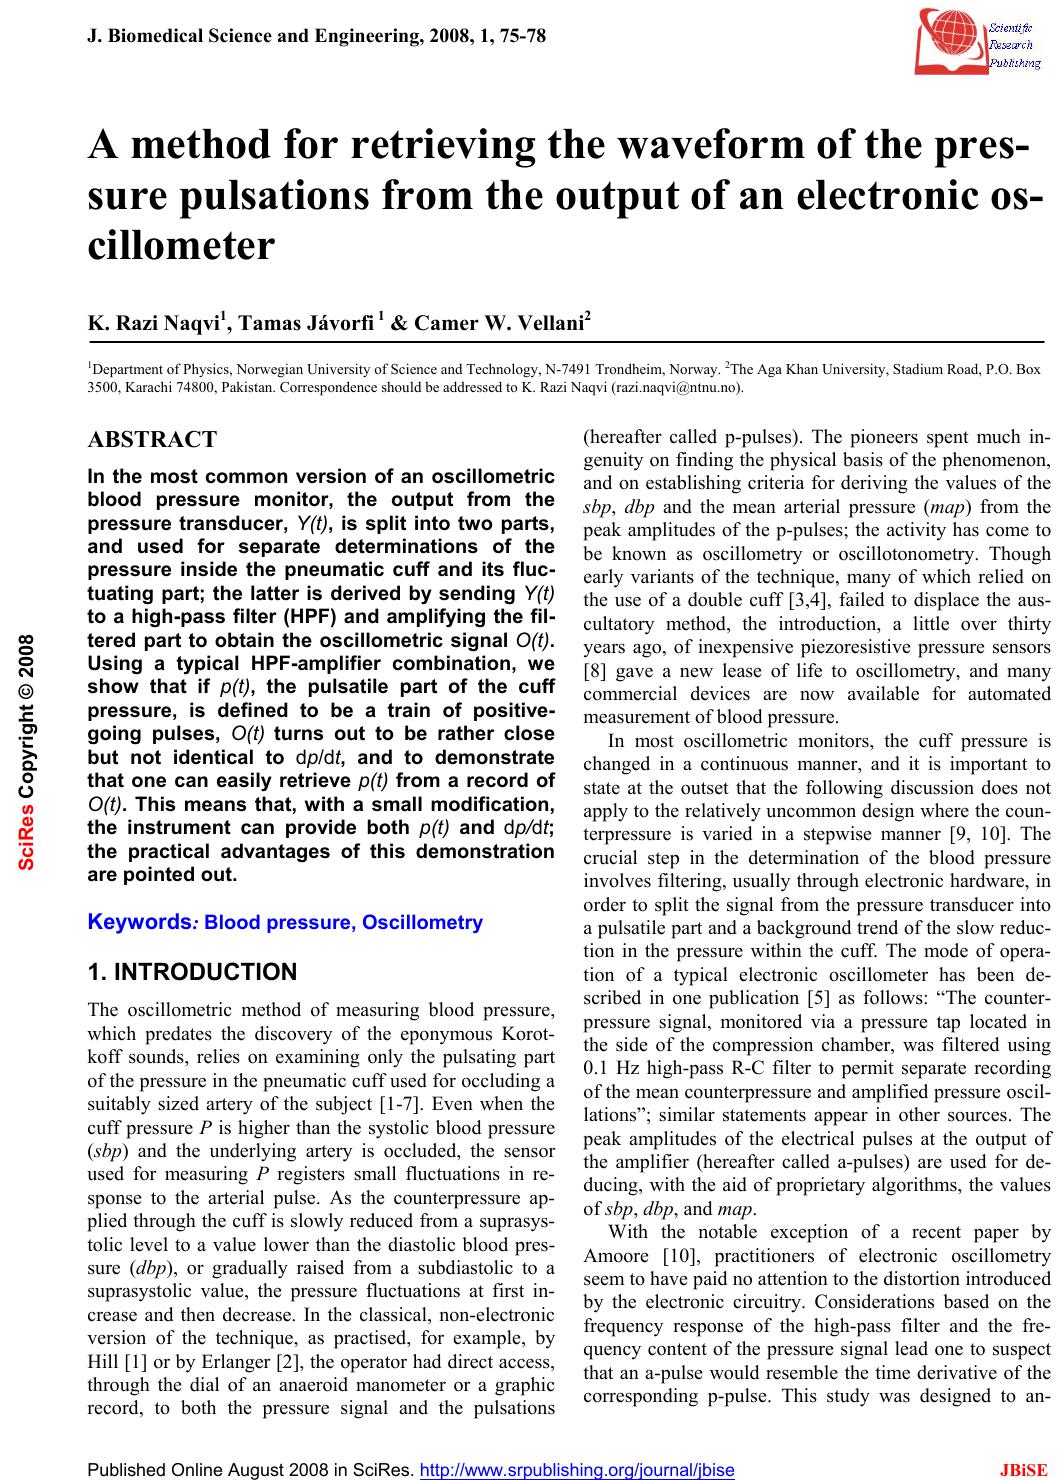 J. Biomedical Science and Engineering, 2008, 1, 75-78 Published Online August 2008 in SciRes. http://www.srpublishing.org/journal/jbise JBiSE A method for retrieving the waveform of the pres- sure pulsations from the output of an electronic os- cillometer K. Razi Naqvi1, Tamas Jávorfi 1 & Camer W. Vellani2 1Department of Physics , Norwegian University of Science an d Technology, N-7491 Trondheim, Norway. 2The Aga Khan University, Stadium Road, P.O. Box 3500, Karachi 74800, Pakistan. Correspondence should be add ressed to K. Razi Na qvi ( razi.naqvi@ntnu.no). ABSTRACT In the most common version of an oscillometric blood pressure monitor, the output from the pressure transducer, Y(t), is split into two parts, and used for separate determinations of the pressure inside the pneumatic cuff and its fluc- tuating part; the latter is derived by sending Y(t) to a high-pass filter (HPF) and amplifying the fil- tered part to obtain the oscillometric signal O(t). Using a typical HPF-amplifier combination, we show that if p(t), the pulsatile part of the cuff pressure, is defined to be a train of positive- going pulses, O(t) turns out to be rather close but not identical to dp/dt, and to demonstrate that one can easily retrieve p(t) from a record of O(t). This means that, with a small modification, the instrument can provide both p(t) and dp/dt; the practical advantages of this demonstration are pointed out. Keywords: Blood pressure, Oscillometry 1. INTRODUCTION The oscillometric method of measuring blood pressure, which predates the discovery of the eponymous Korot- koff sounds, relies on examining only the pulsating part of the pressure in the pneumatic cuff used for occluding a suitably sized artery of the subject [1-7]. Even when the cuff pressure P is higher than the systolic blood pressure (sbp) and the underlying artery is occluded, the sensor used for measuring P registers small fluctuations in re- sponse to the arterial pulse. As the counterpressure ap- plied through the cuff is slowly reduced from a suprasys- tolic level to a value lower than the diastolic blood pres- sure (dbp), or gradually raised from a subdiastolic to a suprasystolic value, the pressure fluctuations at first in- crease and then decrease. In the classical, non-electronic version of the technique, as practised, for example, by Hill [1] or by Erlanger [2], the operator had direct access, through the dial of an anaeroid manometer or a graphic record, to both the pressure signal and the pulsations (hereafter called p-pulses). The pioneers spent much in- genuity on finding the physical basis of the phenomenon, and on establishing criteria for deriving the values of the sbp, dbp and the mean arterial pressure (map) from the peak amplitudes of the p-pulses; the activity has come to be known as oscillometry or oscillotonometry. Though early variants of the technique, many of which relied on the use of a double cuff [3,4], failed to displace the aus- cultatory method, the introduction, a little over thirty years ago, of inexpensive piezoresistive pressure sensors [8] gave a new lease of life to oscillometry, and many commercial devices are now available for automated measurement of blood pressure. In most oscillometric monitors, the cuff pressure is changed in a continuous manner, and it is important to state at the outset that the following discussion does not apply to the relatively uncommon design where the coun- terpressure is varied in a stepwise manner [9, 10]. The crucial step in the determination of the blood pressure involves filtering, usually through electronic hardware, in order to split the signal from the pressure transducer into a pulsatile part and a background trend of the slow reduc- tion in the pressure within the cuff. The mode of opera- tion of a typical electronic oscillometer has been de- scribed in one publication [5] as follows: “The counter- pressure signal, monitored via a pressure tap located in the side of the compression chamber, was filtered using 0.1 Hz high-pass R-C filter to permit separate recording of the mean counterpressure and amplified pressure oscil- lations”; similar statements appear in other sources. The peak amplitudes of the electrical pulses at the output of the amplifier (hereafter called a-pulses) are used for de- ducing, with the aid of proprietary algorithms, the values of sbp, dbp, and map. With the notable exception of a recent paper by Amoore [10], practitioners of electronic oscillometry seem to have paid no attention to the distortion introduced by the electronic circuitry. Considerations based on the frequency response of the high-pass filter and the fre- quency content of the pressure signal lead one to suspect that an a-pulse would resemble the time derivative of the corresponding p-pulse. This study was designed to an- SciRes Copyright © 2008 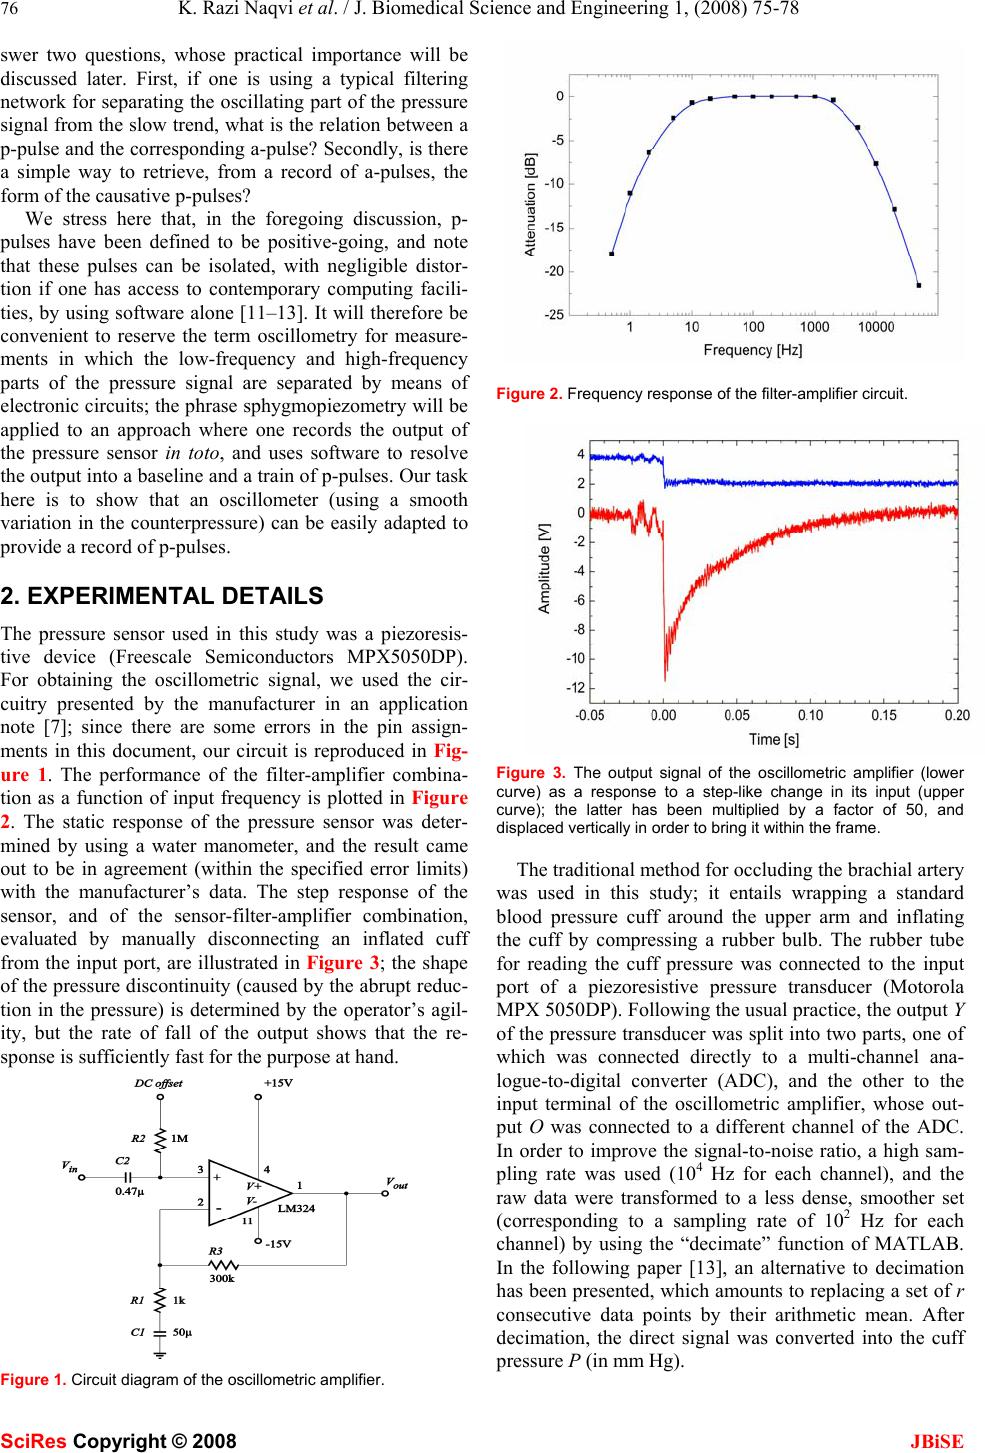 76 K. Razi Naqvi et al. / J. Biomedical Science and Engineering 1, (2008) 75-78 SciRes Copyright © 2008 JBiSE swer two questions, whose practical importance will be discussed later. First, if one is using a typical filtering network for separating the oscillating part of the pressure signal from the slow trend, what is the relation b etween a p-pulse and the corresponding a-pulse? Secondly, is there a simple way to retrieve, from a record of a-pulses, the form of the causative p-pulses? We stress here that, in the foregoing discussion, p- pulses have been defined to be positive-going, and note that these pulses can be isolated, with negligible distor- tion if one has access to contemporary computing facili- ties, by using software alone [11–13]. It will therefore be convenient to reserve the term oscillometry for measure- ments in which the low-frequency and high-frequency parts of the pressure signal are separated by means of electronic circuits; the phr ase sphygmopiezometry will be applied to an approach where one records the output of the pressure sensor in toto, and uses software to resolve the output into a baseline and a train of p-pulses. Our task here is to show that an oscillometer (using a smooth variation in the counterpressure) can be easily adapted to provide a record of p-pulses. 2. EXPERIMENTAL DETAILS The pressure sensor used in this study was a piezoresis- tive device (Freescale Semiconductors MPX5050DP). For obtaining the oscillometric signal, we used the cir- cuitry presented by the manufacturer in an application note [7]; since there are some errors in the pin assign- ments in this document, our circuit is reproduced in Fig- ure 1. The performance of the filter-amplifier combina- tion as a function of input frequency is plotted in Figure 2. The static response of the pressure sensor was deter- mined by using a water manometer, and the result came out to be in agreement (within the specified error limits) with the manufacturer’s data. The step response of the sensor, and of the sensor-filter-amplifier combination, evaluated by manually disconnecting an inflated cuff from the input port, are illustrated in Figure 3; the shape of the pressure discontinuity (caused by the abrupt reduc- tion in the pressure) is determined by the operator’s agil- ity, but the rate of fall of the output shows that the re- sponse is sufficiently fast for the purpose at hand. Figure 1. Circuit diagram of the oscillometric amplifier. Figure 2. Frequency response of the filter-amplifier circuit. Figure 3. The output signal of the oscillometric amplifier (lower curve) as a response to a step-like change in its input (upper curve); the latter has been multiplied by a factor of 50, and displaced vertically in order to bring it within the frame. The traditional method for occluding the brachial artery was used in this study; it entails wrapping a standard blood pressure cuff around the upper arm and inflating the cuff by compressing a rubber bulb. The rubber tube for reading the cuff pressure was connected to the input port of a piezoresistive pressure transducer (Motorola MPX 5050DP). Following the usual practice, the output Y of the pressure transd ucer was split into two parts, one o f which was connected directly to a multi-channel ana- logue-to-digital converter (ADC), and the other to the input terminal of the oscillometric amplifier, whose out- put O was connected to a different channel of the ADC. In order to improve the signal-to-noise ratio, a high sam- pling rate was used (104 Hz for each channel), and the raw data were transformed to a less dense, smoother set (corresponding to a sampling rate of 102 Hz for each channel) by using the “decimate” function of MATLAB. In the following paper [13], an alternative to decimation has been presented, which amounts to replacing a set of r consecutive data points by their arithmetic mean. After decimation, the direct signal was converted into the cuff pressure P (in mm Hg). 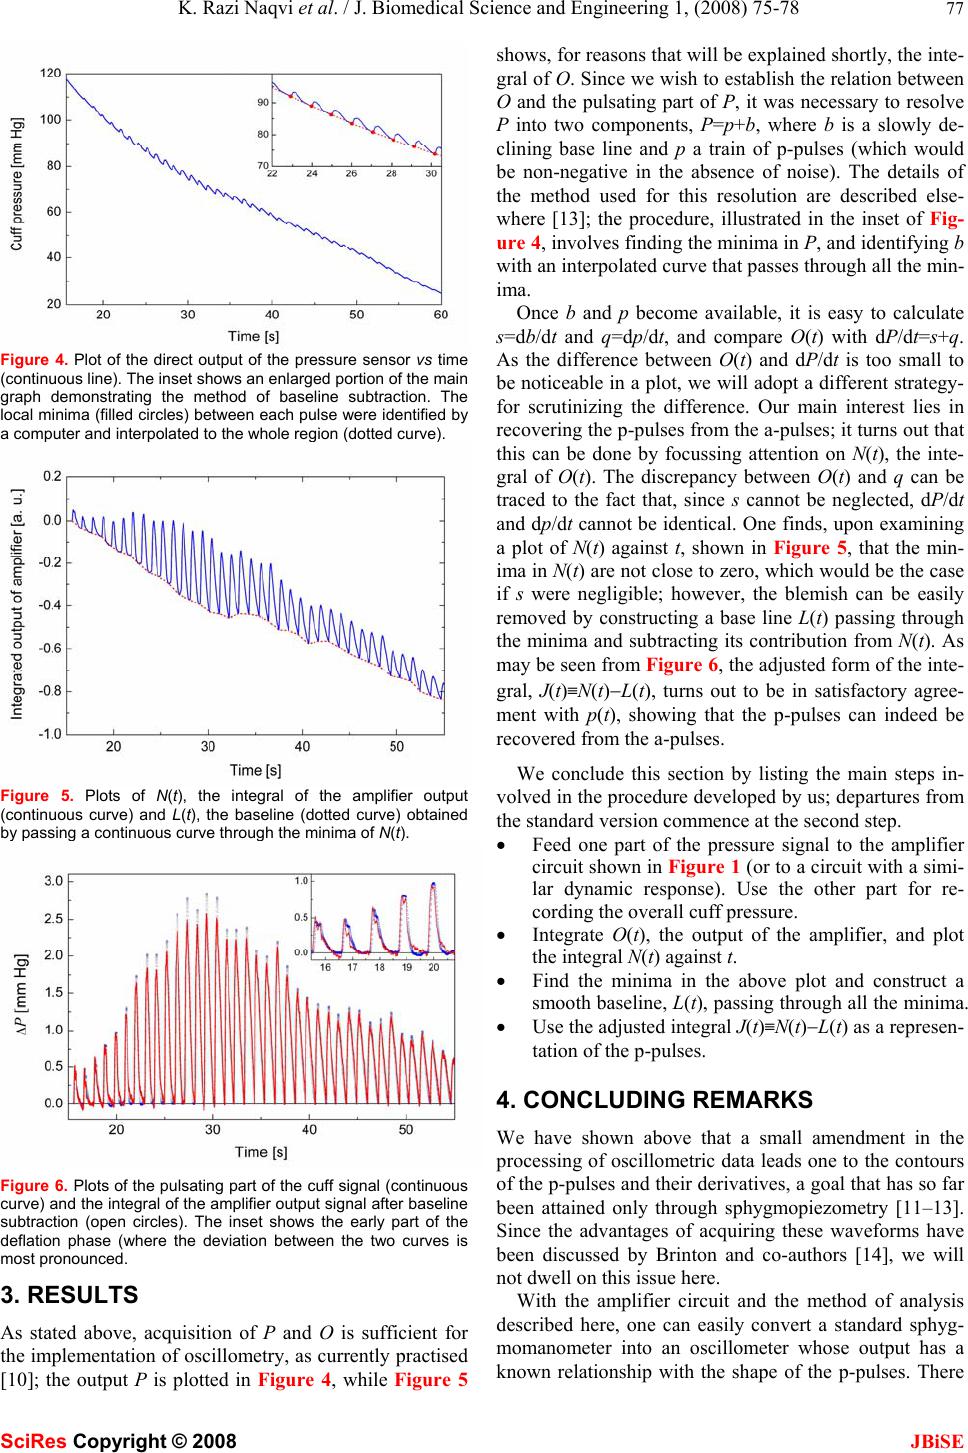 K. Razi Naqvi et al. / J. Biomedical Science and Engineering 1, (2008) 75-78 77 SciRes Copyright © 2008 JBiSE Figure 4. Plot of the direct output of the pressure sensor vs time (continuous line). The inset shows an enlarged portion of the main graph demonstrating the method of baseline subtraction. The local minima (filled circles) between each pulse were identified by a computer and interpolated to the whole region (dotted curve). Figure 5. Plots of N(t), the integral of the amplifier output (continuous curve) and L(t), the baseline (dotted curve) obtained by passing a continuous curve through the minima of N(t). Figure 6. Plots of the pulsating part of the cuff signal (continuous curve) and the integral of the amplifier output signal after baseline subtraction (open circles). The inset shows the early part of the deflation phase (where the deviation between the two curves is most pronounced. 3. RESULTS As stated above, acquisition of P and O is sufficient for the implementation of oscillometry, as curren tly practised [10]; the output P is plotted in Figure 4, while Figure 5 shows, for reasons th at will be explained sh ortly, the in te- gral of O. Since we wish to establish the relation between O and the pulsating part of P, it was necessary to resolve P into two components, P=p+b, where b is a slowly de- clining base line and p a train of p-pulses (which would be non-negative in the absence of noise). The details of the method used for this resolution are described else- where [13]; the procedure, illustrated in the inset of Fig- ure 4, involves finding the minima in P, and identifying b with an interpolated curve that passes through all the min- ima. Once b and p become available, it is easy to calculate s=db/dt and q=dp/dt, and compare O(t) with dP/dt=s+q. As the difference between O(t) and dP/dt is too small to be noticeable in a plot, we will adopt a different strategy- for scrutinizing the difference. Our main interest lies in recovering the p-pulses from the a-pulses; it turns out that this can be done by focussing attention on N(t), the inte- gral of O(t). The discrepancy between O(t) and q can be traced to the fact that, since s cannot be neglected, dP/dt and dp/dt cannot be identical. One finds, upon examining a plot of N(t) against t, shown in Figure 5, that the min- ima in N(t) are not close to zero, which would be the case if s were negligible; however, the blemish can be easily removed by constructing a base line L(t) passing through the minima and subtracting its contribution from N(t). As may b e s e en f ro m Figure 6, the adjusted form of the inte- gral, J(t)≡N(t)−L(t), turns out to be in satisfactory agree- ment with p(t), showing that the p-pulses can indeed be recovered from the a-pulses. We conclude this section by listing the main steps in- volved in the procedure developed by us; departures from the standard version commence at the second step. • Feed one part of the pressure signal to the amplifier circuit shown in Figure 1 (or to a circuit with a simi- lar dynamic response). Use the other part for re- cording the overall cuff pressure. • Integrate O(t), the output of the amplifier, and plot the integral N(t) against t. • Find the minima in the above plot and construct a smooth baseline, L(t), passing through all the minima. • Use the adjusted integral J(t)≡N(t)−L(t) as a represen- tation of the p-pulses. 4. CONCLUDING REMARKS We have shown above that a small amendment in the processing of o scillometric data leads one to th e contours of the p-pulses and their derivatives, a goal that has so far been attained only through sphygmopiezometry [11–13]. Since the advantages of acquiring these waveforms have been discussed by Brinton and co-authors [14], we will not dwell on this issue here. With the amplifier circuit and the method of analysis described here, one can easily convert a standard sphyg- momanometer into an oscillometer whose output has a known relationship with the shape of the p-pulses. There  78 K. Razi Naqvi et al. / J. Biomedical Science and Engineering 1, (2008) 75-78 SciRes Copyright © 2008 JBiSE is at least one commercial instrument that allows the user to record both P and O [10]. This means that the time is now ripe for establishing reliable and device-independent criteria for deducing sbp and dbp from oscillometric data. We conclude by drawing attention to another point of practical importance. The amplifier circuit used in this study follows the approach chosen by previous oscil- lometrists, but the data presented here indicate that an appropriately designed operational differentiator would perform equally well; if the cuff deflation (or inflation) is arranged to be a linear ramp [11, 12], dP/dt and dp/dt would differ only by a constant, making the task of base- line correction a trivial matter. REFERENCES [1] Hill, L. (1898) On rest, sleep, and work and the concomitant changes in the circulation of the blood. Lancet, 151, 282–285. [2] Erlanger, J. (1916) Studies in blood pressure estimations by indirect methods: I. The mechanism of the oscillatory criteria. Am. J. Physiol., 39, 401–446. [3] Burch, G.E. and DePasquale, N.P. (1962) Primer of Clinical Measurement of Blood Pressure, C. V. Mosby Ed. St. Louis CO 1962, 15−36. [4] Corall, I.M. and Strunin, L. (1975) Assessment of the Von Recklinghausen oscillotonometer. Anaesthesia, 30, 59–66. [5] Mauck, G.W., Smith, C.R., Geddes, L.A. and Bourland, J.D. (1980) Meaning of the point of maximum oscillations in cuff pressure in the indirect measurement of blood-pressure⎯Part II. Trans ASME, 102, 28–33. [6] Geddes, L.A., Voelz, M., Combs, C., Reiner D. and Babbs, C.F. (1982) Characterization of the oscillometric method for measuring indirect blood-pressure. Ann. Biomed. Eng., 10, 271–280. [7] Chua, C.S. and Hin, S.M. (2005) Digital blood pressure meter. Freescale Semiconductor, (http://www.freescale.com/files/sensors/ doc/app_note/AN1571.pdf.) [8] Middelhoek, S. and Noorlag, D.J.W. (1981) Silicon micro- transducers. J. Phys. E: Sci. Instrum., 14, 1343–1352. [9] Silas, J.H., Barker, A.T. and Ramsay, L.E. (1980) Clinical- evaluation of dinamap-845 automated blood-pressure recorder. Br. Heart J., 43, 202–205. [10] Amoore, J.N. (2006) Extracting oscillometric pulses from the cuff pressure: does it affect the pressure determined by oscillometric blood pressure monitors? Blood P r ess. Monit., 11, 269–279. [11] Baker, P.D., Orr, J.A., Westenskow, D.R. and Egbert, T.P. Method for determining blood pressure utilizing a neural network. U.S. Patent 5,339,818, A u g u s t 2 3 , 1994. [12] Jazbinsek, V., Luznik, J. and Trontelj, Z. (2005) Non-invasive blood pressure measurements: separation of the arterial pressure oscillometric waveform from the deflation using digital filtering. IFBME proceedings of EMBEC’05, (http://fizika.imfm.si/ jazbinsek/konf2005/2268F.pdf) [13] Naqvi, K.R., Parigi, L., Vellani, C.W. and Kumar, S. (2008) Noninvasive method for determining blood pressure and contours of arterial and volume pulses. JBiSE,1,79-84. [14] Brinton, T.J., Cotter, B., Kailasam, M.T., Brown, D.L., Chio, S., O’Connor, D.T. and DeMaria, A.N. (1997) Development and validation of a noninvasive method to determine arterial pressure and vascular compliance. Am. J. Cardiol., 80, 323–330. |