 Journal of Power and Energy Engineering, 2015, 3, 319-325 Published Online April 2015 in SciRes. http://www.scirp.org/journal/jpee http://dx.doi.org/10.4236/jpee.2015.34043 How to cite this paper: Closepet, A.S. and Rao, K.U. (2015) Supply Side Management for Cost Optimization in Developing Countries Suffering with Power Outage. Journal of Power and Energy Engineering, 3, 319-325. http://dx.doi.org/10.4236/jpee.2015.34043 Supply Side Management for Cost Optimization in Developing Countries Suffering with Power Outage Amit S. Closepet1, K. Uma Rao2 1Renewable Energy Wing, Spectrum Consultants, Bangalore, India 2RV College of Engineering, Visvesvaraya Technical University, Bangalore, India Email: amit.s.closepet @spectrumconsultan ts.co.in, drumaraok@g mail.com Received January 2015 Abstract In this increasingly growing population especially in the developing countries, it is almost impos- sible to solve the energy crisis. This has led to the extreme growth of the back up power genera- tion industry such as Diesel generators and home invertors. From the last couple of years the solar PV technology has started to penetrate in these geographies. This paper discusses on the supply side management of the electricity sources available to a consumer to manage his outage and also the over all cost optimization, as the cost of energy from every source is different and it also de- pends on the load curve, last but not the least also as to what time of the day what source or com- bination of sources have been used. Keywords PV Panel, Supply Side Management, Bi-Directional Pumping, MATLAB, Energy Cost Optimization 1. Introduction The energy demand of the world is rising exponentially with current annual power consumption rate of ap- proximately 13 trillion watts, or 13 terawatts (TW) [1]. It is projected to more than double by 2050 and more than triple by the end of the century. One can look at two scenarios to assuage this situation, finding alternative energy sources and or utilizing the available energy judiciously. Even with the intense energy conservation and efficiency methods, due to increase in Earth’s population growth and rapid technology development, the fossil fuels which are currently the major energy source will fall short of this demand and the world is likely to have an energy crisis. Solar Energy is by far the largest of all carbon-neutral energy sources [1]. More energy from sunlight strikes the Earth in one hour (4.3 × 10²⁰ J) than all the energy consumed on the planet in a year (4.1 × 10²⁰ J). Among the non-conventional, renewable energy sources, solar energy affords great potential for conversion into electric power, able to ensure an important part of the electrical energy needs of the planet. Solar energy is free, practically inexhaustible, and involves no polluting residues or greenhouse gas emissions. The conversion principle of solar light into electricity, called Photo-Voltaic or PV conversion, is not very new, but the efficiency  A. S. Closepet, K. U. Rao enhancement of the PV conversion equipment is still one of the top priorities for many academic and/or indus- trial research groups all over the world [2]. With its abundance of sunlight, India being a tropical country has tremendous potential to emerge as one of the leaders in solar power generation. India is one of the few countries in the world that has a dedicated Ministry for New and Renewable energy (MNRE). In India, the high GDP growth rate has created a huge demand for en- ergy, but the supply is unable to match the demand leading to a 13% deficit. In the long run, it is expected that solar energy especially solar PV will form a vital component of the country’s energy mix. The Jawaharlal Nehru National Solar Mission [3] has set the ambitious target of deploying 20,000 MW of grid connected solar power by 2022. It is aimed at reducing the cost of solar power generation in the country through (1) long term policy; (2) large scale deployment goals; (3) aggressive R&D; and (4) domestic production of critical raw materials, components and products, as a result to achieve grid tariff parity by 2022. Government of India is now encouraging installation of small scale solar panels (1 kW) on roof tops to make electricity consumption at least partially self-sufficient. Due to these periodic power cuts [4], invariably every establishment will have 4 sources of power grid, diesel generator, solar, batter y. In this paper 6 different possible scenarios on supply side management is discussed, this paper mainly helps the consumers to decide which source of energy or which combination of energy sources to be chosen to achieve cost optimization during outages. 2. Load Curve The individual load curve characteristics for various developing countries such as India, Sri Lanka, South Africa etc., is discussed in this section [5]-[8]. The load consumption data for 24 hours is obtained for a geographical location of Bangalore. The various loads that are being used in this geography involve Geyser, Washing ma- chine, Television, Air conditioner, Dryer, Dishwasher and other loads. A day ahead load curve is obtained by adding the different loads that are used in the previous day. For simple and better understanding, we have as- sumed these loads have flat power characteristics. 3. Methodology MATLAB methodology/code simulation approach used to model the supply side Cost Optimization for sched- uled outages is described in this section. The MATLAB code is built in such manner that it fetches the individ- ual load characteristics, solar insolation characteristics, baseline grid cost, baseline diesel cost and solar grid pumping costs from various excel files. These excel files can be edited for individual load characteristics as well as solar insolation characteristics. The outage start time and outage end time are obtained from the user. Once all the inputs are ready, MATLAB GUI is used to run the code. It initially prompts the user to enter the outage start time and outage end time. On reception of these inputs, outage interval for the day is calculated. Depending on the generated outage interval, the code generates four results for each of the six cases that are defined in the next section. The four results are total cost, grid cost, die- sel cost and cost from solar grid pumping for the present day. The baseline costs assumed for the grid is Rs5/KWhr, the baseline diesel costs assumed in the simulation are Rs20/KWhr and the baseline solar grid pumping costs are assumed to be Rs9.56/KWhr as per KREC norms [6M]. Since the calculations are done in an hourly basis, we have divided the day into chunks of 1 hour each, so 24 hours is considered as 24 chunks. 4. General Terminologies Let “t” denote hourly time variable where 1 ≤ t ≤ 24. Let “lc(t)” denote load power requirement in KW at any hour “t”. Let “sp(t)” denote solar generated power in KW at any hour “t”. Let “tos ” be the outage start time. Let “toe” be the outage end time. Let “gc” be the grid cost set by the elec- tricity board per KWhr. Let “spc” be the solar grid pumping cost per KWhr. Let “dgc” be the diesel generator cost per KWhr. Let “GC” be an array of length 24, such that “GC (t)” denote the grid price at any hour “t”. Let “OM” be an array of length 24, such that:  A. S. Closepet, K. U. Rao “OM(t)” = {1, tos ≤ t < toe and 0, otherwise}, which denotes the outage interval. Let “m” be an array of length 24, such that “m (t)” denotes the cost at any particular hour. Let “x” be an array of length 24, such that “x(t)” denotes the additional pricing involved at any hour “t”. Let “dgamt” be the total amount spending on diesel generator backup per day. Let “sp a mt” be total amount earnings by solar grid pumping per day. Let “tpeak” indicate the time (hour) when the outage occurs at the start of the peak load hour. Let “teod” be the time (hour) indicating the end of the day. Let “bct” be a variable indicating the amount of energy stored in a battery at the end of the present hour (or the start of the next hour). Let “bct–1” be a variable indicating the amount of energy stored in a battery at the end of the previous hour (or the start of the present hour). Let “tos” indicate outage start time. Let “toe” indicate outage end time. 5. Algorithm For a particular geographical area facing scheduled outages, the algorithm provides the user with optimum solu- tions for both residential as well as commercial organizations. The solutions consists of maximum cost savings, savings on diesel cost, maximum earnings from solar grid pumping and optimum backup during outages. The user, as per his/her convenience may choose any of the solutions provided. The supply side Cost Optimization algorithm involves six cases, each case is explained below. CASE 1: This case consists of following conditions i.e., No backup during outage, Continuous power genera- tion from solar and simultaneous grid pumping, No use of Diesel generator and No storage of solar energy in a battery. The cost equations for the present case are given below. GC(t) = {0, for tos ≤ t ≤ toe i.e. during outage and gc, otherwise} m(t) = lc(t) * GC(t) – sp(t) * spc, Hourly cost [negative sign implies that cost is reduced by solar grid pump- ing]. Dgamt = 0, since no diesel generator is used. spa mt . This case is similar to regular residential conditions i.e. with a grid tied rooftop PV system (without battery), where there is no backup during outage. CASE 2: The cost equations for this case are given below. This case consists of the following sources i.e., Diesel Generator backup during outage, Continuous power generation from solar and simultaneous grid pump- ing. GC(t) = {dgc, for tos ≤ t < toe i.e. during outage and gc, otherwise} m(t) = lc(t) * GC(t) – s p(t) * spc, Hourly cost. The total cost, Cost2 . dgamt () () = = = ∗ ∑ t toe t tos lctGC t . spamt . This case is relevant to commercial organizations where backup is provided by diesel generator and solar power is used for grid pumping. CASE 3: This case consists of following conditions i.e., No storage of solar energy, continuous power gener- ated from solar is pumped back to the grid, except during an outage and Diesel generator backup, during outage. In this case, solar power generated from PV panels is used to fulfil the load requirement during the outage. If the generated solar power is found to be in excess, the excess energy is pumped to the grid or if the generated en- ergy is insufficient, then the extra energy required is supplied by diesel generator. The cost equations are given below. GC(t) = {0, for tos ≤ t < toe i.e. during outage and gc, otherwise}. x(t) = {[lc(t) – sp(t)] * spc, when lc(t) ≤ sp(t), [lc(t) – sp(t)] * dgc, when lc(t) > sp(t), both for tos ≤ t ≤ toe and, – sp(t) * spc, otherwise}  A. S. Closepet, K. U. Rao m(t) = lc(t) * GC(t) + x(t), Hourly cost. The total cost, Cost3 dgamt ( ) 1[( )] − = = −∗ ∑toe t tos lctsp tdgc , only when lc(t) > sp(t). spa mt = [–( + + {only when lc(t) < sp(t)})] This case can be observed in individual homes and commercial organizations where the user reduces his spending on diesel generator backup by using the available solar energy. CASE 4: This case involves following conditions i.e., the solar energy is stored in a battery until outage oc- curs and the stored solar energy is used to power the load. If the stored energy, along with the real time solar generation is more than the load requirement, then the excess energy is stored for next outage hour or is pumped to the grid if there is no outage in the consecutive hour. The extra energy is provided by the diesel generator if stored energy is found to be less than the load requirement. After the outage, the real time generated solar energy is pumped to the grid. If any energy is found to be remaining in the battery at the end of the last hour, then it is also pumped to the grid. The cost equations are provided below. GC(t) = {0, for tos ≤ t < toe i.e. during outage and gc, otherwise}. bct = { , indicating that the battery is charged by the solar energy until outage. bct–1 – lc(t) + sp(t), when bc > (sp(t) – lc(t)) and t ≠ toe – 1, where tos < t < toe, until bc = 0 {Here, the solar generated energy is stored in battery and the same time, is used to power the load} x(t) = {[lc(t) – bc – sp(t)] * spc, when lc(t) < (sp(t) + bc) and t = toe – 1, 0, when lc(t) < (sp(t) + bc) and t ≠ toe – 1 [lc(t) – bc – sp(t)] * dgc, when lc(t) < (sp(t) + bc), all for tos ≤ t < toe, and – sp(t) * spc, otherwise}. m(t) = lc(t) * GC(t) + x(t), Hourly cost. The total cost, Cost4 = . dgamt = 1 [ ()()] − = −− ∗ ∑ toe t tos lc tbcsp tdgc , when lc(t) > (sp(t) + bc). spamt = [–( + x(t) {when lc(t) < (sp(t) + bc) and t = toe – 1} + bc * spc {for bc ≠ 0 when t = 24})] This case can be related to residential buildings where the user stores the solar energy in battery, so that he/she can use it during outage. This case is very synonym to the working of Grid Tied Rooftop PV system (with battery). CASE 5: This case consists of following characteristics i.e., Real time comparison of solar power and grid power is done, generated solar energy is used to power the load throughout the day. If generated power exceeds the load requirement, then the extra energy is pumped to the grid. When the solar energy is not sufficient to power the load, grid power is used and during outage, if such a deficit occurs, then the required energy is pro- vided by diesel generator. The cost equations are as follows. GC(t) = {dgc, for tos ≤ t < toe i.e. during outage and gc, otherwise}. m(t) = {[lc(t) – sp(t)] * spc, when lc(t) ≤ sp(t), for 1 ≤ t ≤ 24 [lc (t) – sp(t)] * dgc, for tos ≤ t < toe or [lc (t) – sp(t)] * gc, otherwise, both when lc(t) > sp(t)} The total cost, Cost5 , dgamt = , only for “t” where lc(t) > sp(t) spamt = , only for “t” where lc(t) ≤ sp(t) This case can be observed in residential locations where the user can reduce his electricity bill by using the available solar energy to power the load. CASE 6: This case is characterized for outages during peak load consumption. In this case, solar energy is stored in battery for outages during peak load hours. For outage during peak load hours, the battery powers the load. If the stored battery charge is less than the load requirement, then the diesel generator provides the extra energy required. But, if the stored battery energy is more than required, then it powers the load and left over en- ergy is stored in battery for next peak load hour or, if there is no peak load hour after the present peak under 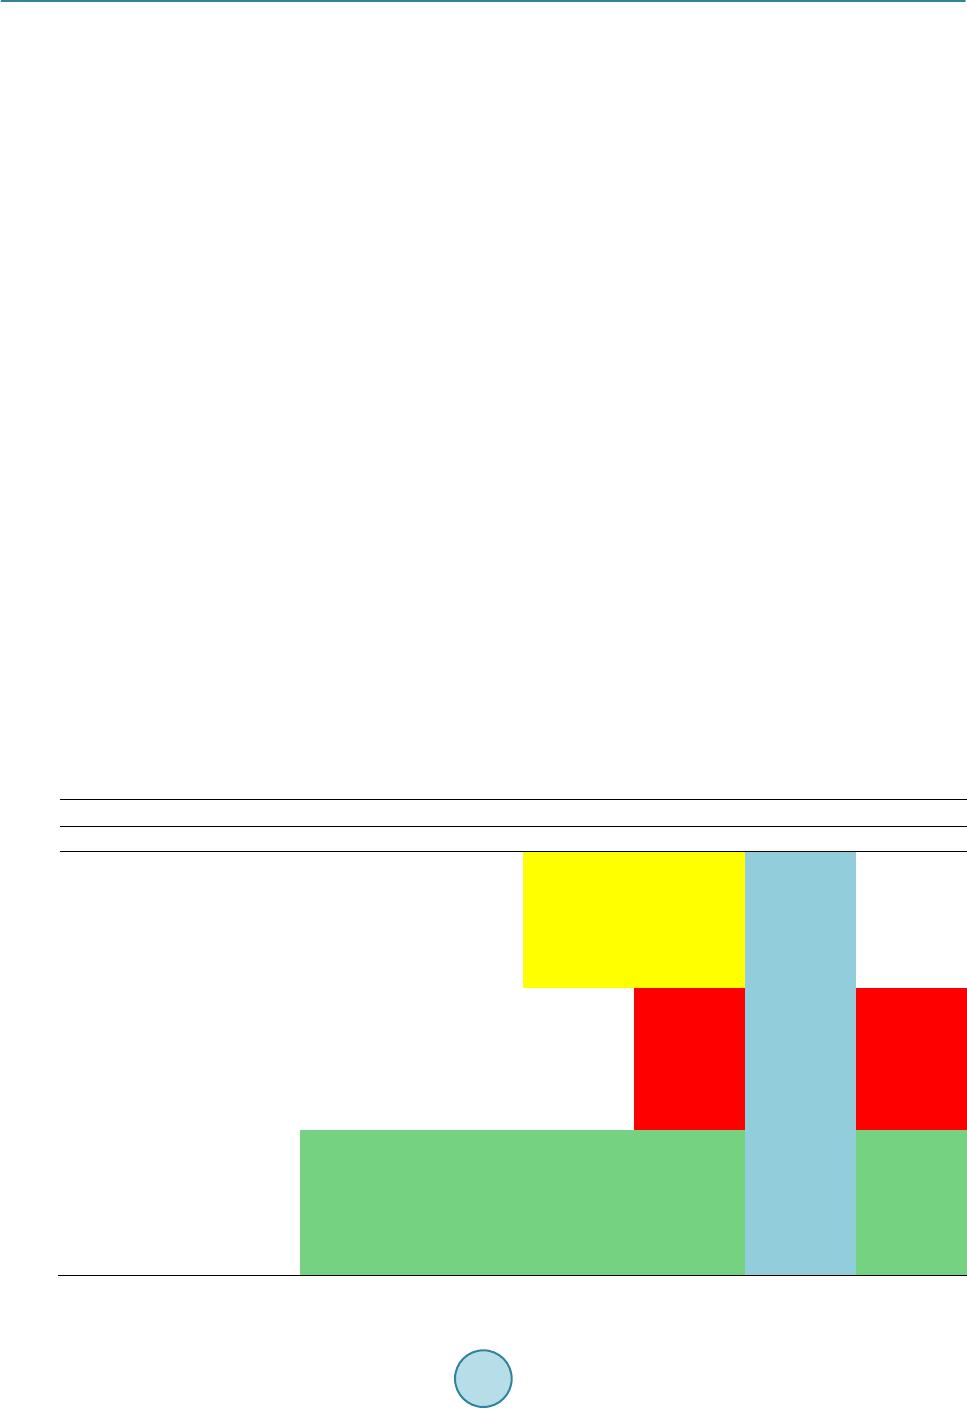 A. S. Closepet, K. U. Rao outage, then it is pumped to the grid. For outages, not during peak load hours, then load is backed up by diesel generator and the battery stores solar energy until peak load hour only if there is a peak load hour between the outage duration. Else, real time solar grid pumping is done. GC(t) = {0, for tos ≤ t < toe i.e. during outage and gc, otherwise} bct = { , when tos < toe < tpeak; , when tos ≤ tpeak < toe; , when tos > teod; bct–1 – lc(t) + sp(t), when bc > (sp(t) – lc(t)) and lc(t + 1) > 2000 {i.e. there is peak in the next hour}, for “t” such that tos ≤ tpeak < toe, until bc = 0} x(t) = {[lc(t) – bc – sp(t)] * spc, when lc(t + 1) < 2000 and 0, otherwise, both when lc(t) < (bc + sp(t)) and tos ≤ tpeak < toe; [lc(t) –bc – sp(t)] * dgc, when lc > (bc + sp(t)) and tos ≤ tpeak < toe; lc(t) * dgc – sp(t) * spc, when tos < toe < tpeak; –bc *spc, when bc ≠ 0 at t = teod; –sp(t) * s pc, when tpeak > tos > toe} Hourly cost, m(t) = lc(t) * GC(t) + x(t) The total cost, Cost6 = . dgamt = ( ) 1 [( )] − = −− ∗ ∑toe t tpeak lctbcsptdgc {when lc > (bc + sp(t) )} + {when tos < toe < tpeak or tpeak > tos > toe} spa mt = [-( ( ) 1[( )] − =−− ∗ ∑toe t tos lctbcsp tspc {when lc(t) < (bc + sp(t)) and lc(t + 1) < 2000 (i.e. when there is no peak in next paper)} + bc * spc {when bc ≠ 0 when t = teod} + {for all “t” when tos < toe < tpeak and tpeak > tos > toe})] 6. Results Each day is divided into 3 slots i.e. morning from 6 am - 12 pm afternoon from 12 pm - 6 pm and evening from 6 pm to 12 am, this gives 18 different cases of outage scenarios as seen in Table 1. Table one gives the total cost Table 1. Total cost matrix. TOTAL COST MATRIX SL NO OUTAGE TIMINGS CASE 1 (Rs) CASE 2 (Rs) CASE 3 (Rs) CASE 4 (Rs) CASE 5 (Rs) CASE 6 (Rs) 2 6 am - 8 am 63.4 164.15 162.6 162.6 179.475 162.6 5 6 am - 11 am 44.25 240.75 225.25 225.25 238.075 236.1 8 12 pm - 2 pm 78.05 105.55 88.5 88.5 100.875 105.55 11 12 pm - 5 pm 42.05 249.55 213.9 176.7 220.875 176.7 12 12 pm - 6 pm 38.55 263.55 224.8 187.6 230.875 190.7 14 6 pm - 8 pm 77.7 106.95 105.4 88.815 122.275 106.95 16 6 pm - 10 pm 69.5 139.75 138.2 96.195 155.075 139.75 17 6 pm - 11 pm 65.4 156.15 154.6 99.885 171.475 156.15 18 6 pm - 12 am 59.3 180.55 179 105.375 195.875 180.55  A. S. Closepet, K. U. Rao matrix for a consumer for every case of outage with different combinations of supply. As it can be observed in Table 1 that case 3 & case 4 (red) are best suited for the lowest cost for the morning period, well the case 1 cannot be considered as it does not involve diesel generators. Similarly it can be observed that in the afternoon slot case 4 and case 6 (yellow) seems to be the lowest cost and for the evening case 2, 3, 4 & 6 (green) makes sense and appear to be the lowest. It is very interesting observation that though case 5 (blue) seems to be little expensive now it could become the lowest once the diesel price shoots up in the future. Table 2 below shows the diesel consumption for different outages duration, the lowest diesel consumption will be seen in case 4, but the case 4 includes the investment on a battery. Table 3 shows the highest grid pumping earnings will be seen in case 1 and case 2 obviously as it includes only grid pumping. It can be seen that the lowest earnings will be in case 5 as the solar power generated will be consumed by the consumer on real time basis. Table 2. Diesel cost matrix. SL NO OUTAGE TIMINGS CASE 1 (Rs) CASE 2 (Rs) CASE 3 (Rs) CASE 4 (Rs) CASE 5 (Rs) CASE 6 (Rs) 6 6 am - 12 pm 0 202.75 171.5 171.5 171.5 195.25 9 12 pm - 3 pm 0 87.5 47.5 0 47.5 27.5 12 12 pm - 6 pm 0 225 162.5 102.5 162.5 107.5 14 6 pm - 8 pm 0 29.25 26.75 0 26.75 29.25 16 6 pm - 10 pm 0 70.25 67.75 0 67.75 70.25 18 6 pm - 12 am 0 121.25 118.75 0 118.75 121.25 Table 3. Total solar earnings using grid pumping. SL NO OUTAGE TIMMINGS CASE 1 (Rs) CASE 2 (Rs) CASE 3 (Rs) CASE 4 (Rs) CASE 5 (Rs) CASE 6 (Rs) 2 6 - 8 47.5 47.5 46.55 46.55 10.925 46.55 4 6 - 10 47.5 47.5 41.8 41.8 10.925 44.65 6 6 - 12 47.5 47.5 35.625 35.625 10.925 44.65 7 12 - 13 47.5 47.5 44.65 44.65 10.925 47.5 8 12 - 14 47.5 47.5 37.05 37.05 10.925 47.5 9 12 - 15 47.5 47.5 32.3 14.25 10.925 24.7 12 12 - 18 47.5 47.5 23.75 0.95 10.925 2.85 15 18 - 21 47.5 47.5 46.55 28.595 10.925 47.5 18 18 - 24 47.5 47.5 46.55 1.425 10.925 47.5  A. S. Closepet, K. U. Rao 7. Conclusion Every establishment is different and has its own unique constraints, but the energy supplies are limited. Hence it is very important to choose the right combination of energy sources at right time of the day to achieve the best possible cost optimization possible. The case studies highlight the ease of use of the GUI developed, where the customers need not provide any technical details. The GUI can have wide applications in the domestic sector, to help consumers take a decision on installation of solar PV and also for the auxiliary supply in substations. Ma- jority of substations in India use battery backup for their auxiliary supply. Solar plants can serve as a smarter al- ternative to these fuel based systems in terms of cost saving over a longer term and serving green energy, reduc- ing the carbon footprint on our planet. References [1] (2005) Basic Research Needs for Solar Energy Utilization Report on the Basic Energy Sciences Workshop on Solar Energy Utilization. [2] Report, National Centre for Photovoltaic Research and Education (NCPRE) IIT Bombay Supported by Ministry of New and Renewable Energy, Govt. of India. [3] (2010) Jawaharlal Nehru National Solar Mission, Towards Building SOLAR INDIA. Ministry of New and Renewable Energy, India. http://www.mnre.gov.in/solar-mission/jnnsm/introduction-2/ [4] (2009) Real Cost of Pow er. Universal Consulting. [5] Closepet, A.S. (2014) Simple Real Time Non-Co-Operative Game Theoritic Model for Energy Cost Optimization in Developing Countries. APPEEC, Shangai. [6] Venkat Natarajan, Amit S. Closepet, “Statistical Analysis of Cost of Energy Due to Power Outages in Developing Countries”, 2012, Future Computing Conf Submission, France [7] Natarajan, V. and Closepet, A.S. (2012) De mand-Sid e Approaches To Manage Electricity Outages in Developing Countries. ENERGYCON, Florence. [8] Closepet, A.S. (2013) Multi -Layer Optimization for Load Scheduling to Manage Unreliable Grid Outages In Develop- ing Countries. APPEEC, Beijing.
|