Journal of Power and Energy Engineering, 2015, 3, 114-122
Published Online April 2015 in SciRes. http://www.scirp.org/journal/jpee
http://dx.doi.org/10.4236/jpee.2015.34017
How to cite this paper: Sun, Z.B., Li, K., Yang, Z.L., Niu, Q. and Foley, A. (2015) Impact of Electric Vehicles on a Carbon Con-
strained Power SystemA Post 2020 Case Study. Journal of Power and Energy Engineering, 3, 114-122.
http://dx.doi.org/10.4236/jpee.2015.34017
Impact of Electric Vehicles on a Carbon
Constrained Power System—A Post
2020 Case Study
Zhebin Sun1, Kang Li1, Zhile Yang1, Qun Niu2, Aoife Foley3
1School of Electronics, Electrical Engineering and Computer Science, Queen’s University Belfast, Belfast BT9
5AH, UK
2School of Mechatronic Engineering and Automation, Shanghai Key Laboratory of Power Station Automation
Technology, Shanghai University, Shanghai 200072, China
3School of Mechanical and Aerospace Engineering, Queen’s University Belfast, Belfast BT9 5AH, UK
Email: zsun03@qub.ac.uk, k.li@qub.ac.uk, zyang07@qub.ac.uk
Received January 2015
Abstract
Electric vehicles (EVs) offer great potential to move from fossil fuel dependency in transport once
some of the technical barriers related to battery reliability and grid integration are resolved. The
European Union has set a target to achieve a 10% reduction in greenhouse gas emissions by 2020
relative to 2005 levels. This target is binding in all the European Union member states. If electric
vehicle issues are overcome then the challenge is to use as much renewable energy as possible to
achieve this target. In this paper, the impacts of electric vehicle charged in the all-Ireland single
wholesale electricity market after the 2020 deadline passes is investigated using a power system
dispatch model. For the purpose of this work it is assumed that a 10% electric vehicle target in the
Republic of Ireland is not achieved, but instead 8% is reached by 2025 considering the slow mar-
ket uptake of electric vehicles. Our experimental study shows that the increasing penetration of
EVs could contribute to approach the target of the EU and Ireland government on emissions re-
duction, regardless of different charging scenario s. Furthermore , among various charging sc ena-
rios, the off-peak charging is the best approach, contributing 2.07% to the target of 10% reduction
of Greenhouse gas emissions by 2025.
Keywords
Carbon Emissions, Electric Vehicles, Power System, PL EXO S, Energy Forecasting
1. Introduction
In recent years, climate changes caused by carbon emissions have attracted considerable attention worldwide [1].
“WMO greenhouse gases bulletin” published by World Meteorological Organization in 2011 pointed out that
the concentration of greenhouse gases (GHG) in the atmosphere has reached a high record in 2010. The average
Z. B. Sun et al.
115
concentration of CO2 reached 389.0 ppm, while the Nitrous oxide reached 323.2 ppb, with the increase of 39%
and 20% respectively comparing with their counterparts during the industrial revolution [2]. The increased GHG
emissions are largely due to the use of fossil fuels. The atmospheric pollution produced by transportation indus-
try due to large usage of fossil fuel, oil and natural gas, has become a major issue, surpassing the traditional in-
dustrial pollution [3]. In terms of carbon emissions, transportation and electricity industry are the two key sec-
tors [4]. In the European Union (EU) there are strict binding GHG reductions targets and renewable energy tar-
gets called 20 - 20 by 2020 [5]. In each EU member state the targets have been implemented. For example in the
Republic of Ireland it is proposed that GHG emissions need to be cut by 60% - 80% by 2050 [6]. Carbon diox-
ide (CO2) emission is a major part of GHG which accounted for 80% of all GHG emissions in 1990-2010. Thus
the Irish government has set a target that CO2 emissions be reduc ed to 20% by 2020 in keeping with EU direc-
tives [7]. Transport is one of the main sectors dependent on fossil fuels, and is thus a maj or source of GHG
emissions. It is believed that electric vehicles (EV) can reduce heavy fossil fuel dependency, support better re-
newable power integration and thus reduce GHG emissions. In the Republic of Ireland, a country with a large
wind power resource the Irish government set a 10% EV target by 2020 [8]. Conseq ue ntly, it is thought that a
better reduction in GHG emissionsis achievable and increased security of energy supply by reducing oil imports
and more efficient wind power integration may be possible. However, there are many technical challenges re-
lating to mass EV deployment, such as battery reliability, as well as the impacts of stochastic charging and po-
tentially discharging on both the grid and the generators.
A number of studies have examined the interaction of EVs with the power system considering emissions. For
example, the CO2 emissions of battery electric vehicles (BEV) and plug-in hybrid electric vehicles (PHEV) are
compared in [9] [10] provides a bottom-up model of EV carbon emissions and energy impacts in the Republic of
Ireland.
In this p aper , the EV technologies are briefly reviewed and the impacts of EV charged in the all-Ireland single
wholesale electricity market after the 2020 deadline passes is investigated using a power system dispatch model
called PLEXOS for power systems. For the purpose of this work it is assumed that a 10% electric vehicle target
in the Republic of Ireland is not achieved, but instead 8% is reached by 2025 considering the slower market up-
take of electric vehicles. The test system is the single wholesale electricity market (SEM) of Northern Ireland
and the Republic of Ireland in 2025. Four different EV charging scenarios are analysed to determine increased
renewable energy penetration, the net reduction in CO2 emissions and the percentage contribution to the 2020
target.
2. Overview of EV Technology
2.1. Electric Vehicle Types
There are several types of EVs. The common types are BEVs and PHEVs. The BEV is powered by 100% elec-
tric energy, whereas PHEVs are powered by electric energy, as well as a downsized combustion engines. Both
types have an electric motor powered by a rechargeable battery. This battery is recharged by connecting it to a
power supply. A BEV does not emit any tail-pipe emissions because it operates in only electric mode. However,
a PHEV produces emissions when using their combustion engines to drive the car. Nevertheless, both types may
implicitly produce GHG emissions due to the need to charge the battery from the grid where thermal generation
units are in use.
2.2. Electric Vehicle Battery Charging
The preferred battery type for the majority of EV manufacturers is lithium-ion due to that it has a high storage
capacity. The current average battery driving range and battery capacity of commercial BEVs in the market are
130 km and 22 kWh respectively [11]. Battery performance of EVs and their ability to achieve stated driving
ranges is highly dependable on the driving styles and environment conditions.
There are three types of charging options available for EVs, including home charging, public charging and
fast charging. Table 1 shows the charging options [11].
3. Model of the SEM and EV Charging Scenarios
In order to assess the impact of different EV charging scenarios on the power system, a base line power system
Z. B. Sun et al.
116
Table 1. Battery charging options.
Type Electrical Resulting Charge
Home Charging 230V 16A 100% in 6 - 8 hours
Public Charging 400V 32A 50% in 30 mins
Fast Charging 400V 63A 80% in 30 mins
model is first built. PLEXOS is an MIP-based (mixed integer programming algorithm) software used for the
next-generation energy market simulation and optimization [12]. The software can realistically replicate the ac-
tual operation of generators in the physical market as all technical constraints can be modeled and obeyed.
PLEXOS can be used to minimize cost or maximize profit and to integrate the analysis of variable energy re-
sources. It could also be used for electrical market analysis.
3.1. SEM Test System
The Republic of Ireland and Northern Ireland share a synchronous power system known as the All -Island Gird
(AIG), which facilitates the operation of the SEM. The SEM system was built in PLEXOS using [13]. These are
based on published data from NERA Economic Consultants (2008), KEMA (2007) and Energy Regulation
(2011) [14]. GDP grossing function from Gross Domestic Product Preliminary Estimate 2014 association with
the growth of economy potential output and population growth curve were used to update 2007-2008 energy
load demand of Ireland for the year of 2025 [15]. Using gross domestic product predictions for Ireland and the
UK then load demand in each hour in a typical day by 2025 wa s extrapolated [16]. The totally load demand in
2025 as predicted to be 57,325 GWh.
The SEM 2025 baseline model needs a number of generation data and the generation schedule of 2025. In this
research the generation data was developed based on the report of SONI 2014 and EirGrid 2014 [17]. We have
updated the technical details for all the generators. The total predicted installed capacity for 2025 was estimated
to be 14,98 3 MW. Table 2 shows all the types of generators dispatched in the SEM by 2025 without an EV load.
It is obviously that gas, coal and wind generations were the three largest contributors to generation capacity.
It is forecasted that approximately 20,032 MWh are available for dispatch via wind generators and the wind
generation data was updated for EirGrid since 2009. It is assumed that the power supplied by wind generation is
limited to 70% of total energy demand.
The fuel price is set and updated for generation on the basis of the fuel market form UK Fuel Price forecast
report [18]. The carbon cost is set to £20/t for CO2, which is referenced with the carbon prices usually used in
PLEXOS, for instance, the carbon cost was set to £30/t in PRIMES EU-wide energy model. The fuel prices are
listed in Table 3.
The SEM is linked to the British Electricity Trading and Transmission Arrangement (BETTA) via the 500
MW Moyle Interconnector. It is assumed that any existing flow constraints on the Moyle Interconnector have
been removed by 2025. Another 500 MW interconnector is under construction between Rush, County Dublin to
Bark by Beach, North Wales, which is called as the East West Interconnector (EWIC). In the present work, it
was assumed that the EWIC commenced operation in 2012. Total interconnection to BETTA in PLEXOS in
2025 is represented as a single gas generator with 12 different heat rates and operating costs using the SEM va-
lidated market model produced by CER and UR (2011). This is because gas-fired generation is the predominant
marginal plant in the BETTA and there is a strong correlation between the cost of gas-fired generation and the
BETTA market price.
3.2. EV Charging Scenarios
An EV target has been set up by the Irish government that 10% of all vehicles fleet in all island should be re-
placed by EVs by 2025. It is assumed for this analysis that the 10% EV target may be difficult to achieve consi-
dering some of the existing challenges and slow EV sales. Therefore a figure of 8% EV market share was as-
sume d in 2025. Thus the total EVs is calculated to be 343,918 vehicles. Furthermore the EV types were limited
to just PHEV with a 3.3 kW and 16 kWh battery in this analysis. Four EV charging profiles were examined, in-
cluding 1) off-peak and 2) peak charging, 3) Electric Power Research Institute (EPRI) [19] EV charging data
Z. B. Sun et al.
117
Table 2. Generation mix for 2025 without EV load.
Fuel Generati on (GWh) Share of Generation (%)
Goal 6525.69 11.59
Distillate Oil 2.48 0.00
Gas 21797. 59 37.32
Hydro 1825.78 3.16
Pumped storage 152.49 0.27
Wav e 7 07.26 1.23
Wind 19979. 85 34.71
Peat 2788.59 4.84
Interconnectors 3756.76 6.86
Table 3. Fuel prices.
Fuel type Cost £/GJ
Gas 7.02
Oil 12. 06
Coal 2.12
Peat 3.18
Hydro 0
and 4) stochastic charging as illustrated in Figure 1 during a one day period.
1) Off-peak and peak charging profiles
Rate of EV domestic charging for PHEVs with a 16 kWh battery is shown in Table 4. Off-Peak charging pro-
file is obtained from this EV data associated with the No. of EV in Ireland using 0.88 efficiency if charging from
00:00. The charging power was calculated as 847.76 MW. It is as s u me d that 85% of EVs charge during the
week and 15% of EVs charge at the weekend when built the charging profile. Off-Peak charging data are listed
in Table 5. This charging profile has been expanded to the whole year of 2025. Then the results were added as a
purchaser load in PLEXOS 2025 baseline model. It can be seen that the EV’s Peak charging profiles are similar
with Off-Peak during the period of charging from 16:00 to 24:00.
2) EPRI Charging Profiles
An aggregated charge profile was created for the fleet of PHEVs in the model. 100% of the charge energy re-
quirements are apportioned to each hour of the day. The data of EPRI charging are listed in Table 6. In this
anal ysi s, it was as s umed that the highest charging loads occur during late night and early morning hours whereas
the modest loads from daytime. The public or workplace charging presumably occurred in the middle of the day.
Hours of minimal charging correspond roughly with commute times. This specific charge profile creates a sce-
nario where 74% of the charging energy is delivered from 10:00 p.m. to 6:00 a.m. (nominally off-peak). The
remaining 26% is provided between 6:00 a.m. to 10:00 p.m. It is one of the simplest scenarios among many
possible scenarios and it represents an initial approximation of aggregate charging behavior in a fleet of PHEVs.
The charging power was calculated as 467.73 MW.
3) Stochastic charging profiles
The stochastic charging profile is very similar to the EPRI charging profile, but it has a random percent value
for each hour. Both of EPRI and stochastic charging profiles’ function are number of all EVs multiplying 16
kWh for each PHEV capacity, and then multiplying the percent of each hour.
3.3. 2025 SEM Baseline Model
The power generation for the regular load demand in the SEM in 2025 is met by wind, gas and coal. As shown
in Table 2 that 34.71% of power comes from wind, 37.32% power from gas and 11.59% from coal. So the base
Z. B. Sun et al.
118
Figure 1. All type of EV charging profiles.
Table 4. Rate of EV domestic charging for PH EV s with 16 kWh battery.
Period State of Charge Charge Rate (kWh)
First 4 hours 73% 2.9
Intermediate 2 hours 90% 1.45
Final 2 hours 100% 0.58
Table 5. Off-Peak charging data for PHEV load demand.
Time of Charge 00:00 01:00 02:00 03:00
Weekday Load 847.7 847.7 847.7 847.7
Weekend Load 149.6 149.6 149.6 149.6
Time of Charge 04:00 05:00 06:00 07:00
Weekend Loa d 423.8 423.8 169.5 169.5
Weekend Load 74.8 74. 8 29.9 29.9
Table 6. Data of EPRI charging.
Tim e 01:00 02:00 03:00 04:00 05:00 06:00
Charge percent 10% 10% 9% 6% 4% 2%
Tim e 07:00 08:00 09:00 10:00 11:00 12:00
Charge percent 1% 0.5% 0.5% 1.5% 2.5% 2.5%
Tim e 13:00 14:00 15:00 16:00 17:00 18:00
Charge percent 2.5% 2.5% 2.5% 1% 0.5% 0.5%
Tim e 19:00 20:00 21:00 22:00 23:00 24:00
Charge percent 2% 4% 6% 9% 10% 10%
Z. B. Sun et al.
119
load is met mainly by gas and wind. Meanwhile, the gas generators will act as support generator when wind is
low. The results of baseline model for 2025 are shown in Table 7.
4. Resultsand Analysis
The validated SEM model [13] was a fundamental starting point to carry out this analysis as a complete set of
baseline transmission and generation data was already set-up in PLEXOS. As the EV load demand and charging
behaviors are highly unpredictable, different scenarios of EV charging, a range for load demands and charging
profiles were examined in the 2025 SEM model.
4.1. Off-Peak Charging in Model
Off-peak charging means to allocate all the charging power during off-peak load time periods. It can be clearly
seen from Figure 1 and Table 6 that the off-peak EV charging scenario makes a huge load on the baseline sys-
tem during the night from 00:00. The profiles of dispatch change due to the o ff -peak EV charging are illustrated
in Figure 2. Obviously, it could be found from Fig ure 2 that gas is the predominant energy to meet the EV load.
However, the additional demand from EV is also powered by other generators.
The profiles of off-peak load and base line load at 8th June 2025 were simulated using our model. It could be
found that the maximum power appears during the day time (Figure 3). The annual cost to all EV and average
price paid by purchaser are calculated as £61,568 and £195 respectively. EV renewable load of wind variability
during off-peak is 503.87 GWh and EV Renewable Load is 1259.67 GWh. EV Renewable Load (kTOE) is
108.33 GWh. Thus the contribution to 10% renewable energy target (%) of wind variability during off-peak is
estimated to be 2.07%. All outputs from the simulations in PLEXOS for each charging scenario, such as gene r a-
tion cost, system marginal price (SMP), emissions, cost of EV and so on, are reported in Tables 8-10, respec-
tivel y.
4.2. Annual Power System with EV Load
Annual power system characteristics for each scenario are reported in Table 11. It is found that the ability of
EVs to reduce GHGs emissions is highly relative to the multitudinous factors of generators in a generation port-
folio, the type of the charging portfolio and the time of day when charging.
Table 7. Power system characteristics of 2025 SEM .
Total Generation Cost,000) 1693576.61
Load-Weighted Average SMP/MWh) 55.56
Wind Curtailment Factor (%) 0.26
CO2 Emissions(kt) 15,851
NOx Emissions (kt) 50.12
SO
x
Emissions (kt)
39.38
Table 8. Power system characteristics of the 2025 sem with off-peak charging.
Charges in Total Generation Cost (£) 61568.29
Load-Weighted Average SMP (£/MWh) 55.91
Wind Curtailment Factor (%) 1.5
Annual Cost to Load per EV ) 195
Average Load-Weighted Price Paid by Purchase r(£)
52.57
Table 9. Emissions generated in 2025 sem due to off-peak charging.
Changes in Emissions PHEV
CO2 Emissions (kt ) 510.69
NOx Emissions (kt) 1.69
SO
x
Emissions (kt)
0.76
Z. B. Sun et al.
120
Table 10. Target contributions due to wind variability and off-peak.
EV Renewable Load (GWh) EV Renewable Load-2.5 Weighting (GWh) EV Renewable Load ( kTOE)
503.87 1259.67 108.33
10% renewable energy target (%) Net Reduction in CO2 (kt) 20% emissions target (%)
2.07 229.3 1.74
Table 11. Annual power system characteristics for each scenario.
Model Demand
(GWh ) Generation
(GWh ) CO2
(kt) NOx
(kt) SOx
(kt) SMP
(£ /MWh)
Total
generation
costs (£)
10%
renewable
target (%)
Net
reduction in
CO2 ( kt )
20%
emissions
target (%)
Base line 57536.4 57536.4 15,851 50.12 39.38 55.56 1.693576 - - -
Off-peak 58792.6 58790.3 510.69 1.69 0.76 55.91 1.755145 2.07 229.3 1.74
Peak 58857.8 58855.3 512.21 1.63 0.46 69.6 1.765830 1.74 227.75 1.68
Stochas tic 58846.7 58846.8 516.26 1.65 0.45 59.02 1.759621 1.92 223.7 1.65
EPRI 58843.8 58843.6 517.28 1.66 0.49 55.96 1.760463 2.04 222.68 1.74
Figure 2. Dispatch changes due to EV charging.
Figure 3. Profiles of off-peak load and base line load at 8th June 2025.
Z. B. Sun et al.
121
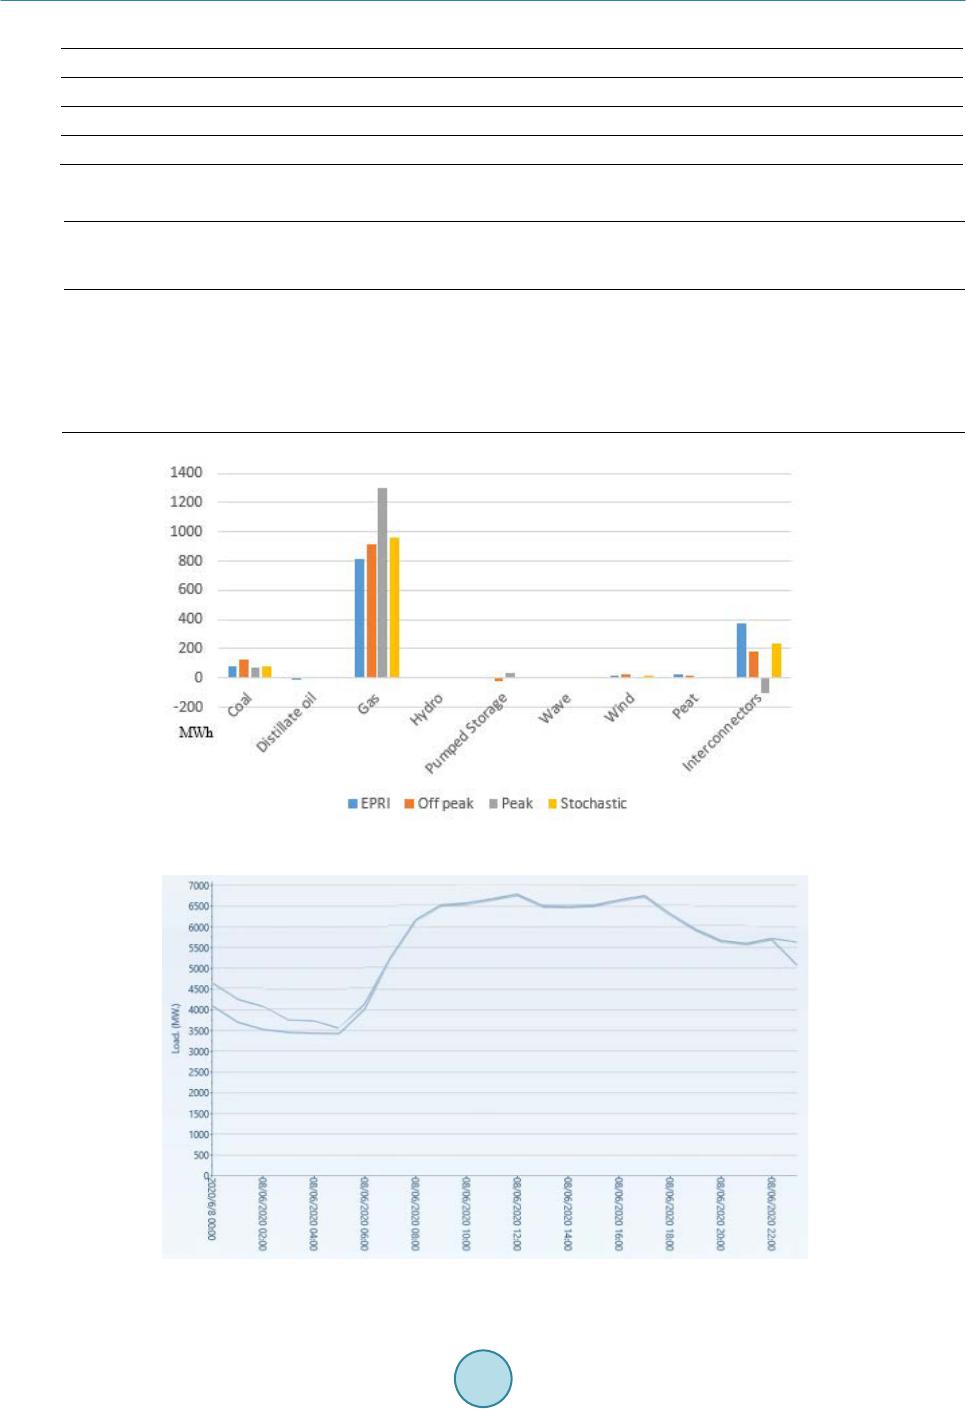
The EV load was predominantly charged by gas dispatch in all the charging scenarios as showed in Figure 2.
The gas was assisted by coal, wind, pumped hydro and interconnector power depending on the size of the EV
load and the period of charging. In addition, the same demand in different charging time will cause the change
of totally generation cost and emissions. The SMP is reduced from peak charging to off-peak or EPRI charging.
This indicates that if the EV owners charge their EV during the night time will save more for both themselves
and the SEM. The total generation and generation cost also will reduce by a proper time charging.
5. Conclusion
This paper has investigated the impacts of EV charging on the power system and SEM in a future case of 2025.
The SEM model and the four EV charging profiles are built in PLEXOS. The results from these all models were
analyzed to outline the effects of additional EV load combined in a future power system. The present investiga-
tion confirmed that the increasing penetration of EVs could contribute to approaching the target of the EU and
Ireland government in terms of emission reduction, regardless of different charging scenarios. In addition, it
could also be found that the off-peak charging is the best way to charge EV load by the comparison with other
three types of charging as shown in the previous research, contributing 2.07% to the target of 10% reduction of
Greenhouse gas emissions by 2025.
Acknowledgements
This work was financially supported by UK EPSRC under grant EP/L001063/1 and China NSFC under grants
51361130153 and 61273040. The authors would also like to thank PLE XO S for providing software and Eirgrid
SEMO and SONI for the datasets.
References
[1] International Energy Agency (IEA) (2008) World Energy Outlook. IEA and Organization for Economic Co-Operation
and Development (OECD), Paris.
[2] C om mission of the European Communities (2008) 2020 Europe’s Climate Change Opportunity. COM 30 F in al .
[3] Hao, H., Wang, H. and Yi, R. (2010) Hybrid Modelling of China’s Vehicle Ownership and Projection through 2050.
Energy, 36, 1351-136 1. http://dx.doi.org/10.1016/j.energy.2010.10.055
[4] Zivin, J., Kotchen, M. and M a n su r , E. (2014) Spatial and Temporal Heterogeneity of Marginal Emissions: Implications
for Electric Cars and Other Electricity-Shifting Policies. Journal of Economic Behavior & Organization, 107, 248 -268.
http://dx.doi.org/10.1016/j.jebo.2014.03.010
[5] Commission of the European Communities (2008) Communication from the Commission to the European Parliament,
the Council, the European Economic and Social Committee and the Committee of the Regions.2020 by 2020 Europe’s
Climate Change Opportunity. COM (2008) 30 Final.
[6] Gorml ey, J. ()2008 Government Sets Binding Target for 40% Power from Renewable Energy. Minister for Environ-
ment, Heritage and Local Government. [Press Release]
[7] European Parliament and Council of European Union. Decision No. 406/2009/EC, 2009.
[8] Foley, A., Gallachoir, B., Leahy, P. and McKeogh, E. (20 09 ) Electric Vehicles and Energy StorageA Case Study on
Ireland. IEEE Vehicle Power and Propulsion Conference, Dearbor n, 7-10 September 2009, 524 -530.
http://dx.doi.org/10.1109/VPPC.2009.5289805
[9] Doucette, R.T. and McCu lloch , M.D. (2011) Modeling the Prospects of Plug-In Hybrid Electric Vehicles to Reduce
CO2 Emissions. Applied Energy, 88, 2315-2323. http://dx.doi.org/10.1016/j.apenergy.2011.01.045
[10] F ole y, A. , Da ly, H. and Gallach ó ir, B. (2010) Quantifying the Energy & Carbon Emissions Implications of a 10%
Electric Vehicles Target. In: Proceedings of the 2010 International Energy Workshop.
[11] Foley, A., Winning, J. and Gallachoir, B. (2010) State-of-the-Art in Electric Vehicle Charging Infrastructure. IEEE
Vehicle Power and Propulsion Conference (VPPC), Lille, 1-3 Septe mbe r 2010, 1-6.
[12] PLEXOS User Manual.
[13] Foley, A. , Tyther, B., Calnan, P. and Gallachó ir, B. (2013) Impacts of Electric Vehicle Charging under Electricity
Market Operations. Applied Energy, 101, 93-102. http://dx.doi.org/10.1016/j.apenergy.2012.06.052
[14] Deane, J., Chiodi, A., Gargiulo, M., et al. (2012 ) S o ft -Linking of a Power Systems Model to an Energy Systems Model.
Energy, 42, 303 -312. http :// dx. doi. org/ 1 0.10 16/ j. ener gy.20 12. 03 .052
Z. B. Sun et al.
122
[15] Commission for Energy Regulation and Utility Regulator. Annual Load , Forecast, 2008.
[16] Medium and Long-Term Scenarios for Global Growth and Imbalan ces. http://www.oecd.org/berlin/50405107.pdf
[17] EirGrid and SONI Ltd. (2014) All-Island Generation Capacity Statement 2014-2023 .
[18] DECC Fossil Fuel Price Projections.
https://www.gov.uk/government/uploads/system/uploads/attachment_data/file/65698/6658-decc-fos s il -fuel -p rice-proje
ctions.pdf
[19] Electr ic Power Research Institute, Environmental Assessment of Plug-In Hybrid Electric Vehicles, Volume 2: United
States Air Quality Analysis Based on AEO-2006 Assumptions for 2030, 2007, Palo Alto, CA and National Resources
Defense Council, New York.