Y. L. Wang et al.
evaluation model and method [7] [8], etc.
Combined with the target and development direction of smart grid in China, this paper has built multi-objec-
tive effect evaluation indicator system of smart grid construction from five connotations including “strong and
reliable”, “clean and green”, “friendly and interactive”, “transparent and open”, “economical and effective” [9],
which can make a comprehensive and objective evaluation on the effect of smart grid construction.
2. Multi -objective Effect Evaluation Indicator System of Smart Grid Construction
2.1. Construction Principle of the Indicator System
Currently, the World Bank and the national government departments commonly adopt the SMART criterion to
select indicators, and the 5 letters of SMART represent specific, measurable, attainable, relevant and trackable.
The advantage of this criterion is having a relatively clear standard, which makes evaluation easy.
Considering the characteristics and connotations of smart grid, according to SMART criteria, this paper has
proposed the principle of establishing indicator system. 1) Comprehensiveness. Indicators should reflect the ac-
tion of each construction link as much as possible. 2) Independence. Various indicators in the same level should
have clear connotation, mutual independence and cannot overlap each other. 3) Typicality. Indicators should
make key points of construction stand out and grasp the main aspect of problem. 4) Measurability. Evaluation
indicators of each construction action should have the appropriate standards and use the same standard as uni-
fied evaluation dimension.
2.2. Five Connotations of Smart Grid
The State Grid Corporation has proposed the development train of thought about unified strong smart grid with
Chinese characteristics, which is “one goal, two main lines, three stages, four systems, five connotations, six
links”. The five connotations are:
1) Strong and reliable, which mean strong grid structure, strong power transmission capacity, safe and reliable
power supply ability.
2) Clean and green, which mean promoting development and utilization of renewable energy, reducing energy
consumption and pollutant emission, and improving the proportion of clean energy in final energy consumption.
3) Friendly and interactive, which mean flexible adjustment of power grid operation mode, easy for various
types of power and users accessing or exiting the grid, promoting the generation companies and users to actively
participate in grid operation regulation.
4) Transparent and open, which mean the transparent and shared information of power grid, power sources
and users, and open grid without discrimination.
5) Economical and effective, which mean improving the operation and transportation efficiency of power grid,
reducing operating costs, promoting the efficient utilization of energy resources and electric power assets.
According to these five connotations above, the effect evaluation indicator system of smart grid construction
extracts effect indicators from each construction link of smart grid, which can embody the smart grid characte-
ristics scientifically and comprehensivel y.
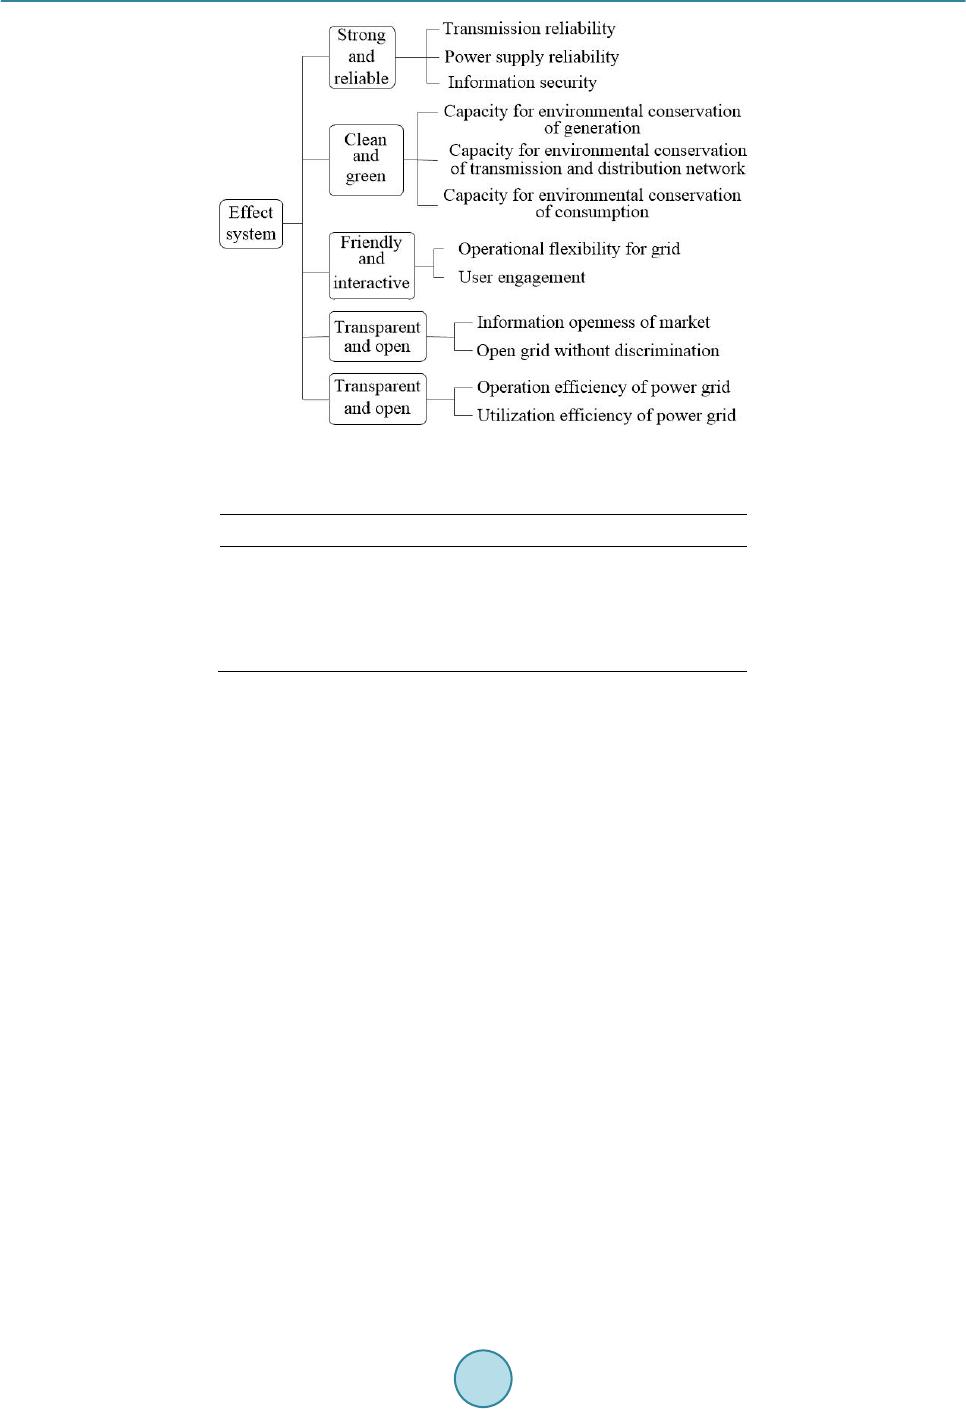
2.3. Multi-Objective Effect Evaluation Indicator System
The smart grid has five connotations including “strong and reliable”, “clean and green”, “friendly and interac-
tive”, “transparent and open”, “economical and effective”, which are embodied in the power generation, trans-
mission, transformation, distribution, consumption, dispatching and information communication platform of
smart grid. Build multi-objective effect evaluation indicator system of smart grid construction based on these
connotations, as shown in Table 1.
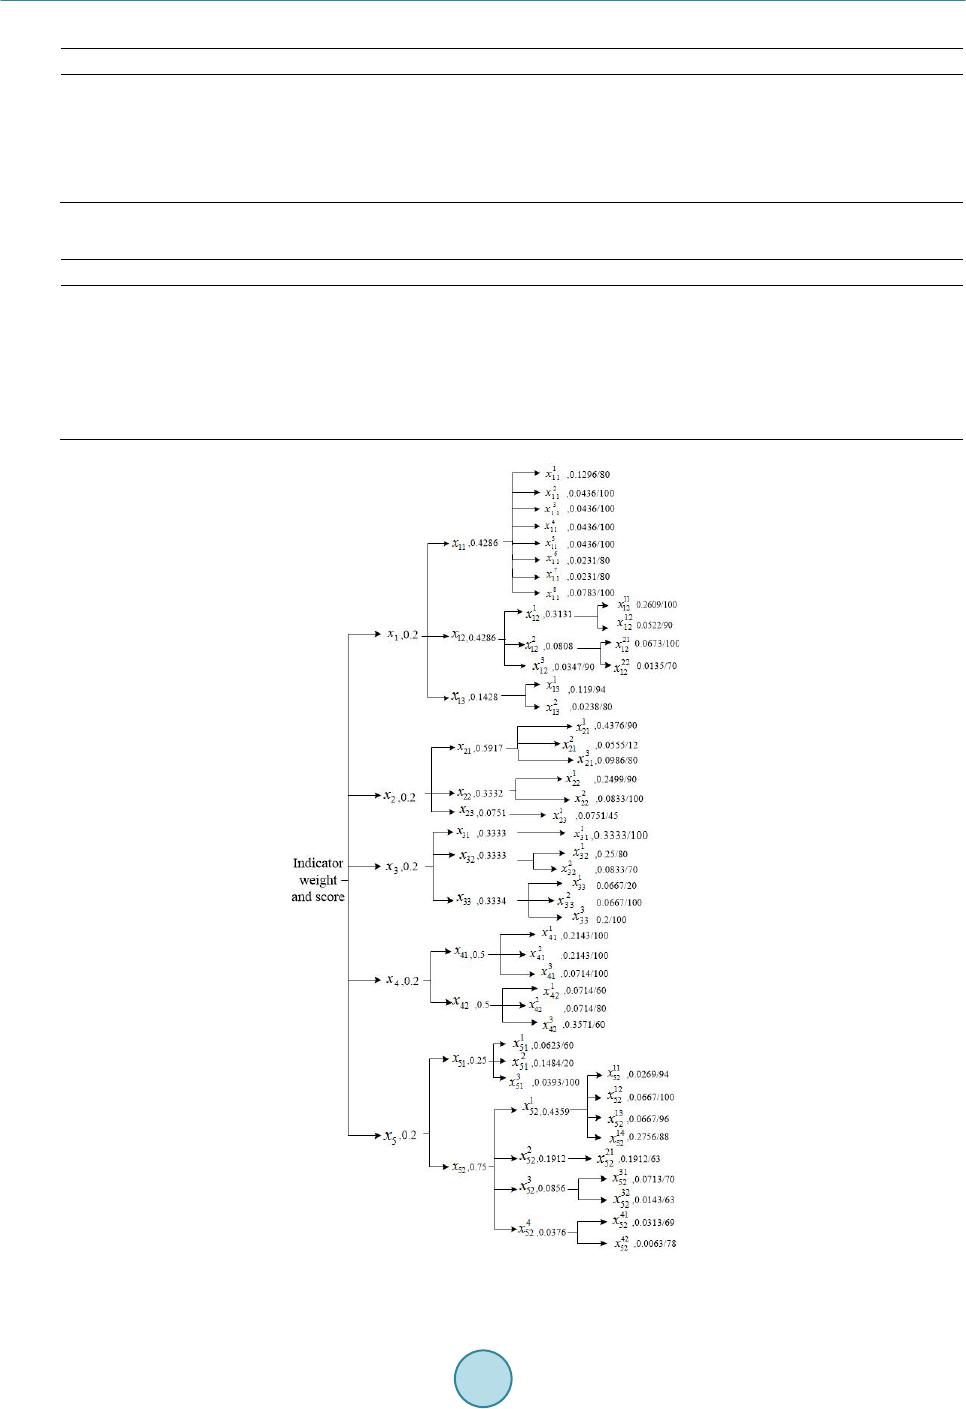
3. Effect Evaluation Model Based on AHP
3.1. Determine the Weight of Indicators by AHP
The multi-objective effect evaluation indicator system of smart grid construction has obvious hierarchical struc-
ture, as shown in Figure 1. Because there are more species and quantity of indicator, and the indicator system is
large, it is suitable to use AHP to solve the problem of reasonable weight of indicator and then evaluate the