 Psychology 2011. Vol.2, No.3, 187-201 Copyright © 2011 SciRes. DOI:10.4236/psych.2011.23030 Self-Regulation of Goals and Performance: Effects of Discrepancy Feedback, Regulatory Focus, and Self-Efficacy* Jessica M. Nicklin1#, Kevin J. Williams2 1Department of Psychology, University of Hartford, West Hartford, USA; 2State University of New York at Albany, Albany, USA. Email: nicklin@hartford.edu Received January 1st, 2011; revised February 24th, 2011; accepted April 2nd, 2011. We adopted a social cognitive approach of motivation (Bandura, 1986, 1989, 2003) to examine the influence of normative feedback and self-set goals on positive discrepancy creation and goal revision in the face of a novel task. The moderating effects of self-efficacy and regulatory focus were also examined. A laboratory study in- cluding 297 undergraduate students demonstrated that feedback, whether based on normative standards of per- formance or goal-performance discrepancies was a strong predictor of positive discrepancy creation and goal re- vision. Self-efficacy was also an independent predictor of goal revision, but regulatory focus was not. These findings have important practical implications for a variety of performance contexts (e.g., work, school, sports). Individuals will modify their goals based largely on feedback received (goal-performance discrepancies and normative standards); however, self-efficacy independently influences goal revision beyond the effects of feed- back. Other implications for research and practice are discussed. Keywords: Motivation, Performance, Self-Regulation, Goal-Performance Discrepancies, Feedback, Regulatory Focus, Self-Efficacy Goals are a common means of motivating people and are used as standards for evaluating performance (e.g., Locke & Latham, 1990, 2002). Goals that are specific and explicit pro- vide individuals with direction that help enhance and sustain motivation in achievement settings (e.g., Locke & Latham, 2002). Through self-regulation, individuals are able to guide goal-directed activities over time (Karoly, 1993). Bandura’s social cognitive theory (SCT: 1986, 1989, 2003) suggests a two-process model of self-regulation that identified discrepancy production and discrepancy reduction processes. Discrepancy production occurs when individuals set desirable, challenging goals at a level higher than previous levels of per- formance in an attempt to motivate themselves toward higher levels of performance. Discrepancy reduction processes occur when individuals seek to reduce undesirable goal-performance discrepancies (GPD) in order to receive a positive self-evaluation. Although there is some empirical support for social cognitive approaches to motivation (e.g., Donovan & Williams, 2003; Donovan & Hafsteinsson, 2006; Williams, Donovan, & Dodge, 2000), insufficient attention has been paid to how people use normative standards and self-set goals to regulate performance over time on novel tasks. Therefore, the goal of the present study is to examine how discrepancy feedback, which indicates how performance deviates from normative standards and self- set goals, influences discrepancy production and discrepancy reduction processes. The roles of regulatory focus and self- efficacy will also be examined, which have not been studied together in the context of dynamic self-regulation. Theoretical Rationale and Hypotheses A Social Cognitive Approach to Motivation Social cognitive theory (SCT: Bandura, 1986, 1989, 1991, 2003) suggests that individuals form cognitive representations of action to be performed (intentions), motivate themselves and guide their actions in the anticipation of future events (fore- thought), and evaluate their motivation, behavior, values, and meaning of life with purpose (self-reactiveness). Thus, SCT views humans as agents of their own behavior, anticipatorily moving through the world with intention and purpose. One way to motivate and regulate behavior is through the use of goals. Many contemporary theories of motivation view per- sonal goals as a primary regulator of behavior (e.g., Bandura, 2003; Donovan & Williams, 2002; Locke & Latham, 1990). Although SCT recognizes the value of goals for regulating performance, Bandura argues that the actual goals themselves do not motivate individuals. Rather, the positive self-evaluation and anticipated self-satisfaction gained from reaching goals provides incentive for action (Bandura, 1989; 1991). For exam- ple, a goal of a 3.5 grade point average (GPA) does not moti- vate a person; rather, the anticipated self-satisfaction derived from reaching the goal provides the incentive for action and enhanced effort. *This article is based on Jessica M. Nicklin’s doctoral dissertation, com- pleted under the supervision of Kevin J. Williams at the University at Al- any, State University of New York. A previous version of this article was presented at the 25th Annual Conference of the Society for Industrial and Organizational Psychology, Atlanta, Georgia, April 2010. #Correspondence concerning this article should be addressed to Jessica M. icklin, Department of Psychology, University of Hartford, West Ha tford, CT 06117. Email: nicklin@hartford.edu. In order to gauge progress towards goals, self-regulation re- lies on self-observation and evaluation, which provides the information and feedback needed for setting realistic goals and for evaluating one’s progress toward them (Bandura, 1991). When performance does not match goals, a negative discrep- ancy is observed, which creates self-dissatisfaction that serves 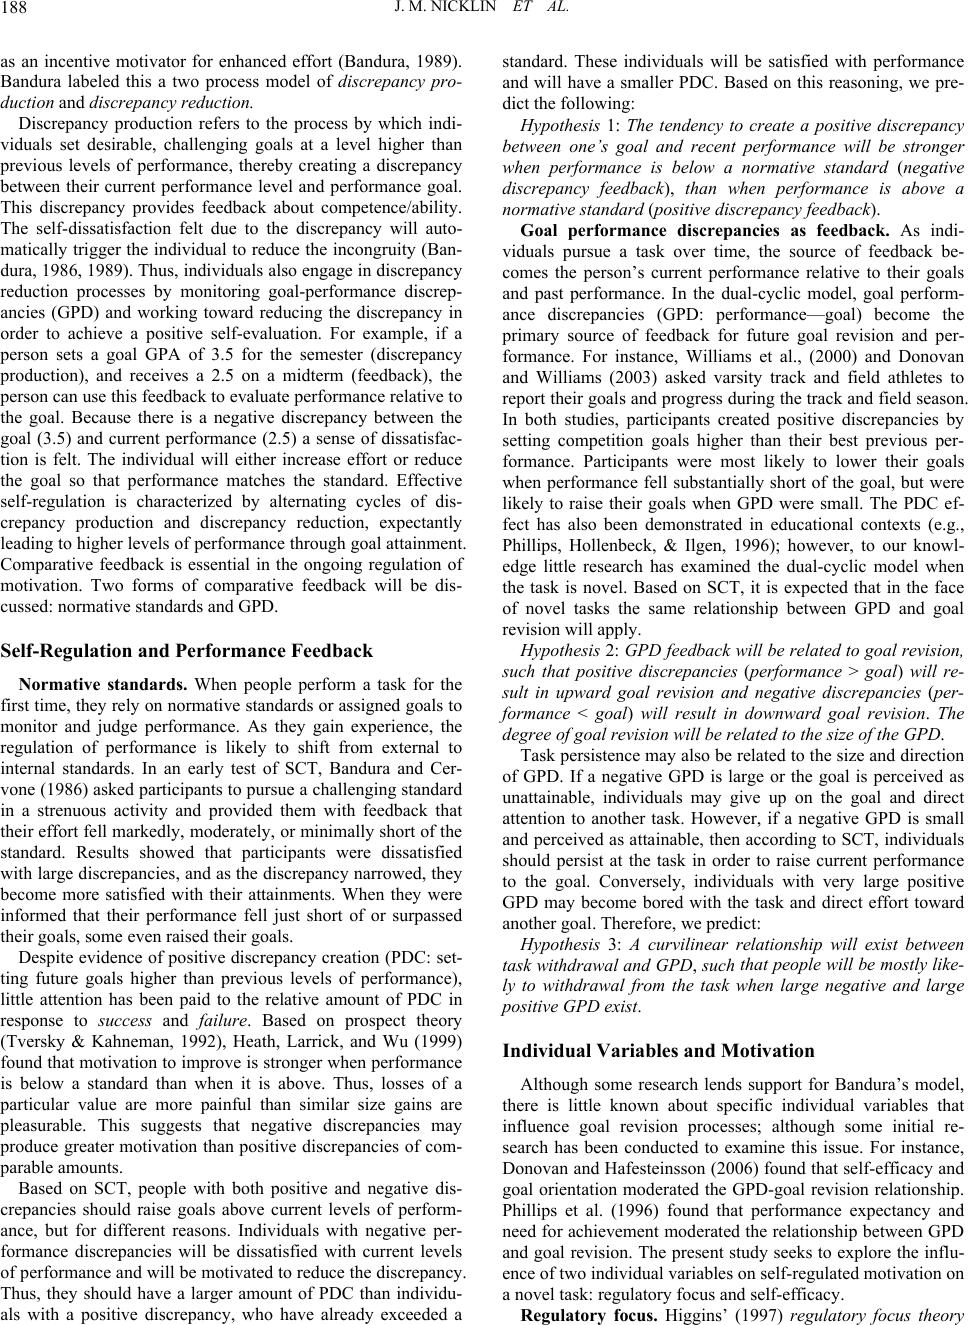 J. M. NICKLIN ET AL. 188 as an incentive motivator for enhanced effort (Bandura, 1989). Bandura labeled this a two process model of discrepancy pro- duction and discrepancy reduction. Discrepancy production refers to the process by which indi- viduals set desirable, challenging goals at a level higher than previous levels of performance, thereby creating a discrepancy between their current performance level and performance goal. This discrepancy provides feedback about competence/ability. The self-dissatisfaction felt due to the discrepancy will auto- matically trigger the individual to reduce the incongruity (Ban- dura, 1986, 1989). Thus, individuals also engage in discrepancy reduction processes by monitoring goal-performance discrep- ancies (GPD) and working toward reducing the discrepancy in order to achieve a positive self-evaluation. For example, if a person sets a goal GPA of 3.5 for the semester (discrepancy production), and receives a 2.5 on a midterm (feedback), the person can use this feedback to evaluate performance relative to the goal. Because there is a negative discrepancy between the goal (3.5) and current performance (2.5) a sense of dissatisfac- tion is felt. The individual will either increase effort or reduce the goal so that performance matches the standard. Effective self-regulation is characterized by alternating cycles of dis- crepancy production and discrepancy reduction, expectantly leading to higher levels of performance through goal attainment. Comparative feedback is essential in the ongoing regulation of motivation. Two forms of comparative feedback will be dis- cussed: normative standards and GPD. Self-Regulation and Performance Feedback Normative standards. When people perform a task for the first time, they rely on normative standards or assigned goals to monitor and judge performance. As they gain experience, the regulation of performance is likely to shift from external to internal standards. In an early test of SCT, Bandura and Cer- vone (1986) asked participants to pursue a challenging standard in a strenuous activity and provided them with feedback that their effort fell markedly, moderately, or minimally short of the standard. Results showed that participants were dissatisfied with large discrepancies, and as the discrepancy narrowed, they become more satisfied with their attainments. When they were informed that their performance fell just short of or surpassed their goals, some even raised their goals. Despite evidence of positive discrepancy creation (PDC: set- ting future goals higher than previous levels of performance), little attention has been paid to the relative amount of PDC in response to success and failure. Based on prospect theory (Tversky & Kahneman, 1992), Heath, Larrick, and Wu (1999) found that motivation to improve is stronger when performance is below a standard than when it is above. Thus, losses of a particular value are more painful than similar size gains are pleasurable. This suggests that negative discrepancies may produce greater motivation than positive discrepancies of com- parable amounts. Based on SCT, people with both positive and negative dis- crepancies should raise goals above current levels of perform- ance, but for different reasons. Individuals with negative per- formance discrepancies will be dissatisfied with current levels of performance and will be motivated to reduce the discrepancy. Thus, they should have a larger amount of PDC than individu- als with a positive discrepancy, who have already exceeded a standard. These individuals will be satisfied with performance and will have a smaller PDC. Based on this reasoning, we pre- dict the following: Hypothesis 1: The tendency to create a positive discrepancy between one’s goal and recent performance will be stronger when performance is below a normative standard (negative discrepancy feedback), than when performance is above a normative standard (positive discrepancy feedback). Goal performance discrepancies as feedback. As indi- viduals pursue a task over time, the source of feedback be- comes the person’s current performance relative to their goals and past performance. In the dual-cyclic model, goal perform- ance discrepancies (GPD: performance—goal) become the primary source of feedback for future goal revision and per- formance. For instance, Williams et al., (2000) and Donovan and Williams (2003) asked varsity track and field athletes to report their goals and progress during the track and field season. In both studies, participants created positive discrepancies by setting competition goals higher than their best previous per- formance. Participants were most likely to lower their goals when performance fell substantially short of the goal, but were likely to raise their goals when GPD were small. The PDC ef- fect has also been demonstrated in educational contexts (e.g., Phillips, Hollenbeck, & Ilgen, 1996); however, to our knowl- edge little research has examined the dual-cyclic model when the task is novel. Based on SCT, it is expected that in the face of novel tasks the same relationship between GPD and goal revision will apply. Hypothesis 2: GPD feedback will be related to goal revision, such that positive discrepancies (performance > goal) will re- sult in upward goal revision and negative discrepancies (per- formance < goal) will result in downward goal revision. The degree of goal revision will be related to the size of the GPD. Task persistence may also be related to the size and direction of GPD. If a negative GPD is large or the goal is perceived as unattainable, individuals may give up on the goal and direct attention to another task. However, if a negative GPD is small and perceived as attainable, then according to SCT, individuals should persist at the task in order to raise current performance to the goal. Conversely, individuals with very large positive GPD may become bored with the task and direct effort toward another goal. Therefore, we predict: Hypothesis 3: A curvilinear relationship will exist between task withdrawal and GPD, such that people will be mostly like- ly to withdrawal from the task when large negative and large positive GPD exist. Individual Va ri a bl es and Motivati on Although some research lends support for Bandura’s model, there is little known about specific individual variables that influence goal revision processes; although some initial re- search has been conducted to examine this issue. For instance, Donovan and Hafesteinsson (2006) found that self-efficacy and goal orientation moderated the GPD-goal revision relationship. Phillips et al. (1996) found that performance expectancy and need for achievement moderated the relationship between GPD and goal revision. The present study seeks to explore the influ- ence of two individual variables on self-regulated motivation on a novel task: regulatory focus and self-efficacy. Regulatory focus. Higgins’ (1997) regulatory focus theory 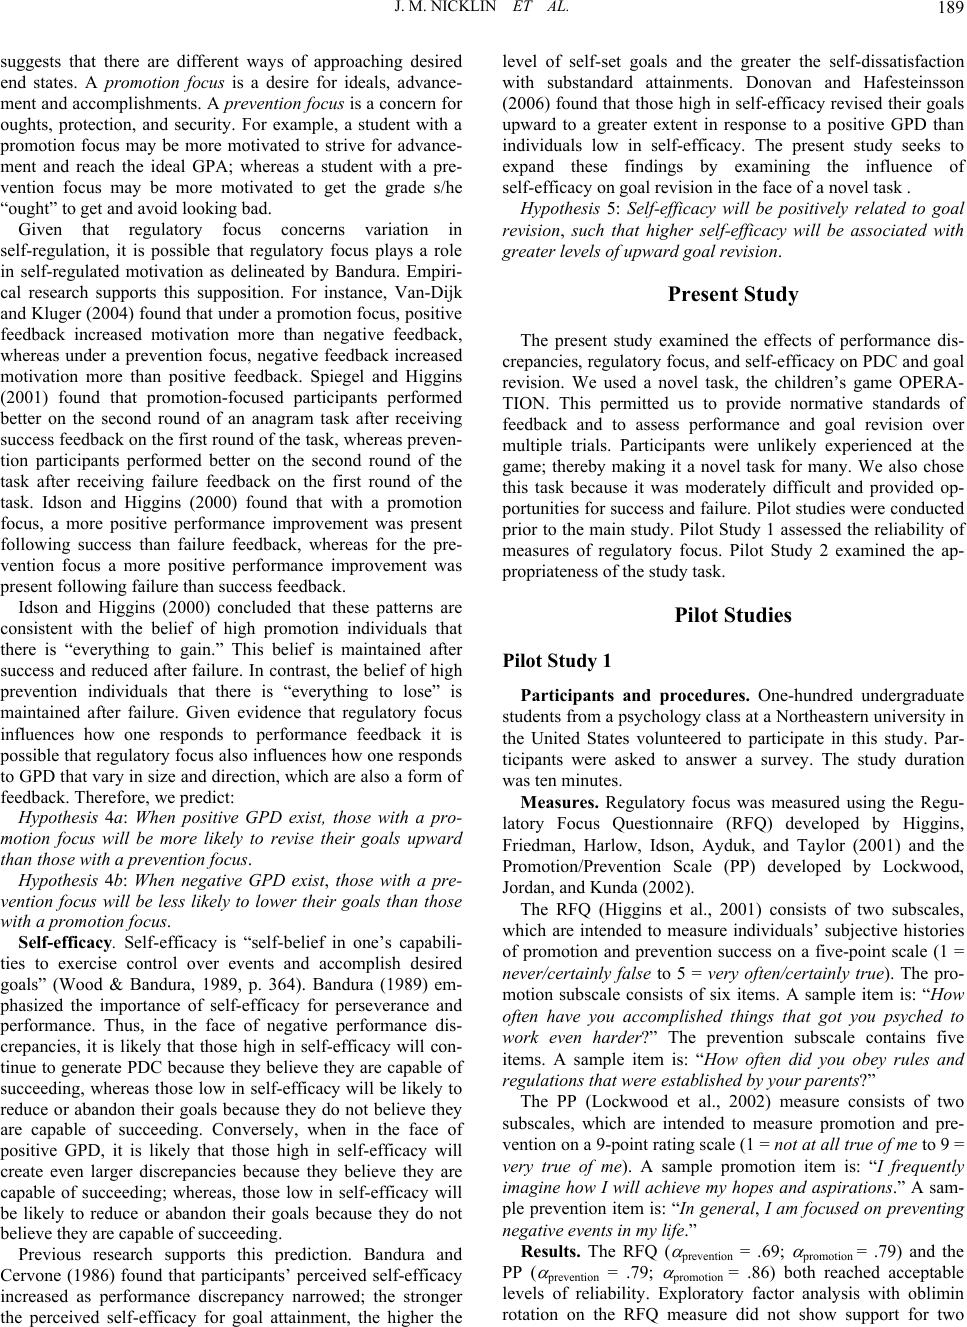 J. M. NICKLIN ET AL. 189 suggests that there are different ways of approaching desired end states. A promotion focus is a desire for ideals, advance- ment and accomplishments. A prevention focus is a concern for oughts, protection, and security. For example, a student with a promotion focus may be more motivated to strive for advance- ment and reach the ideal GPA; whereas a student with a pre- vention focus may be more motivated to get the grade s/he “ought” to get and avoid looking bad. Given that regulatory focus concerns variation in self-regulation, it is possible that regulatory focus plays a role in self-regulated motivation as delineated by Bandura. Empiri- cal research supports this supposition. For instance, Van-Dijk and Kluger (2004) found that under a promotion focus, positive feedback increased motivation more than negative feedback, whereas under a prevention focus, negative feedback increased motivation more than positive feedback. Spiegel and Higgins (2001) found that promotion-focused participants performed better on the second round of an anagram task after receiving success feedback on the first round of the task, whereas preven- tion participants performed better on the second round of the task after receiving failure feedback on the first round of the task. Idson and Higgins (2000) found that with a promotion focus, a more positive performance improvement was present following success than failure feedback, whereas for the pre- vention focus a more positive performance improvement was present following failure than success feedback. Idson and Higgins (2000) concluded that these patterns are consistent with the belief of high promotion individuals that there is “everything to gain.” This belief is maintained after success and reduced after failure. In contrast, the belief of high prevention individuals that there is “everything to lose” is maintained after failure. Given evidence that regulatory focus influences how one responds to performance feedback it is possible that regulatory focus also influences how one responds to GPD that vary in size and direction, which are also a form of feedback. Therefore, we predict: Hypothesis 4a: When positive GPD exist, those with a pro- motion focus will be more likely to revise their goals upward than those with a prevention focus. Hypothesis 4b: When negative GPD exist, those with a pre- vention focus will be less likely to lower their goals than those with a promotion focus. Self-efficacy. Self-efficacy is “self-belief in one’s capabili- ties to exercise control over events and accomplish desired goals” (Wood & Bandura, 1989, p. 364). Bandura (1989) em- phasized the importance of self-efficacy for perseverance and performance. Thus, in the face of negative performance dis- crepancies, it is likely that those high in self-efficacy will con- tinue to generate PDC because they believe they are capable of succeeding, whereas those low in self-efficacy will be likely to reduce or abandon their goals because they do not believe they are capable of succeeding. Conversely, when in the face of positive GPD, it is likely that those high in self-efficacy will create even larger discrepancies because they believe they are capable of succeeding; whereas, those low in self-efficacy will be likely to reduce or abandon their goals because they do not believe they are capable of succeeding. Previous research supports this prediction. Bandura and Cervone (1986) found that participants’ perceived self-efficacy increased as performance discrepancy narrowed; the stronger the perceived self-efficacy for goal attainment, the higher the level of self-set goals and the greater the self-dissatisfaction with substandard attainments. Donovan and Hafesteinsson (2006) found that those high in self-efficacy revised their goals upward to a greater extent in response to a positive GPD than individuals low in self-efficacy. The present study seeks to expand these findings by examining the influence of self-efficacy on goal revision in the face of a novel task . Hypothesis 5: Self-efficacy will be positively related to goal revision, such that higher self-efficacy will be associated with greater levels of upward goal revision. Present Study The present study examined the effects of performance dis- crepancies, regulatory focus, and self-efficacy on PDC and goal revision. We used a novel task, the children’s game OPERA- TION. This permitted us to provide normative standards of feedback and to assess performance and goal revision over multiple trials. Participants were unlikely experienced at the game; thereby making it a novel task for many. We also chose this task because it was moderately difficult and provided op- portunities for success and failure. Pilot studies were conducted prior to the main study. Pilot Study 1 assessed the reliability of measures of regulatory focus. Pilot Study 2 examined the ap- propriateness of the study task. Pilot Studies Pilot Study 1 Participants and procedures. One-hundred undergraduate students from a psychology class at a Northeastern university in the United States volunteered to participate in this study. Par- ticipants were asked to answer a survey. The study duration was ten minutes. Measures. Regulatory focus was measured using the Regu- latory Focus Questionnaire (RFQ) developed by Higgins, Friedman, Harlow, Idson, Ayduk, and Taylor (2001) and the Promotion/Prevention Scale (PP) developed by Lockwood, Jordan, and Kunda (2002). The RFQ (Higgins et al., 2001) consists of two subscales, which are intended to measure individuals’ subjective histories of promotion and prevention success on a five-point scale (1 = never/certainly false to 5 = very often/certainly true). The pro- motion subscale consists of six items. A sample item is: “How often have you accomplished things that got you psyched to work even harder?” The prevention subscale contains five items. A sample item is: “How often did you obey rules and regulations that were established by your parents?” The PP (Lockwood et al., 2002) measure consists of two subscales, which are intended to measure promotion and pre- vention on a 9-point rating scale (1 = not at all true of me to 9 = very true of me). A sample promotion item is: “I frequently imagine how I will achieve my hopes and aspirations.” A sam- ple prevention item is: “In general, I am focused on preventing negative events in my life.” Results. The RFQ ( prevention = .69; promotion = .79) and the PP ( prevention = .79; promotion = .86) both reached acceptable levels of reliability. Exploratory factor analysis with oblimin rotation on the RFQ measure did not show support for two  J. M. NICKLIN ET AL. 190 distinct factors. The scree plot showed four clear bends, and four eigenvalues that exceeded 1.00. When two factors were forced, the items loaded as expected. Similarly, the PP measure showed 4 - 5 bends in the scree plot and five eigenvalues that exceeded 1.00. When two factors were forced, most items loaded as expected; however, cross-loadings were present. The PPpromotion was positively correlated with the RFQpromotion (r = .41, p < .01), and negatively related to the PPprevention (r = −.41, p < .01) and RFQprevention, r = −.21, p < .05. However, the PPpre- vention and the RFQprevention were not correlated (r = .07, ns) indi- cating a lack of convergent validity for the prevention subscales. Pilot Study 2 Participants and procedures. The purpose of pilot study 2 was to re-examine the reliability of the regulatory focus meas- ures and to determine the suitability of the experimental task. Sixty undergraduate students (53.3% female) from a psychol- ogy research pool at a Northeastern university in the United States volunteered to participate in this study for research credit. Students that participated in Pilot Study 1 were not eligible to participate in Pilot Study 2. Participants first filled out the RFQ and PP to assess chronic regulatory focus. Then they played the game OPERATION. The game board is an illustration of a surgery patient, and the goal of the game is to remove as many pieces (body parts) from the game board as possible with metal tweezers without hitting the sides. If the sides of the game board are touched a buzzing sound occurs. Participants were asked to remove as many piec- es from the game board as possible in 60-seconds. For every successful piece removed, participants were awarded points based on difficulty of the piece. When a mistake was made (the tweezer hit the side of the board) participants would lose points from their score. Point values were determined by a perform- ance norming study involving a separate sample prior to this study. Upon completion of the performance trial, a negative per- formance discrepancy was created by informing participants that they missed the “average” score by 10, 30, 50, or 100 points. Participants were asked if they would like to play the game OPERATION again or put together a 50 piece puzzle. If they chose OPERATION they reported a goal. Measures. As in Pilot Study 1, regulatory focus was meas- ured using the RFQ and the PP. Negative normative feedback was provided to participants in order to create perceptions of substandard performance. As a manipulation check, participants were asked: “How would you rate your performance on this task” on an 11-point Likert format scale (1 = extremely far below average; 6 = average; 11 = extremely far above average). Goal performance discrepancy creation was assessed by asking participants to set a new goal for a second performance trial and then subtracting their initial performance score from the goal. Persistence was assessed by giving participants a choice be- tween OPERATION or a puzzle. Results. Responses to the manipulation check item demon- strated that the difference between the feedback conditions was significant, F (3, 56) = 6.86, p < .01, 2 = .27. The means on an 11-pt scale (with 6 being equal to average) were as follows: 10 points below average (M = 5.13, SD = .99), 30 points below average (M = 3.80, SD = 1.97), 50 points below average (M = 3.40, SD = 1.40), and 100 points below average, M = 2.67, SD = 1.59. Helmert contrasts demonstrated that only the small (10 points) condition was significantly (p < .01) different than the other groups. Univariate analysis of variance demonstrated that normative feedback was significantly related to discrepancy production, F (3, 23) = 6.77, p < .01, 2 = .47. Individuals in the 10 point condition set their performance goals 18.57 points above their initial performance, SD = 14.35. Those in the 30 and 50 point conditions set their performance goals 20.00 (SD = 10.49) and 38.33 (SD = 18.07) points above their initial performance, re- spectively. Participants in the 100 point condition raised their performance goals on average 61.56 (SD = 30.56) points above their initial performance. All Helmert contrasts were significant (p < .05). Task choice (puzzle or operation) was not related to any of the variables. The internal reliabilities of the RFQ subscales were promotion = .62 and prevention = .82. The PP subscales demonstrated internal reliabilities of promotion = .79 and preventi on = .75. RFQprevention was positively correlated with RFQpromotion (r = .29, p < .05) and PPpro- motion (r = .30, p < .05), which demonstrates a lack of discriminant validity. The PPpromotion and PPprevention were not correlated, r = –.01, ns. Furthermore, by examining the scree plot and eigenvalues greater than 1.00, exploratory factor analysis with oblimin rotation demonstrated five factors for the PP measure and three factors for the RFQ. When two factors were forced for each of the scales, the items loaded where expected, but cross loadings were present. There were no significant correlations between regulatory focus and performance or goal change. Summary of Pilot Studies Normative performance feedback influenced goal change. The main study expands these findings by examining goal revi- sion across repeated performance trials in the face of positive and negative performance discrepancies. Further, as demon- strated in both studies, the use of chronic regulatory focus measures lacked clear validity evidence, although the sample sizes were small. Therefore, regulatory focus will be manipu- lated as a state variable in the main study opposed to a trait variable in the pilot studies. Method Participants Participants were 297 undergraduate students (50.7% male) from a large public university in the northeast United States. Recruitment was conducted through the university’s research pool. Students earned credits toward the research requirement. The majority of the sample was Caucasian, 66.7%. The re- mainder of the sample was diverse: 9.1% African American, 7.7% Hispanic/Latino, 12.5% Asian, and 3.7% other. The mean age was 18.71 (SD = 1.39; range 17 - 27) and a majority of the sample were Freshmen, 62%. Those that participated in the pilot studies were not eligible to participate in this study. Procedures Study task. Participants were asked to play the game OP- ERATION. Sixty-seven percent of the sample reported that they had played the game as a child, but only 9.1% reported 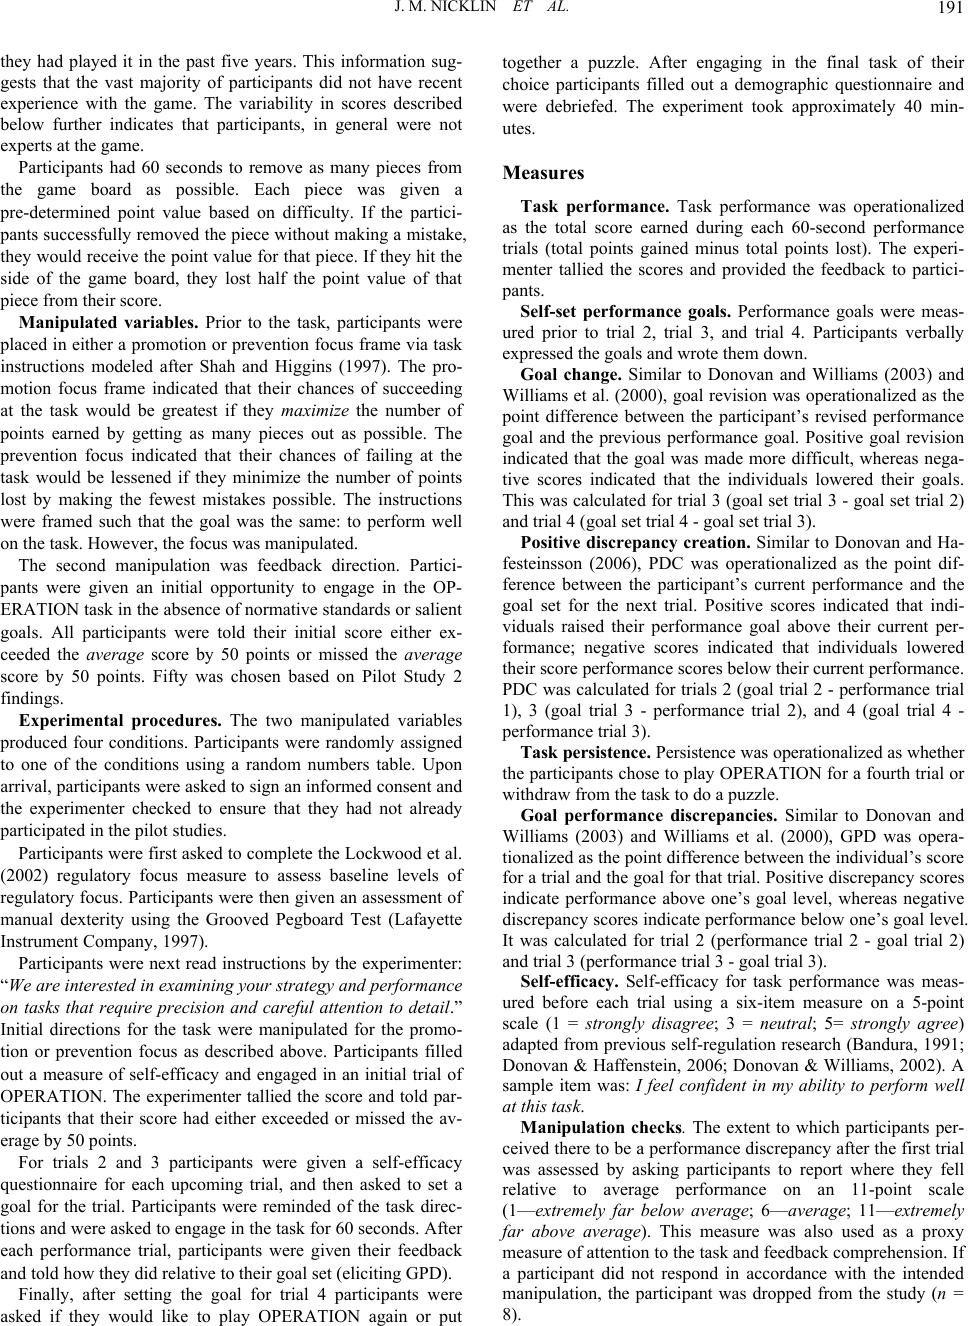 J. M. NICKLIN ET AL. 191 they had played it in the past five years. This information sug- gests that the vast majority of participants did not have recent experience with the game. The variability in scores described below further indicates that participants, in general were not experts at the game. Participants had 60 seconds to remove as many pieces from the game board as possible. Each piece was given a pre-determined point value based on difficulty. If the partici- pants successfully removed the piece without making a mistake, they would receive the point value for that piece. If they hit the side of the game board, they lost half the point value of that piece from their score. Manipulated variables. Prior to the task, participants were placed in either a promotion or prevention focus frame via task instructions modeled after Shah and Higgins (1997). The pro- motion focus frame indicated that their chances of succeeding at the task would be greatest if they maximize the number of points earned by getting as many pieces out as possible. The prevention focus indicated that their chances of failing at the task would be lessened if they minimize the number of points lost by making the fewest mistakes possible. The instructions were framed such that the goal was the same: to perform well on the task. However, the focus was manipulated. The second manipulation was feedback direction. Partici- pants were given an initial opportunity to engage in the OP- ERATION task in the absence of normative standards or salient goals. All participants were told their initial score either ex- ceeded the average score by 50 points or missed the average score by 50 points. Fifty was chosen based on Pilot Study 2 findings. Experimental procedures. The two manipulated variables produced four conditions. Participants were randomly assigned to one of the conditions using a random numbers table. Upon arrival, participants were asked to sign an informed consent and the experimenter checked to ensure that they had not already participated in the pilot studies. Participants were first asked to complete the Lockwood et al. (2002) regulatory focus measure to assess baseline levels of regulatory focus. Participants were then given an assessment of manual dexterity using the Grooved Pegboard Test (Lafayette Instrument Company, 1997). Participants were next read instructions by the experimenter: “We are interested in examining your strategy and performance on tasks that require precision and careful attention to detail.” Initial directions for the task were manipulated for the promo- tion or prevention focus as described above. Participants filled out a measure of self-efficacy and engaged in an initial trial of OPERATION. The experimenter tallied the score and told par- ticipants that their score had either exceeded or missed the av- erage by 50 points. For trials 2 and 3 participants were given a self-efficacy questionnaire for each upcoming trial, and then asked to set a goal for the trial. Participants were reminded of the task direc- tions and were asked to engage in the task for 60 seconds. After each performance trial, participants were given their feedback and told how they did relative to their goal set (eliciting GPD). Finally, after setting the goal for trial 4 participants were asked if they would like to play OPERATION again or put together a puzzle. After engaging in the final task of their choice participants filled out a demographic questionnaire and were debriefed. The experiment took approximately 40 min- utes. Measures Task performance. Task performance was operationalized as the total score earned during each 60-second performance trials (total points gained minus total points lost). The experi- menter tallied the scores and provided the feedback to partici- pants. Self-set performance goals. Performance goals were meas- ured prior to trial 2, trial 3, and trial 4. Participants verbally expressed the goals and wrote them down. Goal change. Similar to Donovan and Williams (2003) and Williams et al. (2000), goal revision was operationalized as the point difference between the participant’s revised performance goal and the previous performance goal. Positive goal revision indicated that the goal was made more difficult, whereas nega- tive scores indicated that the individuals lowered their goals. This was calculated for trial 3 (goal set trial 3 - goal set trial 2) and trial 4 (goal set trial 4 - goal set trial 3). Positive discrepancy creation. Similar to Donovan and Ha- festeinsson (2006), PDC was operationalized as the point dif- ference between the participant’s current performance and the goal set for the next trial. Positive scores indicated that indi- viduals raised their performance goal above their current per- formance; negative scores indicated that individuals lowered their score performance scores below their current performance. PDC was calculated for trials 2 (goal trial 2 - performance trial 1), 3 (goal trial 3 - performance trial 2), and 4 (goal trial 4 - performance trial 3). Task persistence. Persistence was operationalized as whether the participants chose to play OPERATION for a fourth trial or withdraw from the task to do a puzzle. Goal performance discrepancies. Similar to Donovan and Williams (2003) and Williams et al. (2000), GPD was opera- tionalized as the point difference between the individual’s score for a trial and the goal for that trial. Positive discrepancy scores indicate performance above one’s goal level, whereas negative discrepancy scores indicate performance below one’s goal level. It was calculated for trial 2 (performance trial 2 - goal trial 2) and trial 3 (performance trial 3 - goal trial 3). Self-efficacy. Self-efficacy for task performance was meas- ured before each trial using a six-item measure on a 5-point scale (1 = strongly disagree; 3 = neutral; 5= strongly agree) adapted from previous self-regulation research (Bandura, 1991; Donovan & Haffenstein, 2006; Donovan & Williams, 2002). A sample item was: I feel confident in my ability to perform well at this task. Manipulation checks. The extent to which participants per- ceived there to be a performance discrepancy after the first trial was assessed by asking participants to report where they fell relative to average performance on an 11-point scale (1—extremely far below average; 6—average; 11—extremely far above average). This measure was also used as a proxy measure of attention to the task and feedback comprehension. If a participant did not respond in accordance with the intended manipulation, the participant was dropped from the study (n = 8). 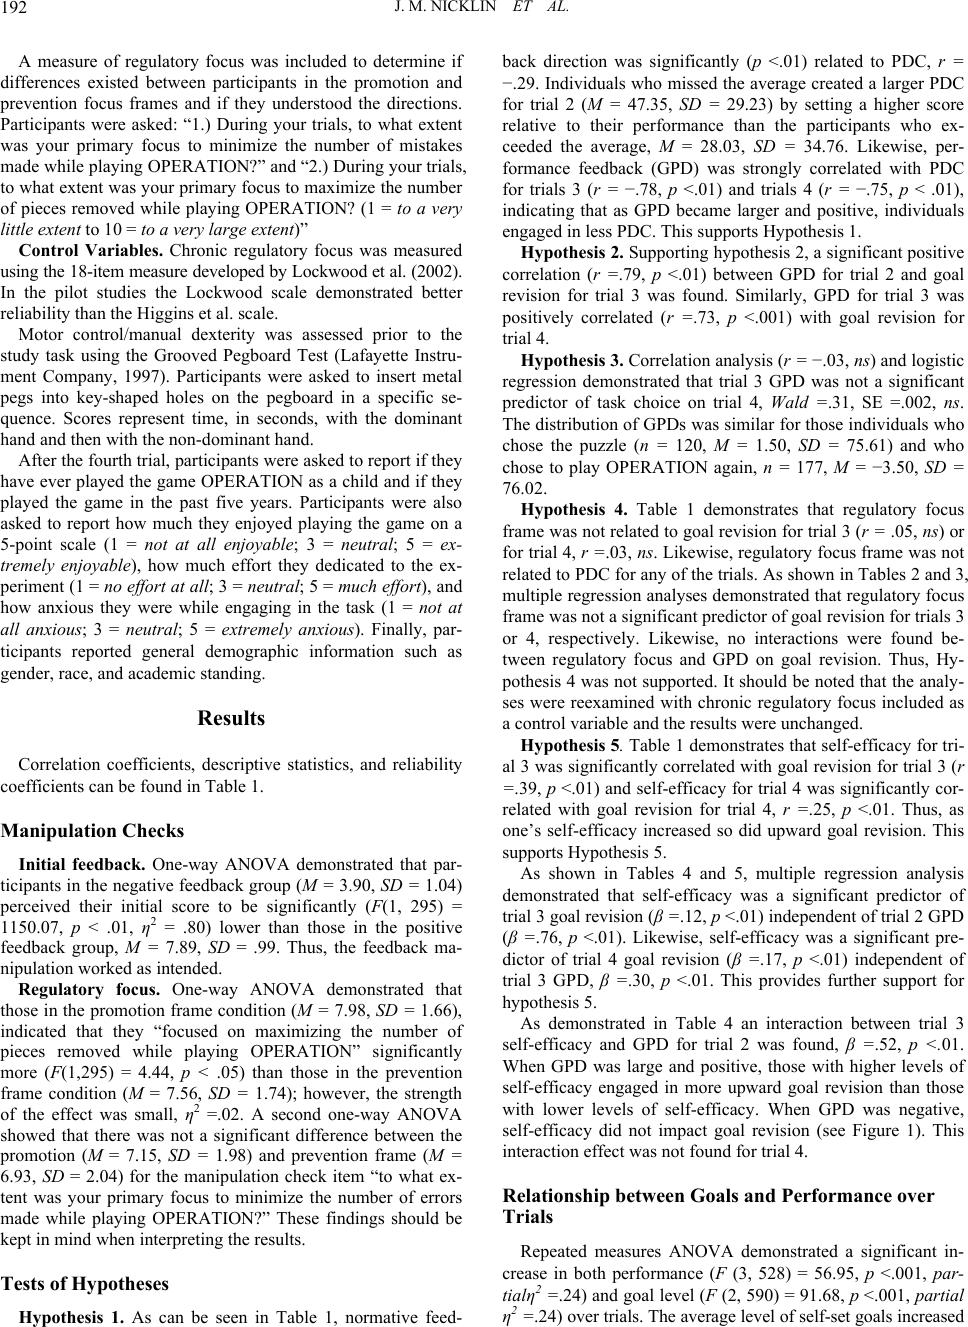 J. M. NICKLIN ET AL. 192 A measure of regulatory focus was included to determine if differences existed between participants in the promotion and prevention focus frames and if they understood the directions. Participants were asked: “1.) During your trials, to what extent was your primary focus to minimize the number of mistakes made while playing OPERATION?” and “2.) During your trials, to what extent was your primary focus to maximize the number of pieces removed while playing OPERATION? (1 = to a very little extent to 10 = to a very large extent)” Control Variables. Chronic regulatory focus was measured using the 18-item measure developed by Lockwood et al. (2002). In the pilot studies the Lockwood scale demonstrated better reliability than the Higgins et al. scale. Motor control/manual dexterity was assessed prior to the study task using the Grooved Pegboard Test (Lafayette Instru- ment Company, 1997). Participants were asked to insert metal pegs into key-shaped holes on the pegboard in a specific se- quence. Scores represent time, in seconds, with the dominant hand and then with the non-dominant hand. After the fourth trial, participants were asked to report if they have ever played the game OPERATION as a child and if they played the game in the past five years. Participants were also asked to report how much they enjoyed playing the game on a 5-point scale (1 = not at all enjoyable; 3 = neutral; 5 = ex- tremely enjoyable), how much effort they dedicated to the ex- periment (1 = no effort at all; 3 = neutral; 5 = much effort), and how anxious they were while engaging in the task (1 = not at all anxious; 3 = neutral; 5 = extremely anxious). Finally, par- ticipants reported general demographic information such as gender, race, and academic standing. Results Correlation coefficients, descriptive statistics, and reliability coefficients can be found in Table 1. Manipulation Checks Initial feedback. One-way ANOVA demonstrated that par- ticipants in the negative feedback group (M = 3.90, SD = 1.04) perceived their initial score to be significantly (F(1, 295) = 1150.07, p < .01, η2 = .80) lower than those in the positive feedback group, M = 7.89, SD = .99. Thus, the feedback ma- nipulation worked as intended. Regulatory focus. One-way ANOVA demonstrated that those in the promotion frame condition (M = 7.98, SD = 1.66), indicated that they “focused on maximizing the number of pieces removed while playing OPERATION” significantly more (F(1,295) = 4.44, p < .05) than those in the prevention frame condition (M = 7.56, SD = 1.74); however, the strength of the effect was small, η2 =.02. A second one-way ANOVA showed that there was not a significant difference between the promotion (M = 7.15, SD = 1.98) and prevention frame (M = 6.93, SD = 2.04) for the manipulation check item “to what ex- tent was your primary focus to minimize the number of errors made while playing OPERATION?” These findings should be kept in mind when interpreting the results. Tests of H ypotheses Hypothesis 1. As can be seen in Table 1, normative feed- back direction was significantly (p <.01) related to PDC, r = −.29. Individuals who missed the average created a larger PDC for trial 2 (M = 47.35, SD = 29.23) by setting a higher score relative to their performance than the participants who ex- ceeded the average, M = 28.03, SD = 34.76. Likewise, per- formance feedback (GPD) was strongly correlated with PDC for trials 3 (r = −.78, p <.01) and trials 4 (r = −.75, p < .01), indicating that as GPD became larger and positive, individuals engaged in less PDC. This supports Hypothesis 1. Hypothesis 2. Supporting hypothesis 2, a significant positive correlation (r =.79, p <.01) between GPD for trial 2 and goal revision for trial 3 was found. Similarly, GPD for trial 3 was positively correlated (r =.73, p <.001) with goal revision for trial 4. Hypothesis 3. Correlation analysis (r = −.03, ns) and logistic regression demonstrated that trial 3 GPD was not a significant predictor of task choice on trial 4, Wald =.31, SE =.002, ns. The distribution of GPDs was similar for those individuals who chose the puzzle (n = 120, M = 1.50, SD = 75.61) and who chose to play OPERATION again, n = 177, M = −3.50, SD = 76.02. Hypothesis 4. Table 1 demonstrates that regulatory focus frame was not related to goal revision for trial 3 (r = .05, ns) or for trial 4, r =.03, ns. Likewise, regulatory focus frame was not related to PDC for any of the trials. As shown in Tables 2 and 3, multiple regression analyses demonstrated that regulatory focus frame was not a significant predictor of goal revision for trials 3 or 4, respectively. Likewise, no interactions were found be- tween regulatory focus and GPD on goal revision. Thus, Hy- pothesis 4 was not supported. It should be noted that the analy- ses were reexamined with chronic regulatory focus included as a control variable and the results were unchanged. Hypothesis 5. Table 1 demonstrates that self-efficacy for tri- al 3 was significantly correlated with goal revision for trial 3 (r =.39, p <.01) and self-efficacy for trial 4 was significantly cor- related with goal revision for trial 4, r =.25, p <.01. Thus, as one’s self-efficacy increased so did upward goal revision. This supports Hypothesis 5. As shown in Tables 4 and 5, multiple regression analysis demonstrated that self-efficacy was a significant predictor of trial 3 goal revision (β =.12, p <.01) independent of trial 2 GPD (β =.76, p <.01). Likewise, self-efficacy was a significant pre- dictor of trial 4 goal revision (β =.17, p <.01) independent of trial 3 GPD, β =.30, p <.01. This provides further support for hypothesis 5. As demonstrated in Table 4 an interaction between trial 3 self-efficacy and GPD for trial 2 was found, β =.52, p <.01. When GPD was large and positive, those with higher levels of self-efficacy engaged in more upward goal revision than those with lower levels of self-efficacy. When GPD was negative, self-efficacy did not impact goal revision (see Figure 1). This interaction effect was not found for trial 4. Relationship between Goals and Performance over Trials Repeated measures ANOVA demonstrated a significant in- crease in both performance (F (3, 528) = 56.95, p <.001, par- tialη2 =.24) and goal level (F (2, 590) = 91.68, p <.001, partial η2 =.24) over trials. The average level of self-set goals increased 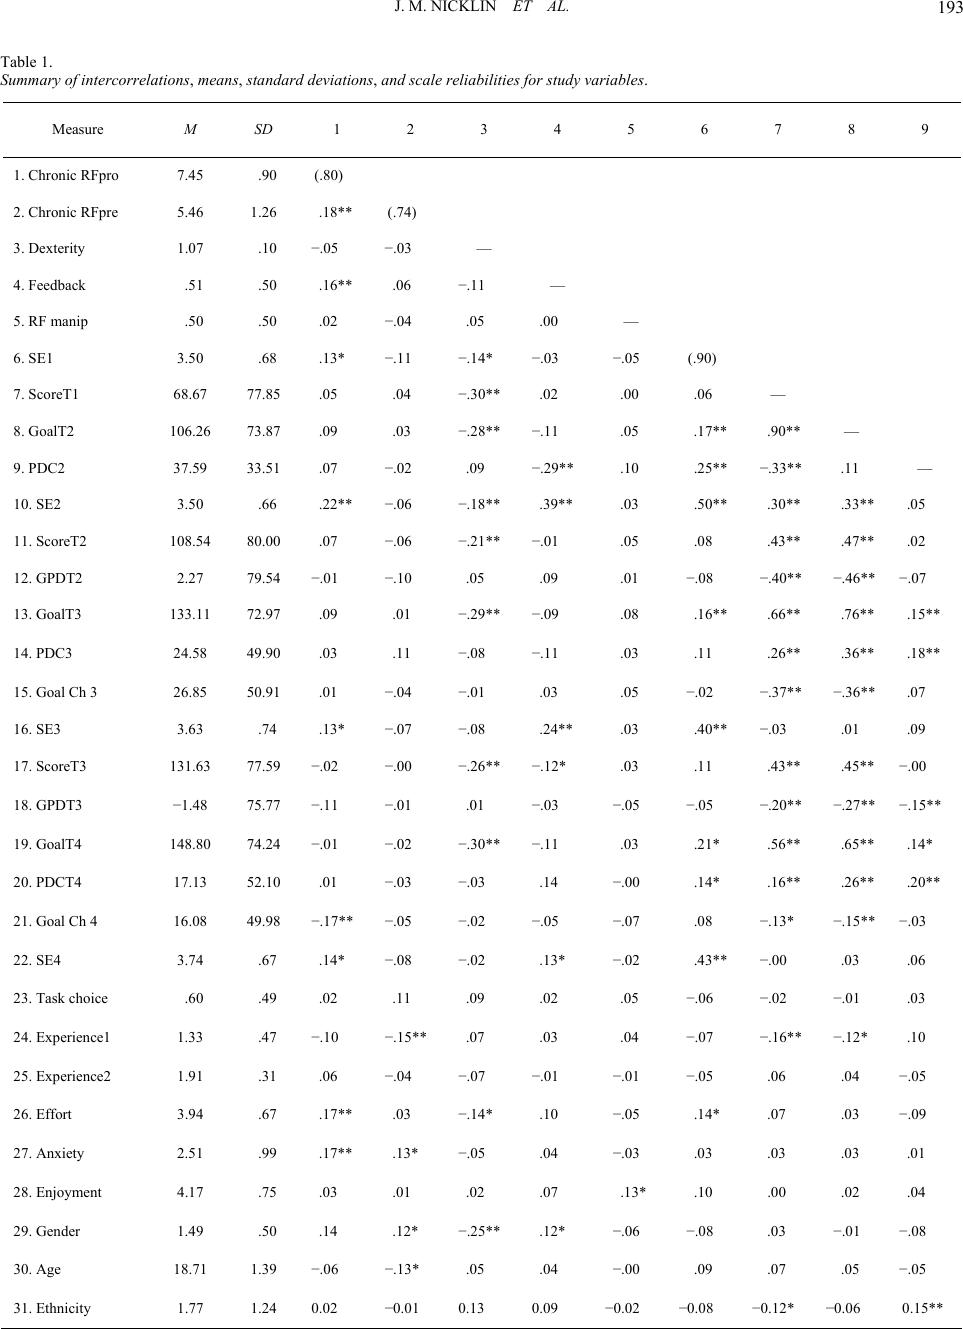 J. M. NICKLIN ET AL. 193 Table 1. Summary of intercorrelations, means, standard deviations, and scale reliabilities for study variables. Measure M SD 1 2 3 4 5 6 7 8 9 1. Chronic RFpro 7.45 .90 (.80) 2. Chronic RFpre 5.46 1.26 .18** (.74) 3. Dexterity 1.07 .10 −.05 −.03 — 4. Feedback .51 .50 .16** .06 −.11 — 5. RF manip .50 .50 .02 −.04 .05 .00 — 6. SE1 3.50 .68 .13* −.11 −.14* −.03 −.05 (.90) 7. ScoreT1 68.67 77.85 .05 .04 −.30** .02 .00 .06 — 8. GoalT2 106.26 73.87 .09 .03 −.28** −.11 .05 .17**.90** — 9. PDC2 37.59 33.51 .07 −.02 .09 −.29** .10 .25**−.33** .11 — 10. SE2 3.50 .66 .22** −.06 −.18** .39** .03 .50**.30** .33**.05 11. ScoreT2 108.54 80.00 .07 −.06 −.21** −.01 .05 .08 .43** .47**.02 12. GPDT2 2.27 79.54 −.01 −.10 .05 .09 .01 −.08 −.40** −.46** −.07 13. GoalT3 133.11 72.97 .09 .01 −.29** −.09 .08 .16**.66** .76**.15** 14. PDC3 24.58 49.90 .03 .11 −.08 −.11 .03 .11 .26** .36**.18** 15. Goal Ch 3 26.85 50.91 .01 −.04 −.01 .03 .05 −.02 −.37** −.36**.07 16. SE3 3.63 .74 .13* −.07 −.08 .24** .03 .40**−.03 .01 .09 17. ScoreT3 131.63 77.59 −.02 −.00 −.26** −.12* .03 .11 .43** .45**−.00 18. GPDT3 −1.48 75.77 −.11 −.01 .01 −.03 −.05 −.05 −.20** −.27** −.15** 19. GoalT4 148.80 74.24 −.01 −.02 −.30** −.11 .03 .21* .56** .65**.14* 20. PDCT4 17.13 52.10 .01 −.03 −.03 .14 −.00 .14* .16** .26**.20** 21. Goal Ch 4 16.08 49.98 −.17** −.05 −.02 −.05 −.07 .08 −.13* −.15** −.03 22. SE4 3.74 .67 .14* −.08 −.02 .13* −.02 .43**−.00 .03 .06 23. Task choice .60 .49 .02 .11 .09 .02 .05 −.06 −.02 −.01 .03 24. Experience1 1.33 .47 −.10 −.15** .07 .03 .04 −.07 −.16** −.12* .10 25. Experience2 1.91 .31 .06 −.04 −.07 −.01 −.01 −.05 .06 .04 −.05 26. Effort 3.94 .67 .17** .03 −.14* .10 −.05 .14* .07 .03 −.09 27. Anxiety 2.51 .99 .17** .13* −.05 .04 −.03 .03 .03 .03 .01 28. Enjoyment 4.17 .75 .03 .01 .02 .07 .13* .10 .00 .02 .04 29. Gender 1.49 .50 .14 .12* −.25** .12* −.06 −.08 .03 −.01 −.08 30. Age 18.71 1.39 −.06 −.13* .05 .04 −.00 .09 .07 .05 −.05 31. Ethnicity 1.77 1.24 0.02 −0.01 0.13 0.09 −0.02 −0.08 −0.12* −0.06 0.15**  J. M. NICKLIN ET AL. 194 Measure 10 11 12 13 14 15 16 17 18 19 20 1. Chronic RFpro 2. Chronic RFpre 3. Dexterity 4. Feedback 5. RF manip 6. SE1 7. ScoreT1 8. GoalT2 9. PDC2 10. SE2 (.90) 11. ScoreT2 .08 — 12. GPDT2 −.23** .57** — 13. GoalT3 .21** .79** .09 — 14. PDC3 .19** −.45** −.78** .19** — 15. Goal Ch 3 −.18** .46** .79** .33** −.25** — 16. SE3 .49** .37** .36** .28** −.17** .39** (.93) 17. ScoreT3 .02 .50** .08 .50** .07 .06 .02 — 18. GPDT3 −.18** −.25** −.00 −.46** −.26** −.26** −.25** .55** — 19. GoalT4 .22** .63** .03 .77** .11* .16** .20** .77** .05 — 20. PDCT4 .27** .15** −.08 .35** .27** .14* .25** −.40** −.75** .28** — 21. Goal Ch 4 −.00 −.22** −.08 −.31** −.11 −.23** −.12* .41** .73** .37** −.09 22. SE4 .45** .13* .11 .11 −.06 .11 .55** .28** .18** .27** −.03 23. Task choice −.09 −.01 −.01 −.00 .02 .01 −.01 −.03 −.03 −.01 .03 24. Experience1 −.09 −.09 .02 −.11 −.01 .03 −.09 −.09 .01 −.10 −.01 25. Experience2 .02 .03 −.00 .02 −.02 −.02 .01 −.02 −.05 −.02 .02 26. Effort .13* .07 .05 .08 .00 .08 .18** −.09 −.18** −.02 .12* 27. Anxiety .12* −.03 −.06 .05 .11 .02 .03 −.13* −.18* .01 .21** 28. Enjoyment .18** .08 .06 .04 −.07 .02 .15** .08 .04 .09 .02 29. Gender −.09 .04 .05 .00 −.06 .02 −.05 .02 .02 −.07 −.12* 30. Age .03 .07 .02 .02 −.09 −.06 .04 .01 −.01 −.02 −.03 31. Ethnicity −.02 −.06 −.01 −.05 .03 .01 −.06 −.09 −.04 −.07 .03 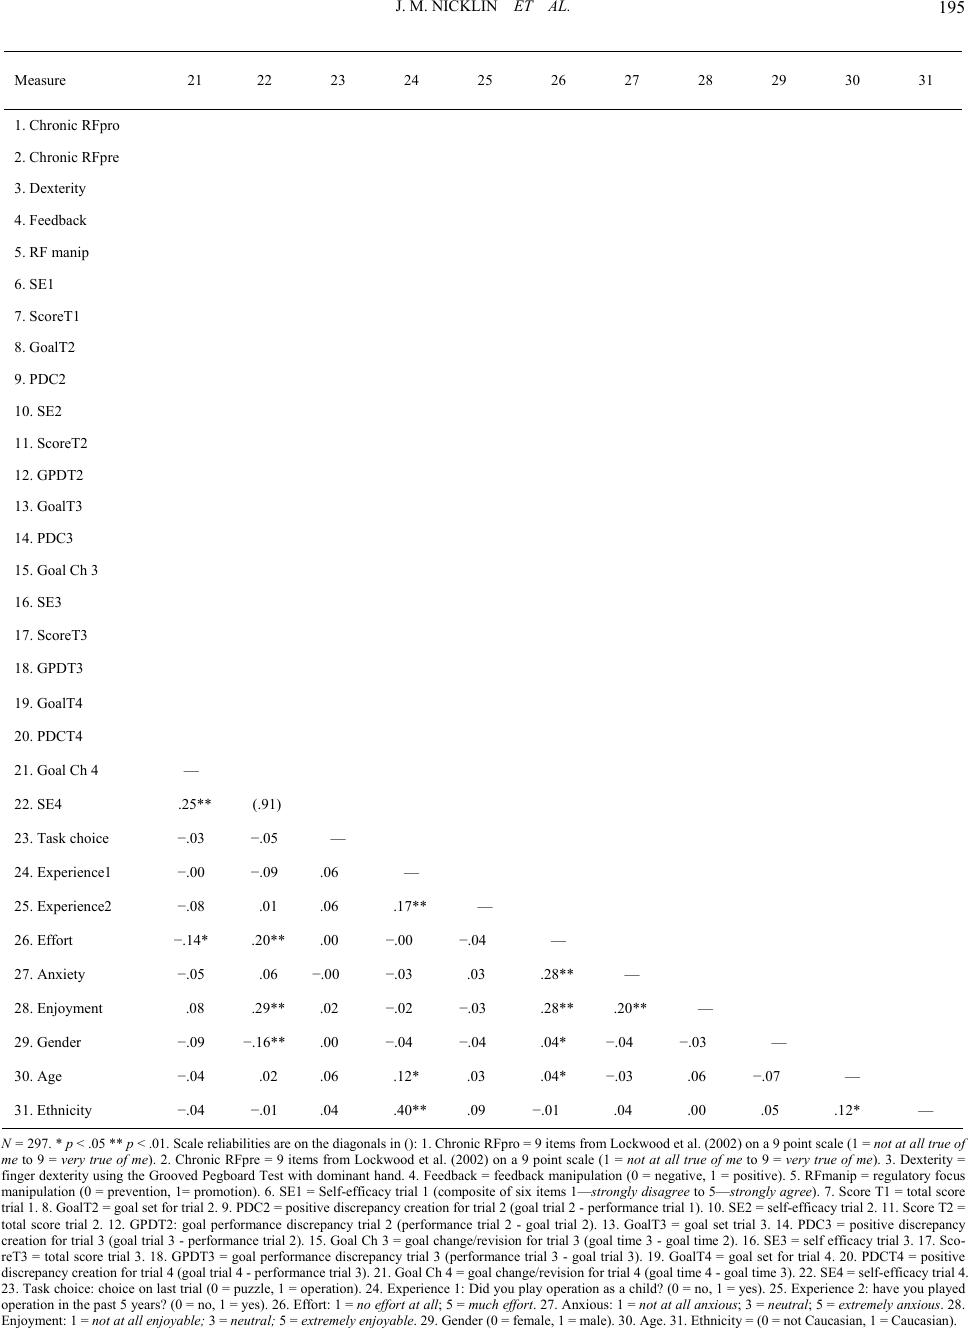 J. M. NICKLIN ET AL. 195 Measure 21 22 23 24 25 26 27 28 29 30 31 1. Chronic RFpro 2. Chronic RFpre 3. Dexterity 4. Feedback 5. RF manip 6. SE1 7. ScoreT1 8. GoalT2 9. PDC2 10. SE2 11. ScoreT2 12. GPDT2 13. GoalT3 14. PDC3 15. Goal Ch 3 16. SE3 17. ScoreT3 18. GPDT3 19. GoalT4 20. PDCT4 21. Goal Ch 4 — 22. SE4 .25** (.91) 23. Task choice −.03 −.05 — 24. Experience1 −.00 −.09 .06 — 25. Experience2 −.08 .01 .06 .17** — 26. Effort −.14* .20** .00 −.00 −.04 — 27. Anxiety −.05 .06 −.00 −.03 .03 .28** — 28. Enjoyment .08 .29** .02 −.02 −.03 .28** .20** — 29. Gender −.09 −.16** .00 −.04 −.04 .04* −.04 −.03 — 30. Age −.04 .02 .06 .12* .03 .04* −.03 .06 −.07 — 31. Ethnicity −.04 −.01 .04 .40** .09 −.01 .04 .00 .05 .12* — N = 297. * p < .05 ** p < .01. Scale reliabilities are on the diagonals in (): 1. Chronic RFpro = 9 items from Lockwood et al. (2002) on a 9 point scale (1 = not at all true of me to 9 = very true of me). 2. Chronic RFpre = 9 items from Lockwood et al. (2002) on a 9 point scale (1 = not at all true of me to 9 = very true of me). 3. Dexterity = finger dexterity using the Grooved Pegboard Test with dominant hand. 4. Feedback = feedback manipulation (0 = negative, 1 = positive). 5. RFmanip = regulatory focus manipulation (0 = prevention, 1= promotion). 6. SE1 = Self-efficacy trial 1 (composite of six items 1—strongly disagree to 5—strongly agree). 7. Score T1 = total score trial 1. 8. GoalT2 = goal set for trial 2. 9. PDC2 = positive discrepancy creation for trial 2 (goal trial 2 - performance trial 1). 10. SE2 = self-efficacy trial 2. 11. Score T2 = total score trial 2. 12. GPDT2: goal performance discrepancy trial 2 (performance trial 2 - goal trial 2). 13. GoalT3 = goal set trial 3. 14. PDC3 = positive discrepancy creation for trial 3 (goal trial 3 - performance trial 2). 15. Goal Ch 3 = goal change/revision for trial 3 (goal time 3 - goal time 2). 16. SE3 = self efficacy trial 3. 17. Sco- reT3 = total score trial 3. 18. GPDT3 = goal performance discrepancy trial 3 (performance trial 3 - goal trial 3). 19. GoalT4 = goal set for trial 4. 20. PDCT4 = positive discrepancy creation for trial 4 (goal trial 4 - performance trial 3). 21. Goal Ch 4 = goal change/revision for trial 4 (goal time 4 - goal time 3). 22. SE4 = self-efficacy trial 4. 23. Task choice: choice on last trial (0 = puzzle, 1 = operation). 24. Experience 1: Did you play operation as a child? (0 = no, 1 = yes). 25. Experience 2: have you played operation in the past 5 years? (0 = no, 1 = yes). 26. Effort: 1 = no effort at all; 5 = much effort. 27. Anxious: 1 = not at all anxious; 3 = neutral; 5 = extremely anxious. 28. Enjoyment: 1 = not at all enjoyable; 3 = neutral; 5 = extremely enjoyable. 29. Gender (0 = female, 1 = male). 30. Age. 31. Ethnicity = (0 = not Caucasian, 1 = Caucasian). 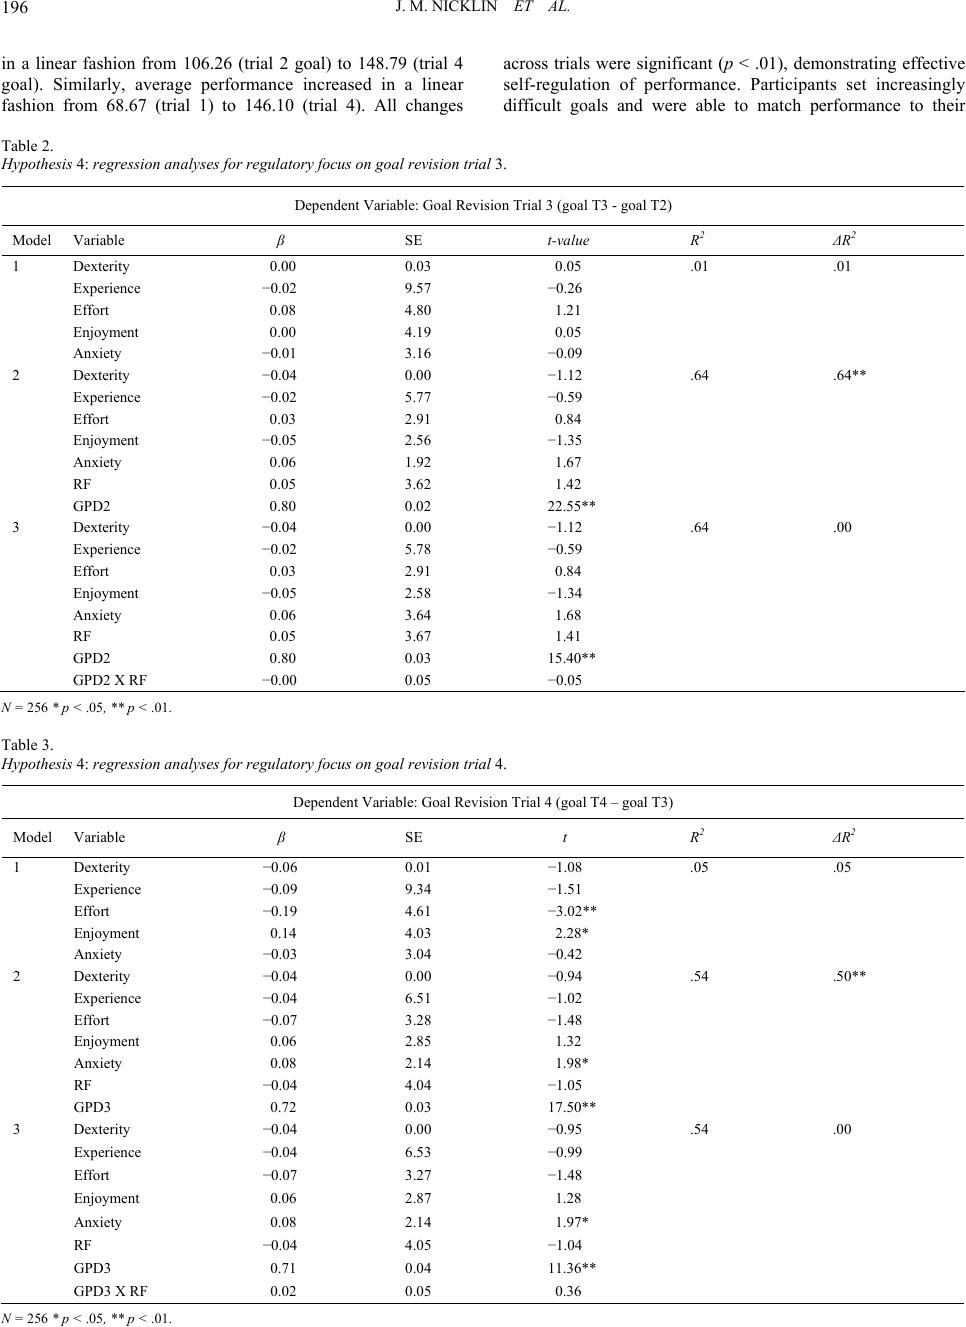 J. M. NICKLIN ET AL. 196 in a linear fashion from 106.26 (trial 2 goal) to 148.79 (trial 4 goal). Similarly, average performance increased in a linear fashion from 68.67 (trial 1) to 146.10 (trial 4). All changes across trials were significant (p < .01), demonstrating effective self-regulation of performance. Participants set increasingly difficult goals and were able to match performance to their Table 2. Hypothesis 4: regression analyses for regulatory focus on goal revision trial 3. Dependent Variable: Goal Revision Trial 3 (goal T3 - goal T2) Model Variable β SE t-value R2 ΔR2 1 Dexterity 0.00 0.03 0.05 .01 .01 Experience −0.02 9.57 −0.26 Effort 0.08 4.80 1.21 Enjoyment 0.00 4.19 0.05 Anxiety −0.01 3.16 −0.09 2 Dexterity −0.04 0.00 −1.12 .64 .64** Experience −0.02 5.77 −0.59 Effort 0.03 2.91 0.84 Enjoyment −0.05 2.56 −1.35 Anxiety 0.06 1.92 1.67 RF 0.05 3.62 1.42 GPD2 0.80 0.02 22.55** 3 Dexterity −0.04 0.00 −1.12 .64 .00 Experience −0.02 5.78 −0.59 Effort 0.03 2.91 0.84 Enjoyment −0.05 2.58 −1.34 Anxiety 0.06 3.64 1.68 RF 0.05 3.67 1.41 GPD2 0.80 0.03 15.40** GPD2 X RF −0.00 0.05 −0.05 N = 256 * p < .05, ** p < .01. Table 3. Hypothesis 4: regression analyses for regulatory focus on goal revision trial 4. Dependent Variable: Goal Revision Trial 4 (goal T4 – goal T3) Model Variable β SE t R2 ΔR2 1 Dexterity −0.06 0.01 −1.08 .05 .05 Experience −0.09 9.34 −1.51 Effort −0.19 4.61 −3.02** Enjoyment 0.14 4.03 2.28* Anxiety −0.03 3.04 −0.42 2 Dexterity −0.04 0.00 −0.94 .54 .50** Experience −0.04 6.51 −1.02 Effort −0.07 3.28 −1.48 Enjoyment 0.06 2.85 1.32 Anxiety 0.08 2.14 1.98* RF −0.04 4.04 −1.05 GPD3 0.72 0.03 17.50** 3 Dexterity −0.04 0.00 −0.95 .54 .00 Experience −0.04 6.53 −0.99 Effort −0.07 3.27 −1.48 Enjoyment 0.06 2.87 1.28 Anxiety 0.08 2.14 1.97* RF −0.04 4.05 −1.04 GPD3 0.71 0.04 11.36** GPD3 X RF 0.02 0.05 0.36 N = 256 * p < .05, ** p < .01. 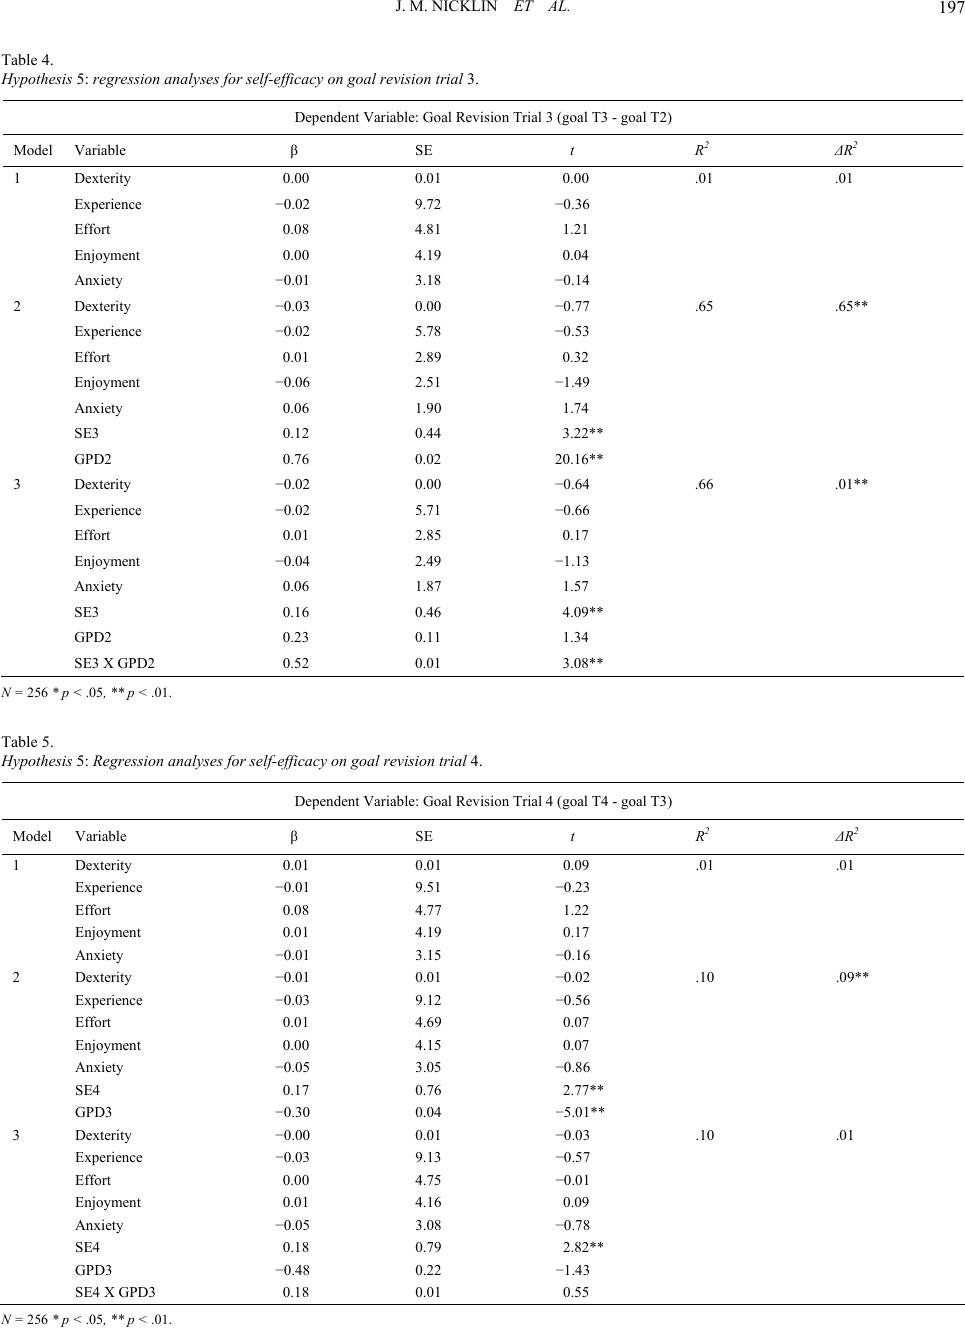 J. M. NICKLIN ET AL. 197 Table 4. Hypothesis 5: regression analyses for self-efficacy on goal revision trial 3. Dependent Variable: Goal Revision Trial 3 (goal T3 - goal T2) Model Variable β SE t R2 ΔR2 1 Dexterity 0.00 0.01 0.00 .01 .01 Experience −0.02 9.72 −0.36 Effort 0.08 4.81 1.21 Enjoyment 0.00 4.19 0.04 Anxiety −0.01 3.18 −0.14 2 Dexterity −0.03 0.00 −0.77 .65 .65** Experience −0.02 5.78 −0.53 Effort 0.01 2.89 0.32 Enjoyment −0.06 2.51 −1.49 Anxiety 0.06 1.90 1.74 SE3 0.12 0.44 3.22** GPD2 0.76 0.02 20.16** 3 Dexterity −0.02 0.00 −0.64 .66 .01** Experience −0.02 5.71 −0.66 Effort 0.01 2.85 0.17 Enjoyment −0.04 2.49 −1.13 Anxiety 0.06 1.87 1.57 SE3 0.16 0.46 4.09** GPD2 0.23 0.11 1.34 SE3 X GPD2 0.52 0.01 3.08** N = 256 * p < .05, ** p < .01. Table 5. Hypothesis 5: Regression analyses for self-efficacy on goal revision trial 4. Dependent Variable: Goal Revision Trial 4 (goal T4 - goal T3) Model Variable β SE t R2 ΔR2 1 Dexterity 0.01 0.01 0.09 .01 .01 Experience −0.01 9.51 −0.23 Effort 0.08 4.77 1.22 Enjoyment 0.01 4.19 0.17 Anxiety −0.01 3.15 −0.16 2 Dexterity −0.01 0.01 −0.02 .10 .09** Experience −0.03 9.12 −0.56 Effort 0.01 4.69 0.07 Enjoyment 0.00 4.15 0.07 Anxiety −0.05 3.05 −0.86 SE4 0.17 0.76 2.77** GPD3 −0.30 0.04 −5.01** 3 Dexterity −0.00 0.01 −0.03 .10 .01 Experience −0.03 9.13 −0.57 Effort 0.00 4.75 −0.01 Enjoyment 0.01 4.16 0.09 Anxiety −0.05 3.08 −0.78 SE4 0.18 0.79 2.82** GPD3 −0.48 0.22 −1.43 SE4 X GPD3 0.18 0.01 0.55 N = 256 * p < .05, ** p < .01. 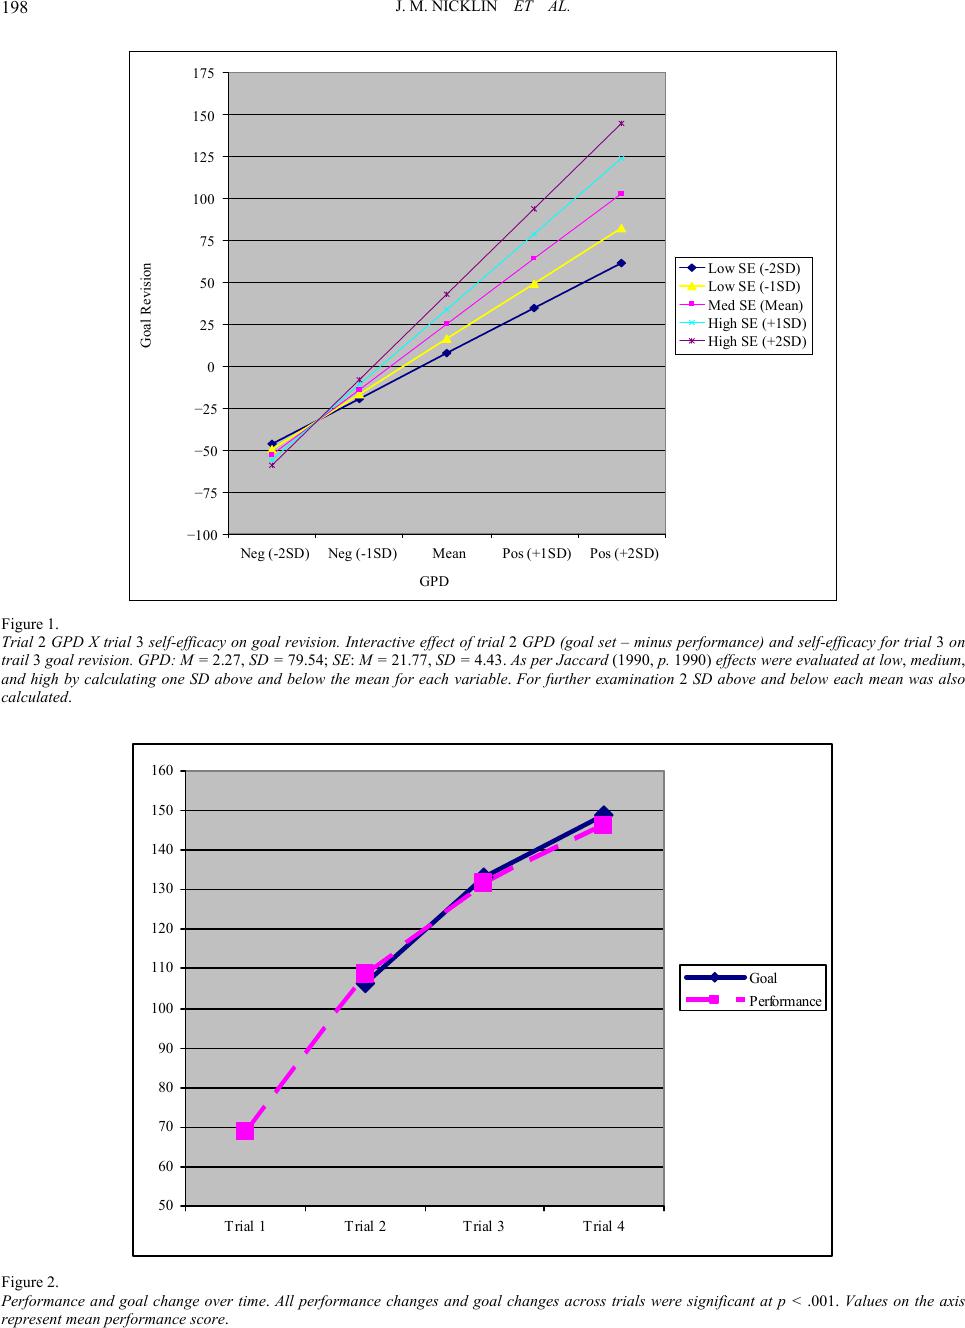 J. M. NICKLIN ET AL. 198 −100 −75 −50 −25 0 25 50 75 100 125 150 175 eg (-2SD) eg (-1SD)MeanPos (+1SD)Pos (+2SD) GP D Goal Revisio Low SE (-2SD) Low SE (-1SD) Med SE (Mean) High SE (+1SD) High SE (+2SD) Figure 1. Trial 2 GPD X trial 3 self-efficacy on goal revision. Interactive effect of trial 2 GPD (goal set – minus performance) and self-efficacy for trial 3 on trail 3 goal revision. GPD: M = 2.27, SD = 79.54; SE: M = 21.77, SD = 4.43. As per Jaccard (1990, p. 1990) effects were evaluated at low, medium, and high by calculating one SD above and below the mean for each variable. For further examination 2 SD above and below each mean was also calculated. 50 60 70 80 90 100 110 120 130 140 150 160 Trial 1Trial 2Trial 3Trial 4 Goal P erformance Figure 2. Performance and goal change over time. All performance changes and goal changes across trials were significant at p < .001. Values on the axis represent mean performance score. 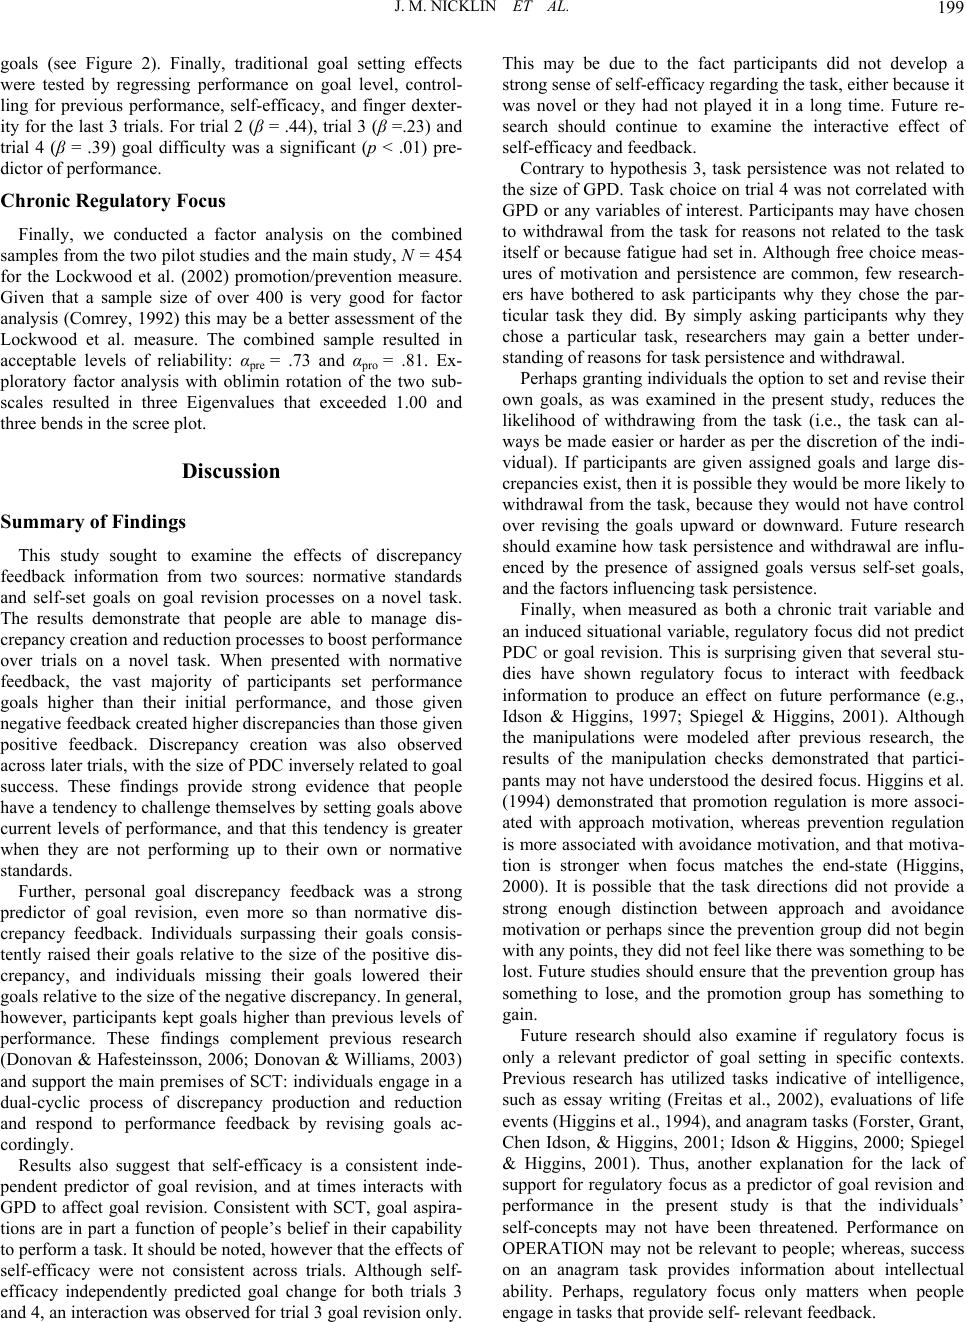 J. M. NICKLIN ET AL. 199 goals (see Figure 2). Finally, traditional goal setting effects were tested by regressing performance on goal level, control- ling for previous performance, self-efficacy, and finger dexter- ity for the last 3 trials. For trial 2 (β = .44), trial 3 (β =.23) and trial 4 (β = .39) goal difficulty was a significant (p < .01) pre- dictor of performance. Chronic Reg ulatory Foc u s Finally, we conducted a factor analysis on the combined samples from the two pilot studies and the main study, N = 454 for the Lockwood et al. (2002) promotion/prevention measure. Given that a sample size of over 400 is very good for factor analysis (Comrey, 1992) this may be a better assessment of the Lockwood et al. measure. The combined sample resulted in acceptable levels of reliability: αpre = .73 and αpro = .81. Ex- ploratory factor analysis with oblimin rotation of the two sub- scales resulted in three Eigenvalues that exceeded 1.00 and three bends in the scree plot. Discussion Summary of Findings This study sought to examine the effects of discrepancy feedback information from two sources: normative standards and self-set goals on goal revision processes on a novel task. The results demonstrate that people are able to manage dis- crepancy creation and reduction processes to boost performance over trials on a novel task. When presented with normative feedback, the vast majority of participants set performance goals higher than their initial performance, and those given negative feedback created higher discrepancies than those given positive feedback. Discrepancy creation was also observed across later trials, with the size of PDC inversely related to goal success. These findings provide strong evidence that people have a tendency to challenge themselves by setting goals above current levels of performance, and that this tendency is greater when they are not performing up to their own or normative standards. Further, personal goal discrepancy feedback was a strong predictor of goal revision, even more so than normative dis- crepancy feedback. Individuals surpassing their goals consis- tently raised their goals relative to the size of the positive dis- crepancy, and individuals missing their goals lowered their goals relative to the size of the negative discrepancy. In general, however, participants kept goals higher than previous levels of performance. These findings complement previous research (Donovan & Hafesteinsson, 2006; Donovan & Williams, 2003) and support the main premises of SCT: individuals engage in a dual-cyclic process of discrepancy production and reduction and respond to performance feedback by revising goals ac- cordingly. Results also suggest that self-efficacy is a consistent inde- pendent predictor of goal revision, and at times interacts with GPD to affect goal revision. Consistent with SCT, goal aspira- tions are in part a function of people’s belief in their capability to perform a task. It should be noted, however that the effects of self-efficacy were not consistent across trials. Although self- efficacy independently predicted goal change for both trials 3 and 4, an interaction was observed for trial 3 goal revision only. This may be due to the fact participants did not develop a strong sense of self-efficacy regarding the task, either because it was novel or they had not played it in a long time. Future re- search should continue to examine the interactive effect of self-efficacy and feedback. Contrary to hypothesis 3, task persistence was not related to the size of GPD. Task choice on trial 4 was not correlated with GPD or any variables of interest. Participants may have chosen to withdrawal from the task for reasons not related to the task itself or because fatigue had set in. Although free choice meas- ures of motivation and persistence are common, few research- ers have bothered to ask participants why they chose the par- ticular task they did. By simply asking participants why they chose a particular task, researchers may gain a better under- standing of reasons for task persistence and withdrawal. Perhaps granting individuals the option to set and revise their own goals, as was examined in the present study, reduces the likelihood of withdrawing from the task (i.e., the task can al- ways be made easier or harder as per the discretion of the indi- vidual). If participants are given assigned goals and large dis- crepancies exist, then it is possible they would be more likely to withdrawal from the task, because they would not have control over revising the goals upward or downward. Future research should examine how task persistence and withdrawal are influ- enced by the presence of assigned goals versus self-set goals, and the factors influencing task persistence. Finally, when measured as both a chronic trait variable and an induced situational variable, regulatory focus did not predict PDC or goal revision. This is surprising given that several stu- dies have shown regulatory focus to interact with feedback information to produce an effect on future performance (e.g., Idson & Higgins, 1997; Spiegel & Higgins, 2001). Although the manipulations were modeled after previous research, the results of the manipulation checks demonstrated that partici- pants may not have understood the desired focus. Higgins et al. (1994) demonstrated that promotion regulation is more associ- ated with approach motivation, whereas prevention regulation is more associated with avoidance motivation, and that motiva- tion is stronger when focus matches the end-state (Higgins, 2000). It is possible that the task directions did not provide a strong enough distinction between approach and avoidance motivation or perhaps since the prevention group did not begin with any points, they did not feel like there was something to be lost. Future studies should ensure that the prevention group has something to lose, and the promotion group has something to gain. Future research should also examine if regulatory focus is only a relevant predictor of goal setting in specific contexts. Previous research has utilized tasks indicative of intelligence, such as essay writing (Freitas et al., 2002), evaluations of life events (Higgins et al., 1994), and anagram tasks (Forster, Grant, Chen Idson, & Higgins, 2001; Idson & Higgins, 2000; Spiegel & Higgins, 2001). Thus, another explanation for the lack of support for regulatory focus as a predictor of goal revision and performance in the present study is that the individuals’ self-concepts may not have been threatened. Performance on OPERATION may not be relevant to people; whereas, success on an anagram task provides information about intellectual ability. Perhaps, regulatory focus only matters when people engage in tasks that provide self- relevant feedback. 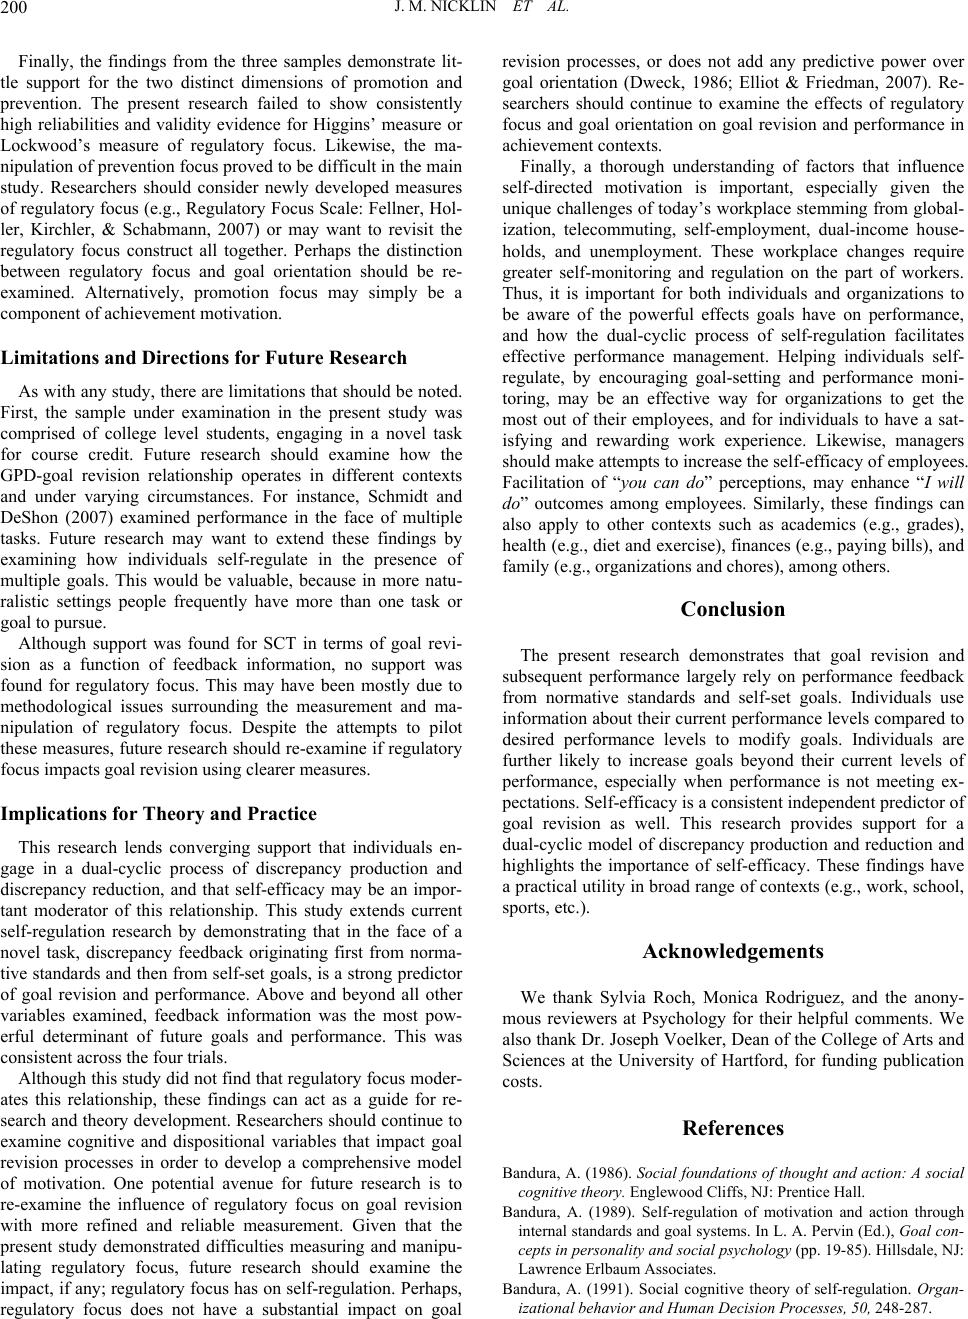 J. M. NICKLIN ET AL. 200 Finally, the findings from the three samples demonstrate lit- tle support for the two distinct dimensions of promotion and prevention. The present research failed to show consistently high reliabilities and validity evidence for Higgins’ measure or Lockwood’s measure of regulatory focus. Likewise, the ma- nipulation of prevention focus proved to be difficult in the main study. Researchers should consider newly developed measures of regulatory focus (e.g., Regulatory Focus Scale: Fellner, Hol- ler, Kirchler, & Schabmann, 2007) or may want to revisit the regulatory focus construct all together. Perhaps the distinction between regulatory focus and goal orientation should be re- examined. Alternatively, promotion focus may simply be a component of achievement motivation. Limitations and Directions for Future Research As with any study, there are limitations that should be noted. First, the sample under examination in the present study was comprised of college level students, engaging in a novel task for course credit. Future research should examine how the GPD-goal revision relationship operates in different contexts and under varying circumstances. For instance, Schmidt and DeShon (2007) examined performance in the face of multiple tasks. Future research may want to extend these findings by examining how individuals self-regulate in the presence of multiple goals. This would be valuable, because in more natu- ralistic settings people frequently have more than one task or goal to pursue. Although support was found for SCT in terms of goal revi- sion as a function of feedback information, no support was found for regulatory focus. This may have been mostly due to methodological issues surrounding the measurement and ma- nipulation of regulatory focus. Despite the attempts to pilot these measures, future research should re-examine if regulatory focus impacts goal revision using clearer measures. Implications for Theory and Prac tice This research lends converging support that individuals en- gage in a dual-cyclic process of discrepancy production and discrepancy reduction, and that self-efficacy may be an impor- tant moderator of this relationship. This study extends current self-regulation research by demonstrating that in the face of a novel task, discrepancy feedback originating first from norma- tive standards and then from self-set goals, is a strong predictor of goal revision and performance. Above and beyond all other variables examined, feedback information was the most pow- erful determinant of future goals and performance. This was consistent across the four trials. Although this study did not find that regulatory focus moder- ates this relationship, these findings can act as a guide for re- search and theory development. Researchers should continue to examine cognitive and dispositional variables that impact goal revision processes in order to develop a comprehensive model of motivation. One potential avenue for future research is to re-examine the influence of regulatory focus on goal revision with more refined and reliable measurement. Given that the present study demonstrated difficulties measuring and manipu- lating regulatory focus, future research should examine the impact, if any; regulatory focus has on self-regulation. Perhaps, regulatory focus does not have a substantial impact on goal revision processes, or does not add any predictive power over goal orientation (Dweck, 1986; Elliot & Friedman, 2007). Re- searchers should continue to examine the effects of regulatory focus and goal orientation on goal revision and performance in achievement contexts. Finally, a thorough understanding of factors that influence self-directed motivation is important, especially given the unique challenges of today’s workplace stemming from global- ization, telecommuting, self-employment, dual-income house- holds, and unemployment. These workplace changes require greater self-monitoring and regulation on the part of workers. Thus, it is important for both individuals and organizations to be aware of the powerful effects goals have on performance, and how the dual-cyclic process of self-regulation facilitates effective performance management. Helping individuals self- regulate, by encouraging goal-setting and performance moni- toring, may be an effective way for organizations to get the most out of their employees, and for individuals to have a sat- isfying and rewarding work experience. Likewise, managers should make attempts to increase the self-efficacy of employees. Facilitation of “you can do” perceptions, may enhance “I will do” outcomes among employees. Similarly, these findings can also apply to other contexts such as academics (e.g., grades), health (e.g., diet and exercise), finances (e.g., paying bills), and family (e.g., organizations and chores), among others. Conclusion The present research demonstrates that goal revision and subsequent performance largely rely on performance feedback from normative standards and self-set goals. Individuals use information about their current performance levels compared to desired performance levels to modify goals. Individuals are further likely to increase goals beyond their current levels of performance, especially when performance is not meeting ex- pectations. Self-efficacy is a consistent independent predictor of goal revision as well. This research provides support for a dual-cyclic model of discrepancy production and reduction and highlights the importance of self-efficacy. These findings have a practical utility in broad range of contexts (e.g., work, school, sports, etc.). Acknowledgements We thank Sylvia Roch, Monica Rodriguez, and the anony- mous reviewers at Psychology for their helpful comments. We also thank Dr. Joseph Voelker, Dean of the College of Arts and Sciences at the University of Hartford, for funding publication costs. References Bandura, A. (1986). Social foundations of thought and action: A social cognitive theory. Englewood Cliffs, NJ: Prentice Hall. Bandura, A. (1989). Self-regulation of motivation and action through internal standards and goal systems. In L. A. Pervin (Ed.), Goal con- cepts in personality and social psychology (pp. 19-85). Hillsdale, NJ: Lawrence Erlbaum Associates. Bandura, A. (1991). Social cognitive theory of self-regulation. Organ- izational behavior and Human Decision Processes, 50, 248-287.  J. M. NICKLIN ET AL. 201 doi:10.1016/0749-5978(91)90022-L Bandura, A. (2003). Social cognitive theory: An agentic perspective. Annual review of Psychology, 52, 1-26. doi:10.1146/annurev.psych.52.1.1 Bandura, A., & Cervone, D. (1986). Differential engagement of self-reactive influences in cognitive motivation. Organizational Be- havior and Human Decision Processes, 38, 92-113. doi:10.1016/0749-5978(86)90028-2 Bandura, A., & Locke, E. A. (2003). Negative self-efficacy and goal effects revisited. Journal of Applied Psychology, 88, 87-99. doi:10.1037/0021-9010.88.1.87 Comrey, A. L. (1992). A first course in factor analysis. (2nd ed.). Hillsdale, NJ: LEA, Publishers. Donovan, J. J., & Hafsteinsson, L. G. (2006). The impact of goal-performance discrepancies self-efficacy, and goal orientation on upward goal revision. Jounral of Applied Social Psychology, 36, 2006. doi:10.1111/j.0021-9029.2006.00054.x Donovan, J. J., & Williams, K. J. (2003). Missing the mark: Effects of time and causal attributions on goal revision in response to goal- performance discrepancies. Journal of Applied Psychology, 88, 379-390. doi:10.1037/0021-9010.88.3.379 Dweck, C. S. (1986). Motivational processes affecting learning. American Psychologist, 41, 1040-1048. Elliot, A. J., & Freidman, R. (2007). Approach-avoidance: A central characteristic of personal goals. In B. R. Little, K. Salmera-Aro and S. D. Phillips (Eds.), Personal Project Pursuit: Goals, Action, and Human Flourishing (pp. 97-118). Mahwah, NJ: Lawrence Erlbaum Associates. Fellner, B., Holler, M., Kirchler, E., & Scabmann, A. (2007). Regula- tory Focus Scale (RFS): Development of a scale to record dispotional regulatory focus. Swiss Journal of Psychology, 66, 109-116. doi:10.1024/1421-0185.66.2.109 Forster, J., Grant, H., Chen Idson, L., & Higgins, T. E. (2001). Suc- cess/failure feedback, expectancies, and approach/avoidance motiva- tion: How regulatory focus moderates classic relations. Journal of Experimental Social Psychology, 37, 253-260. Heath, C., Larrick, R. P., & Wu, G. (1999). Goals as reference points. Cognitive Psychology, 38, 79-109. doi:10.1006/cogp.1998.0708 Higgins, T. E. (1997). Beyond pleasure and pain. American Psycholo- gist, 52, 1280-1300. doi:10.1037/0003-066X.52.12.1280 Higgins, T. E. (2000). Making a good decision: Value from fit. Ameri- can Psychologist, 55, 1215-1230. doi:10.1037/0003-066X.55.11.1217 Higgins, T. E., Friedman, R. S., Harlow, R. E., Chen Idson, L., Aykuk, O. N., & Taylor, A. (2001). Achievement orientations from subjec- tive histories of success: Promotion pride versus prevention pride. European Journal of Social Psychology, 31, 3-23. doi:10.1002/ejsp.27 Higgins, T. E., Roney, C., Crowe, E., & Hymes, C. (1994). Ideal versus ought predilections for approach and avoidance: Distinct self-regulatory systems. Journal of Personality and Social Psychol- ogy, 66, 276-286. doi:10.1037/0022-3514.66.2.276 Idson, L. C., & Higgins, E. T. (2000). Howe current feedback and chronic effectiveness influence motivation: Everything to gain versus everything to lose. European Journal of Social Psychology, 30, 583-592. doi:10.1002/1099-0992(200007/08)30:4<583::AID-EJSP9>3.0.CO;2-S Karoly, P. (1993). Mechanisms of self-regulation: A systems view. Annual Review of Psychology, 44, 23-52. Locke, E. A., & Latham, G. P. (1984). Goal setting: A motivational technique that works!. Englewood Cliffs, NJ: Prentice Hall. Locke, E. A., & Latham, G. P. (1990). A theory of goal setting and task performance. Englewood Cliffs, NJ: Prentice Hall. Locke, E. A., & Latham, G. P. (2002). Building a practically useful theory of goal setting and task motivation: A 35-year odyssey. American Psychologist, 57, 705-717. doi:10.1037/0003-066X.57.9.705 Lockwood, P., Jordan, C. H., & Kunda, Z. (2002). Motivation by posi- tive or negative role models: regulatory focus determines who will best inspire us. Journal of Personality and Social Psychology, 83, 854-864. doi:10.1037/0022-3514.83.4.854 Phillips, J. M., Hollenbeck, J. R., & Ilgen, D. R. (1996). Prevalence and prediction of positive discrepancy creation: Examining a discrepancy between two self-regulation theories. Journal of Applied Psychology, 81, 498-511. doi:10.1037/0021-9010.81.5.498 Shah, J., & Higins T. E. (1997). Expectancy X value effects: Regu- latory focus as a determinant of magnitude and direction. Journal of Personality and Social Psychology, 73, 447-458. Spiegel, S., & Higgins, T. E. (2001). Regulatory focus and means sub- stitution in strategic task performance. Unpublished manuscript, Columbia University. Tabachnick, B. G., & Fidell, L. S. (2001). Using multivariate statistics (4th ed.). Needman Heights, MA: Allyn & Bacon. Tversky, A., & Kahneman, D. (1992). Advances in prospect theory: Cumulative representations of uncertainty. Journal of Risk and Un- certainty, 5, 297-323. doi:10.1007/BF00122574 Van-Dijk, D., & Kluger, A. N. (2004). Feedback sign effect on motiva- tion: Is it moderated by regulatory focus?. Applied Psychology: An International Review, 53, 113-135. doi:10.1111/j.1464-0597.2004.00163.x Williams, K. J., Donovan, J. J., & Dodge, T. L. (2000). Self-regulation of performance. Goal establishment and goal revision processes in athletes. Human Performance, 13, 159-180. doi:10.1207/s15327043hup1302_3 Wood, R., & Bandura, A. (1989). Social cognitive theory of organiza- tional management. Academy of Management Review, 14, 361-384.
|